The analytics workflow platform
for analysts in the age of AI
Use AI to speed up every stage of your analysis, from getting and wrangling data to visualizing, analyzing, and reporting.
Every step is recorded as a workflow you can review, edit, and rerun at any time.
And you don’t have to stop at summaries and charts. Go deeper with statistics and machine learning to understand what’s really driving your data.
No credit card required.


From getting data to analysis and reporting.
All in one workflow.
Data analysis rarely ends with a single chart or a single summary.
You get the data, clean it up, explore it, analyze it, and share what you found.
Exploratory lets you do all of it in one place.
Get Data
Pull in data from databases, cloud services, CSV and Excel files, APIs, and more.
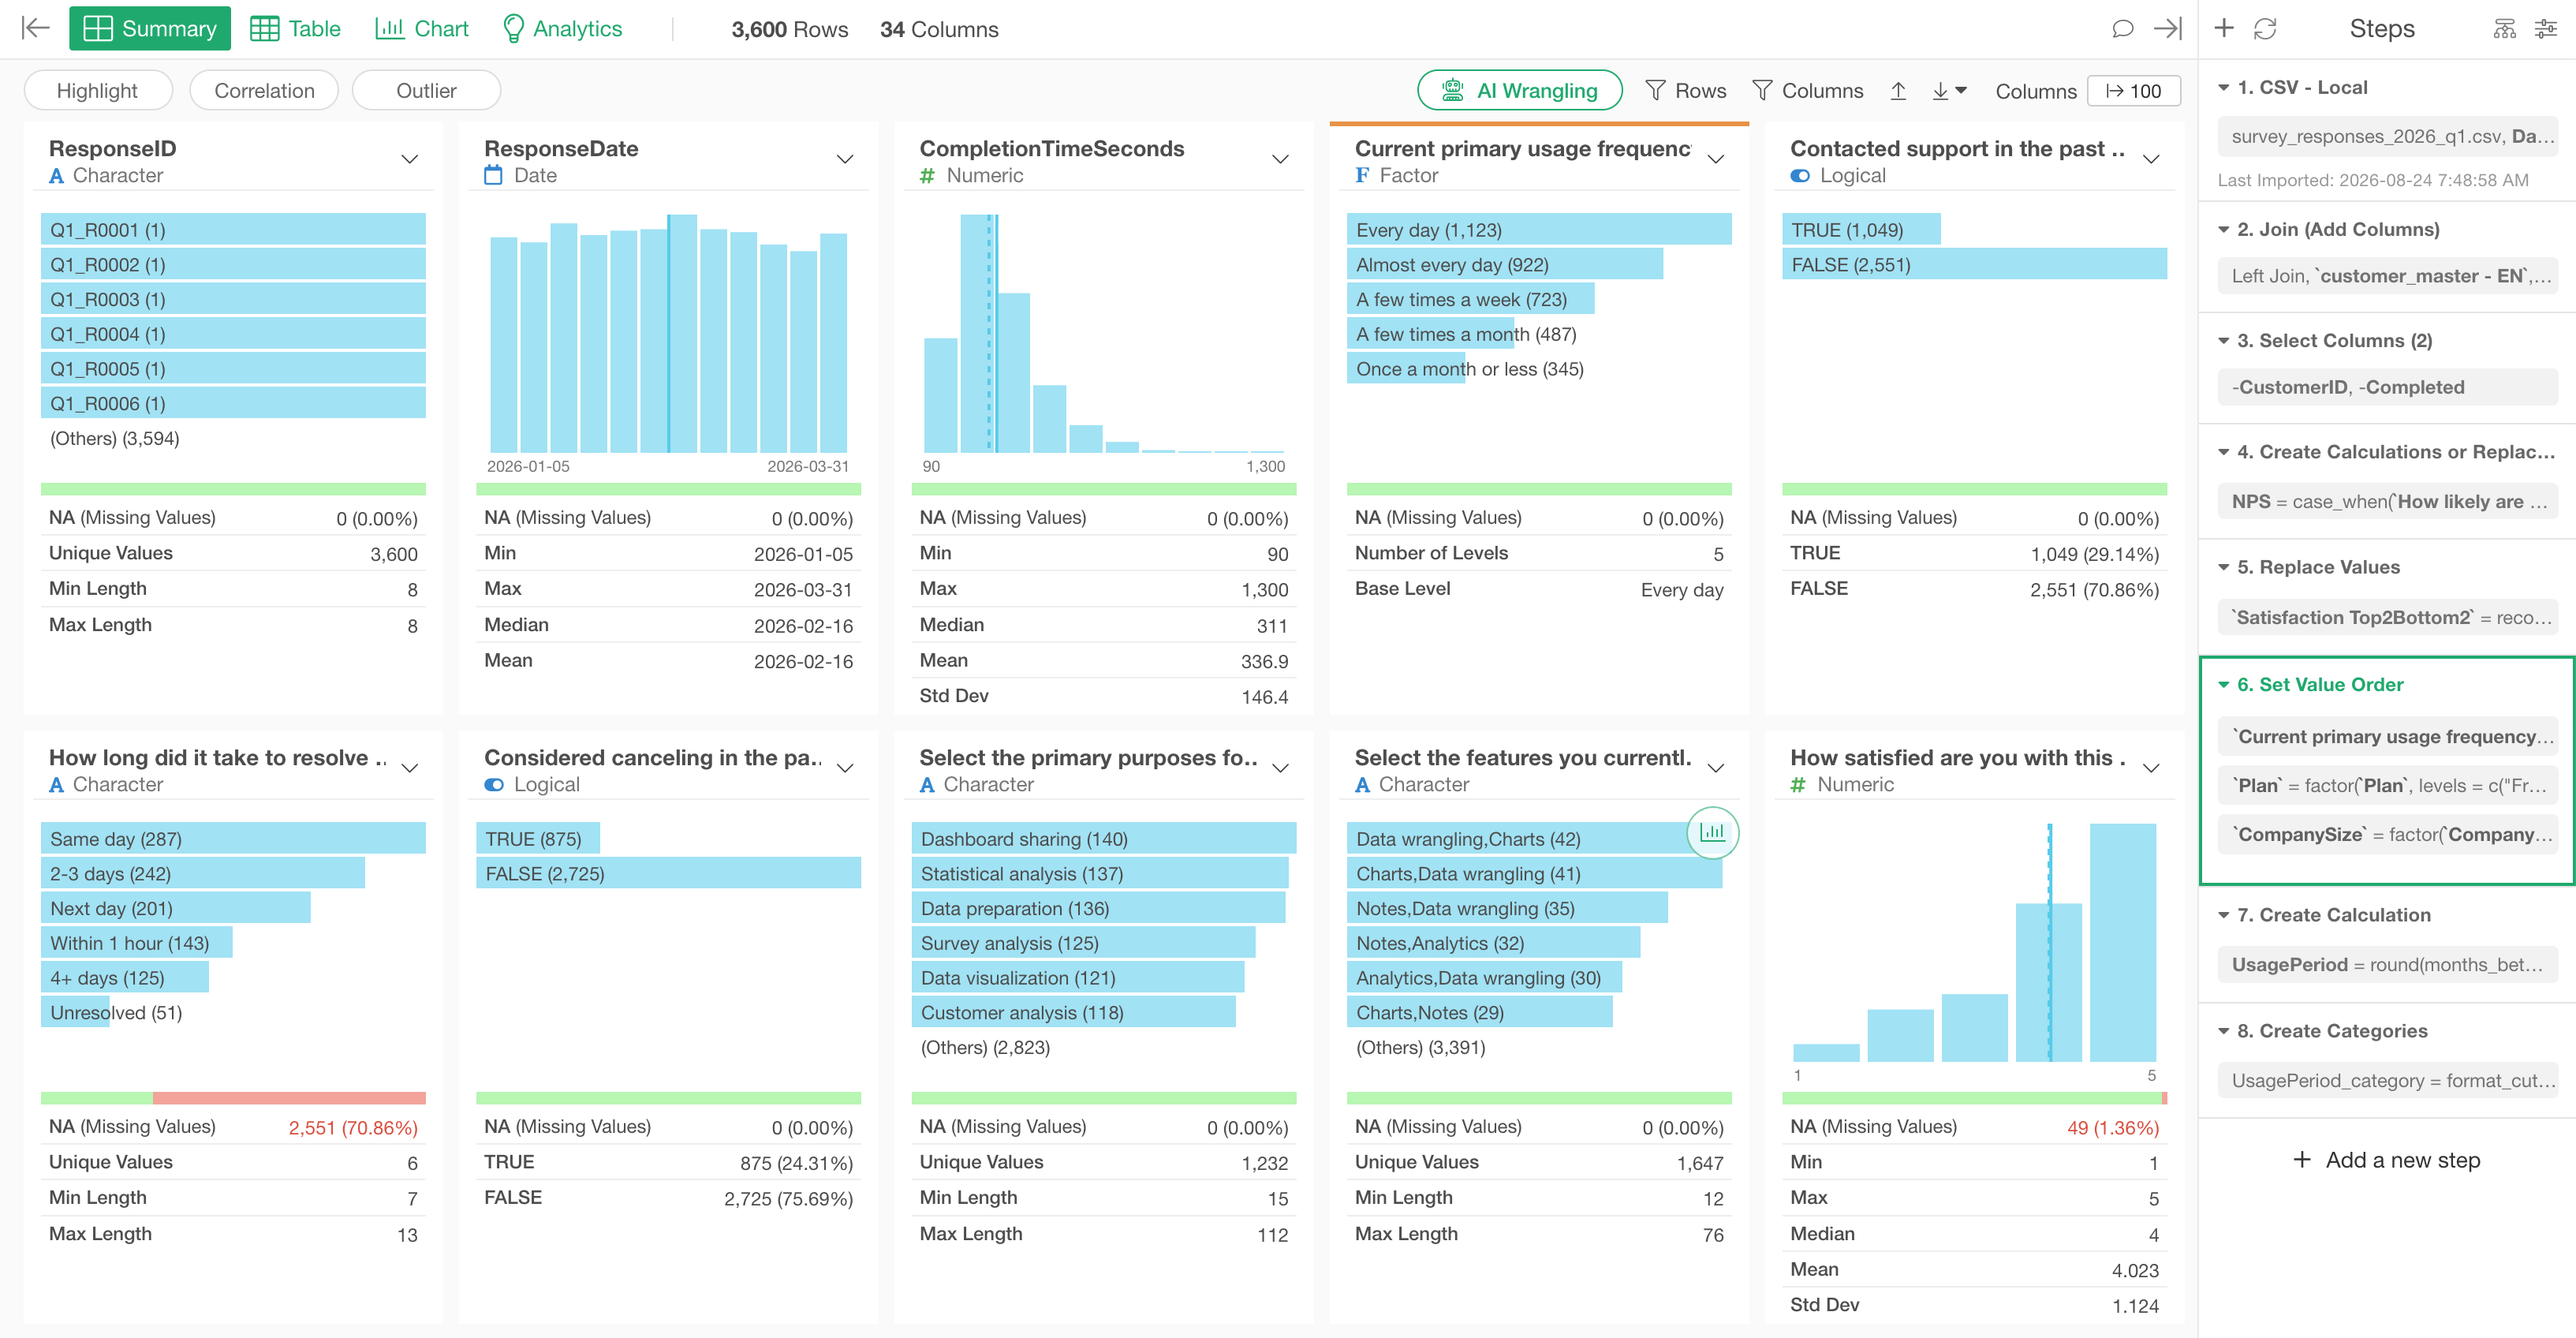
With AI Data, just describe the data you need in plain language, and AI builds the steps to get it.
Summarize Data
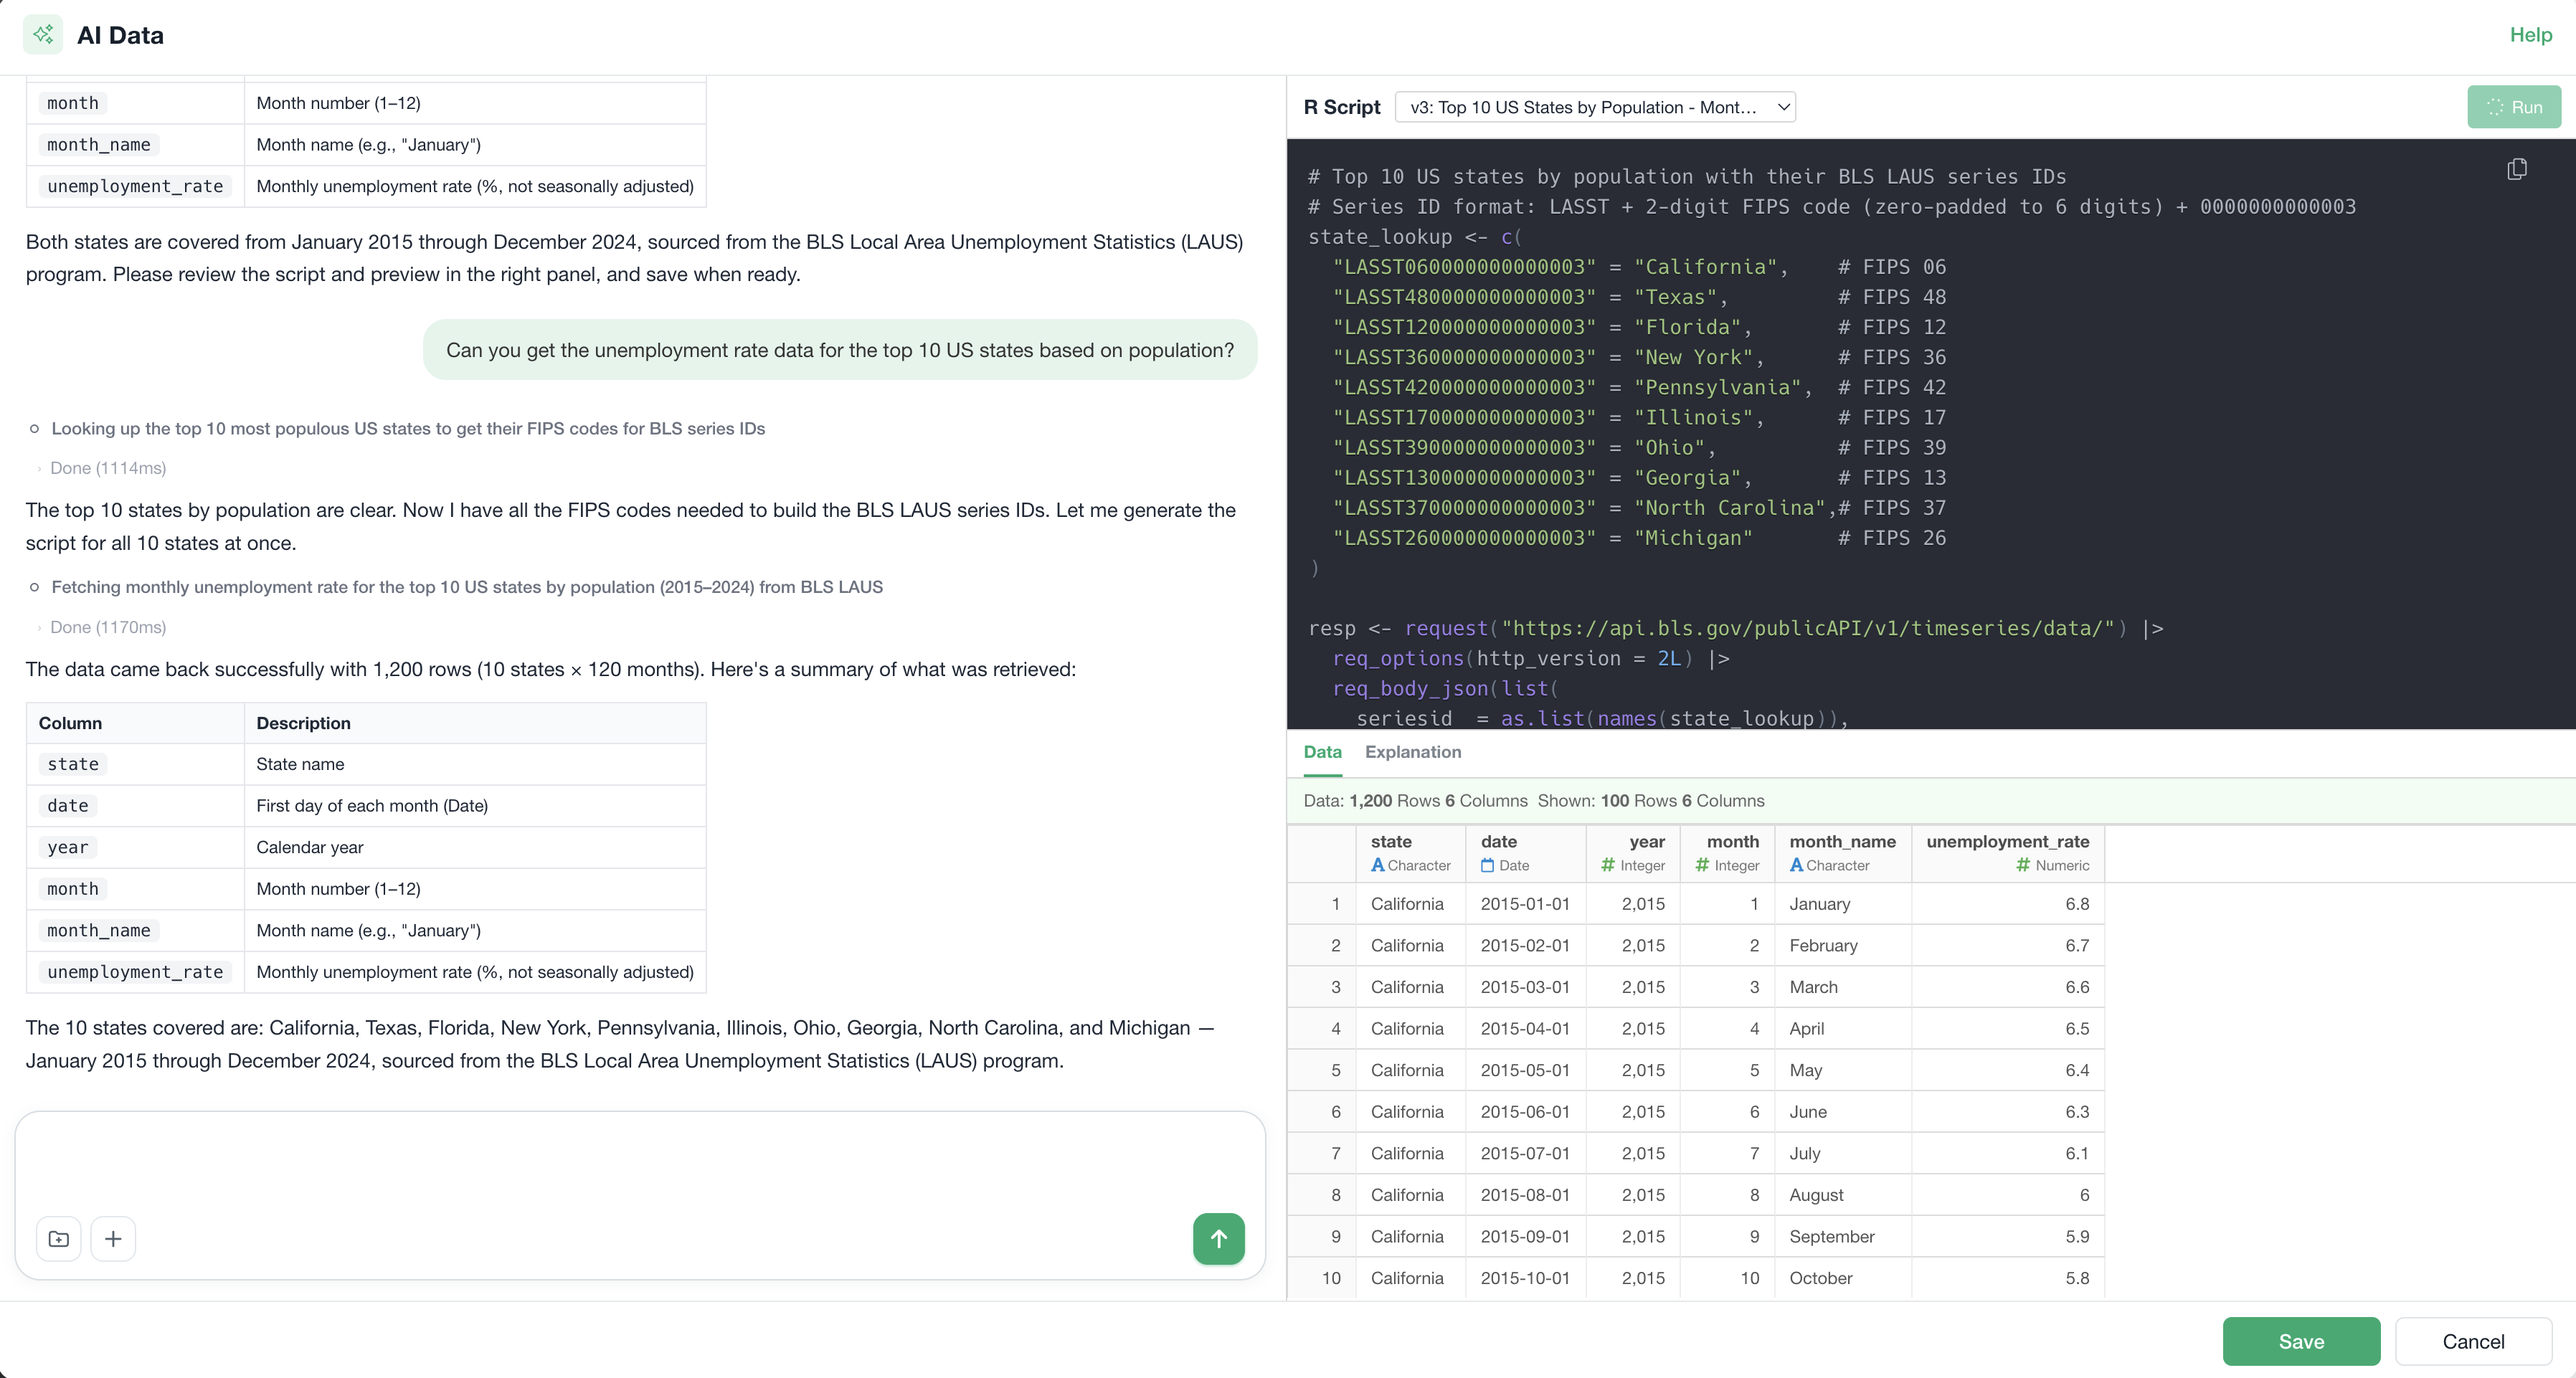
Check row counts, missing values, distributions, summary statistics, and category counts to get a feel for the whole dataset first.
Understanding the state of your data up front helps you spot outliers and data quality issues, and quickly decide where to look next.
Wrangle Data
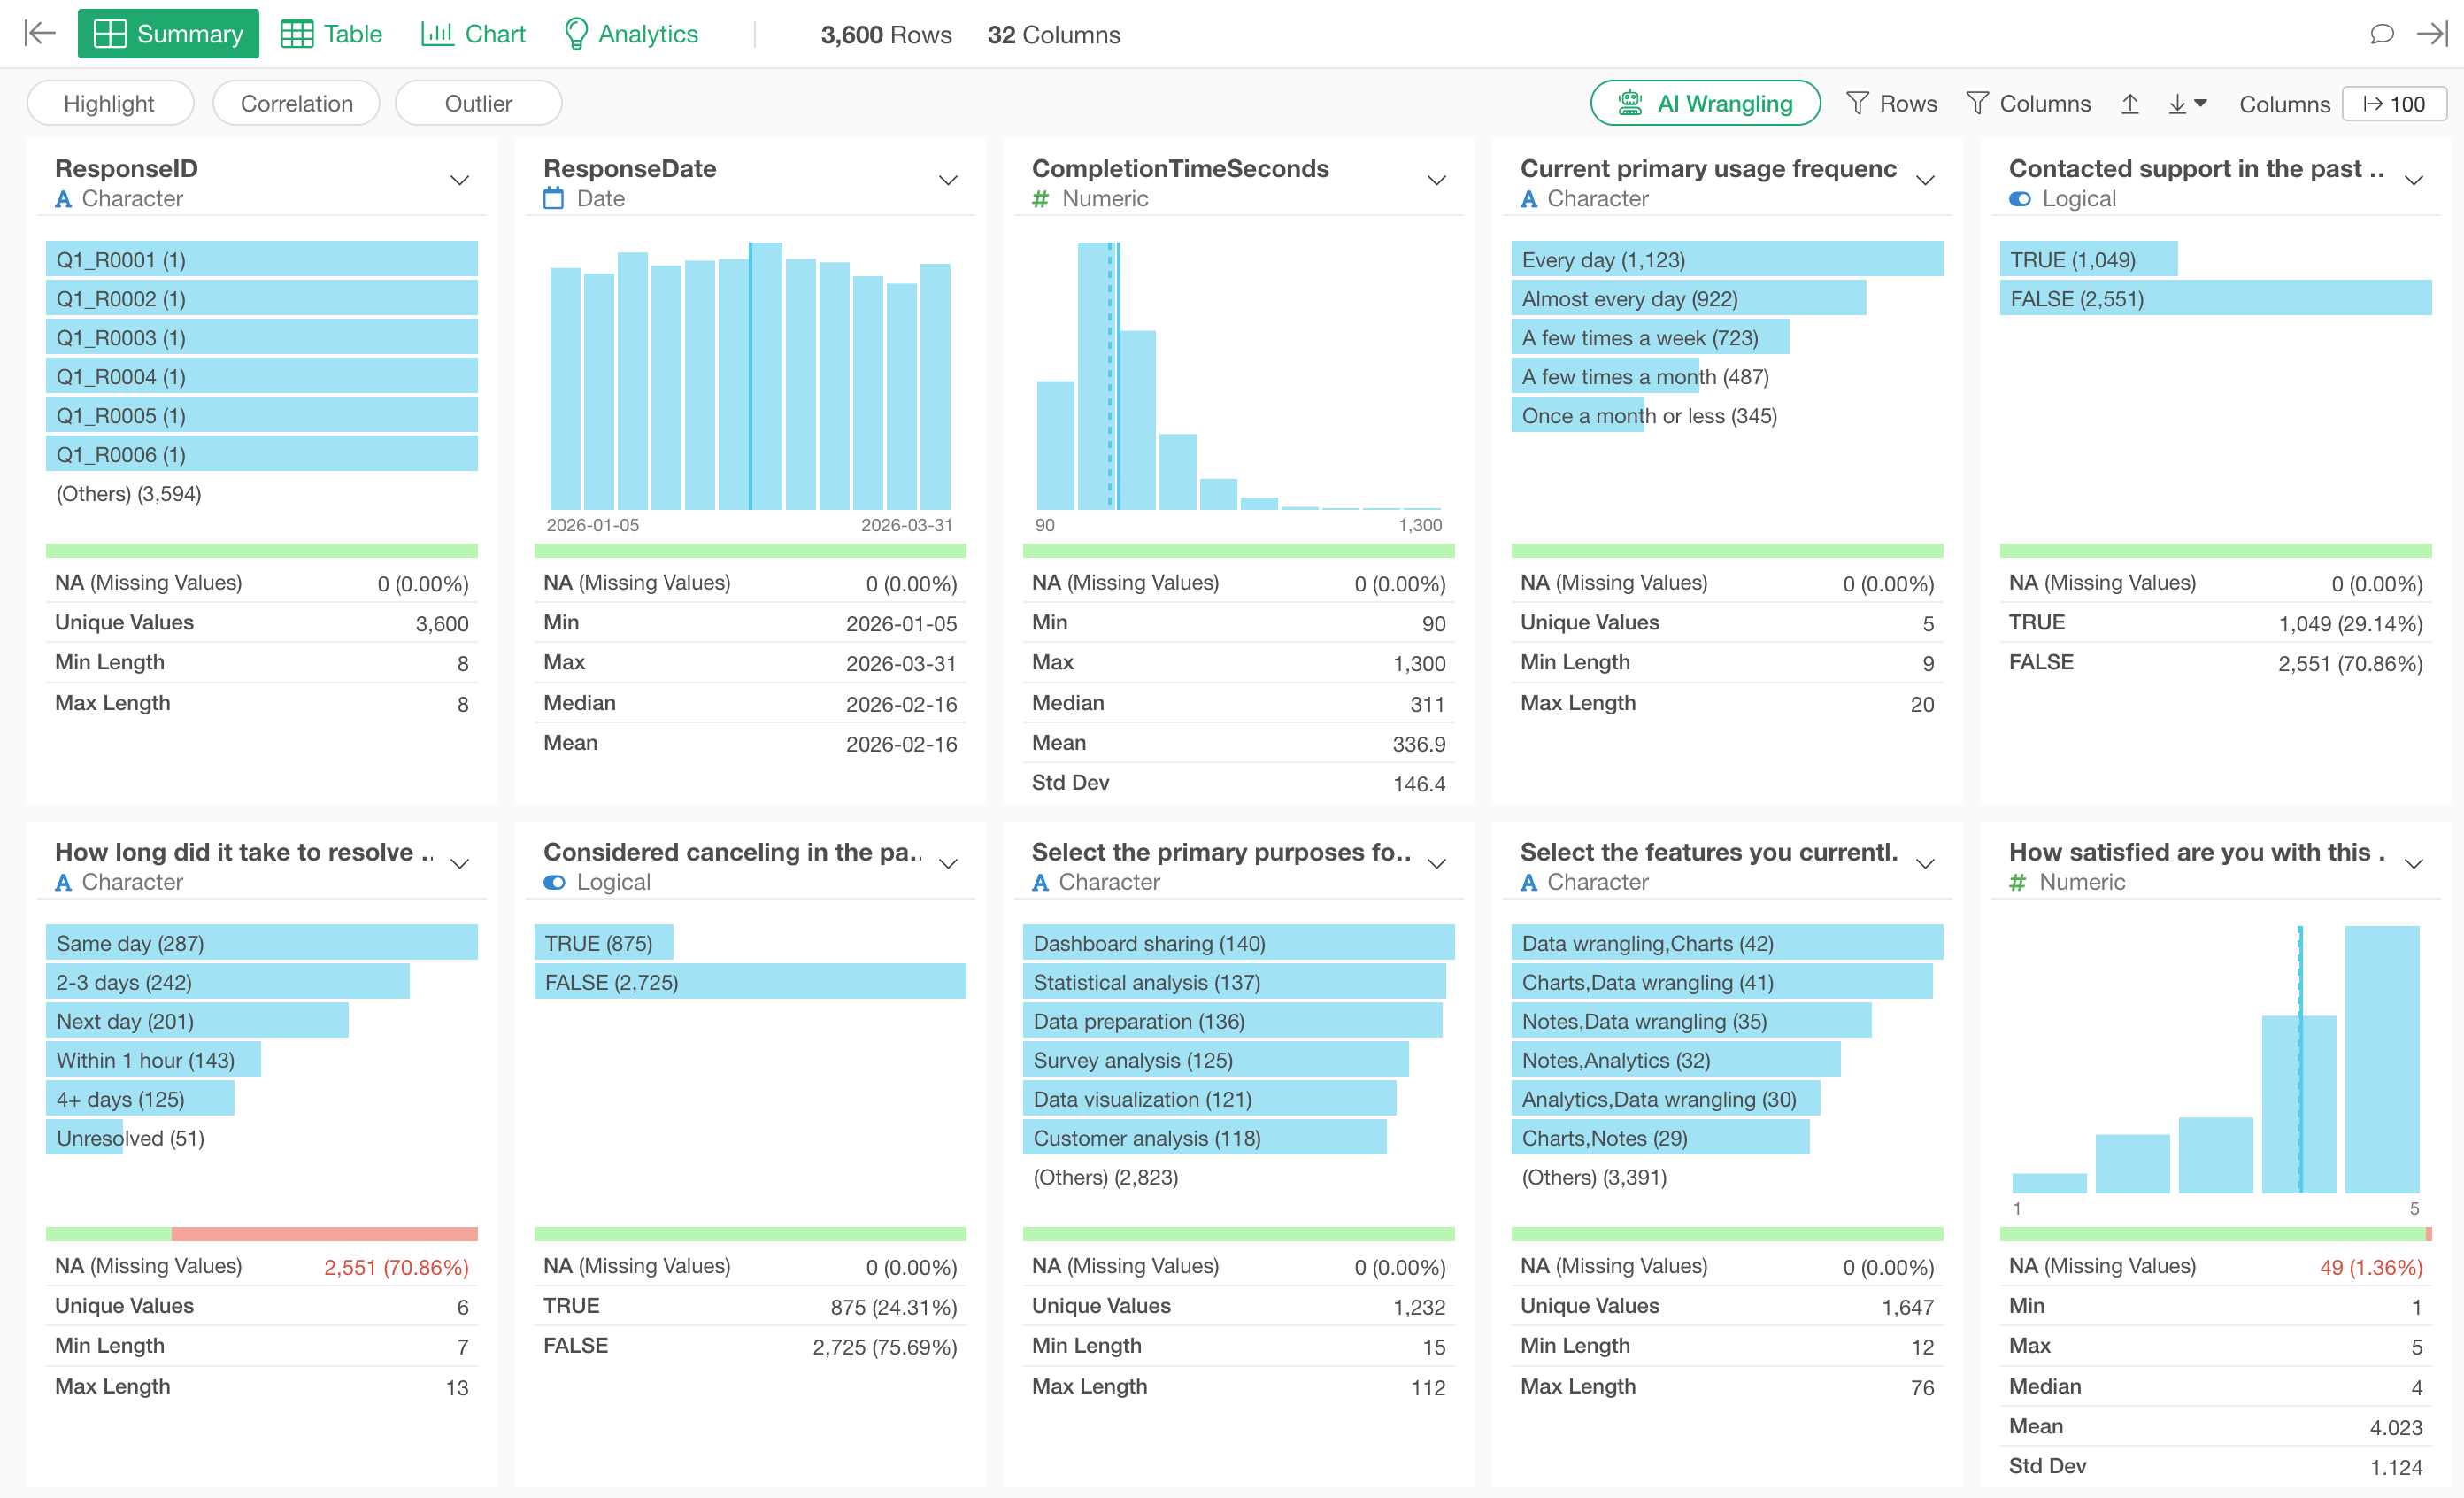
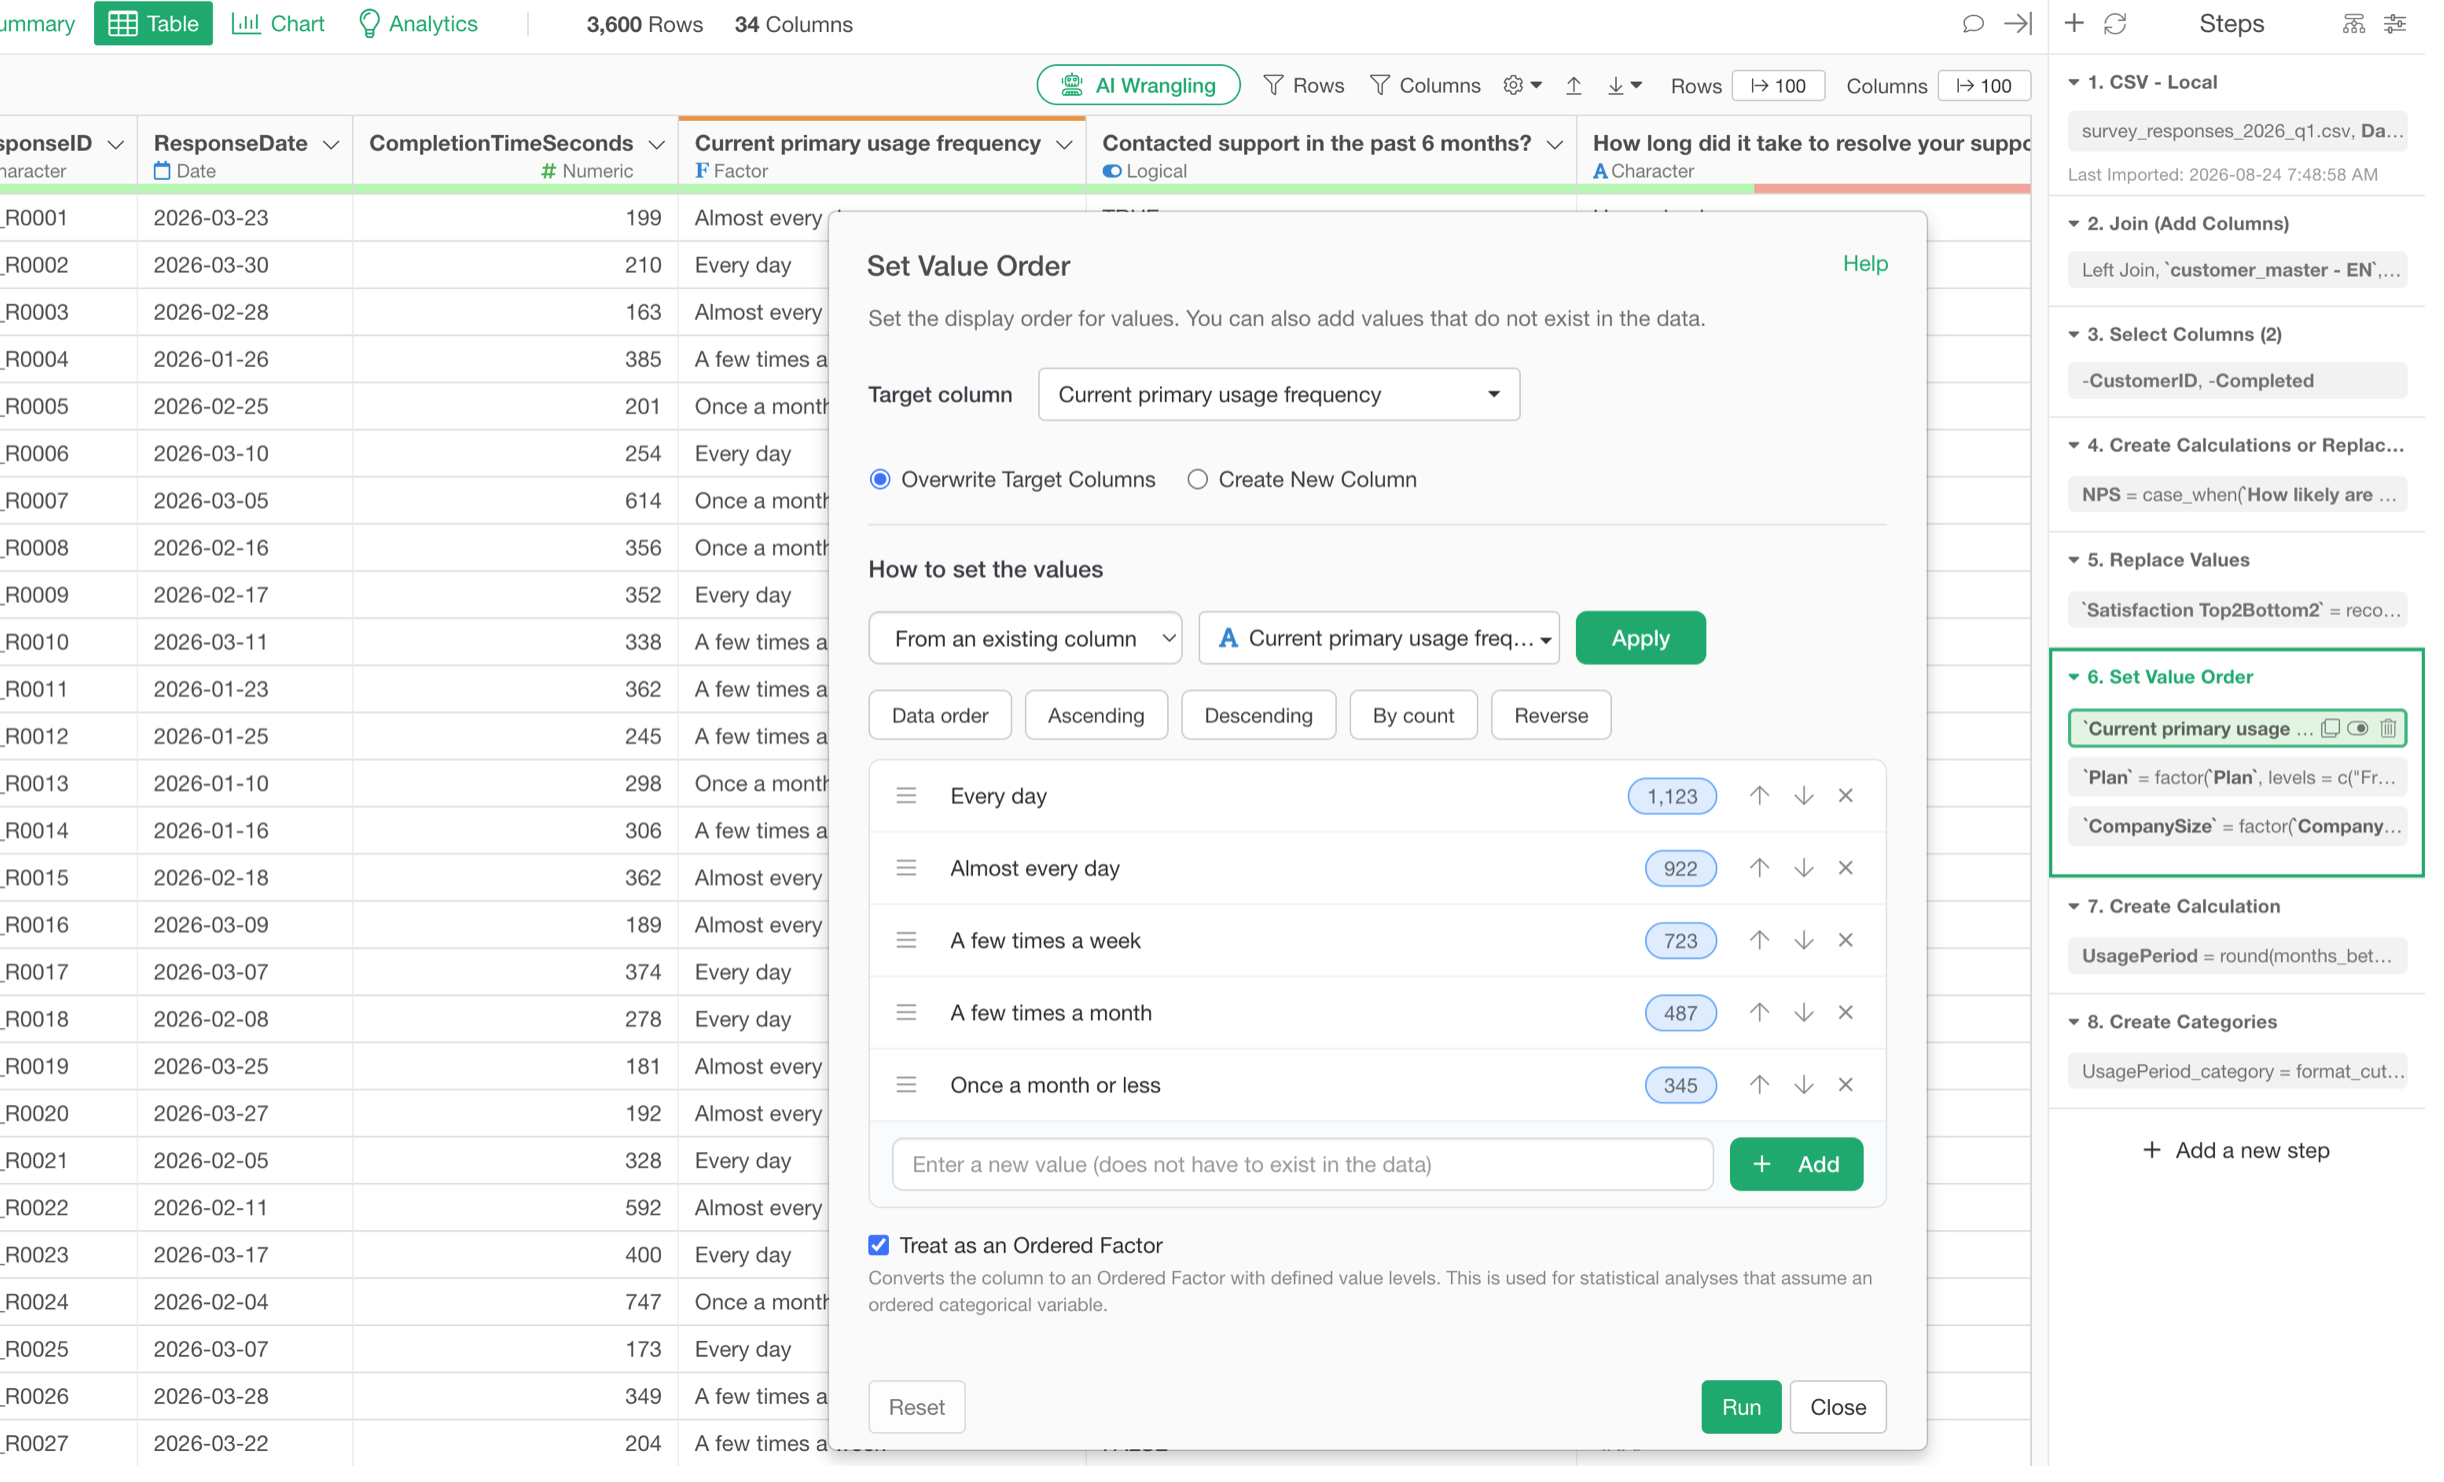
Set orders for categories, handle missing values, create calculations, filter, aggregate, join, and reshape between wide and long formats, building up each transformation as a step.
Every step is recorded, so you can review, fix, and reuse it later.
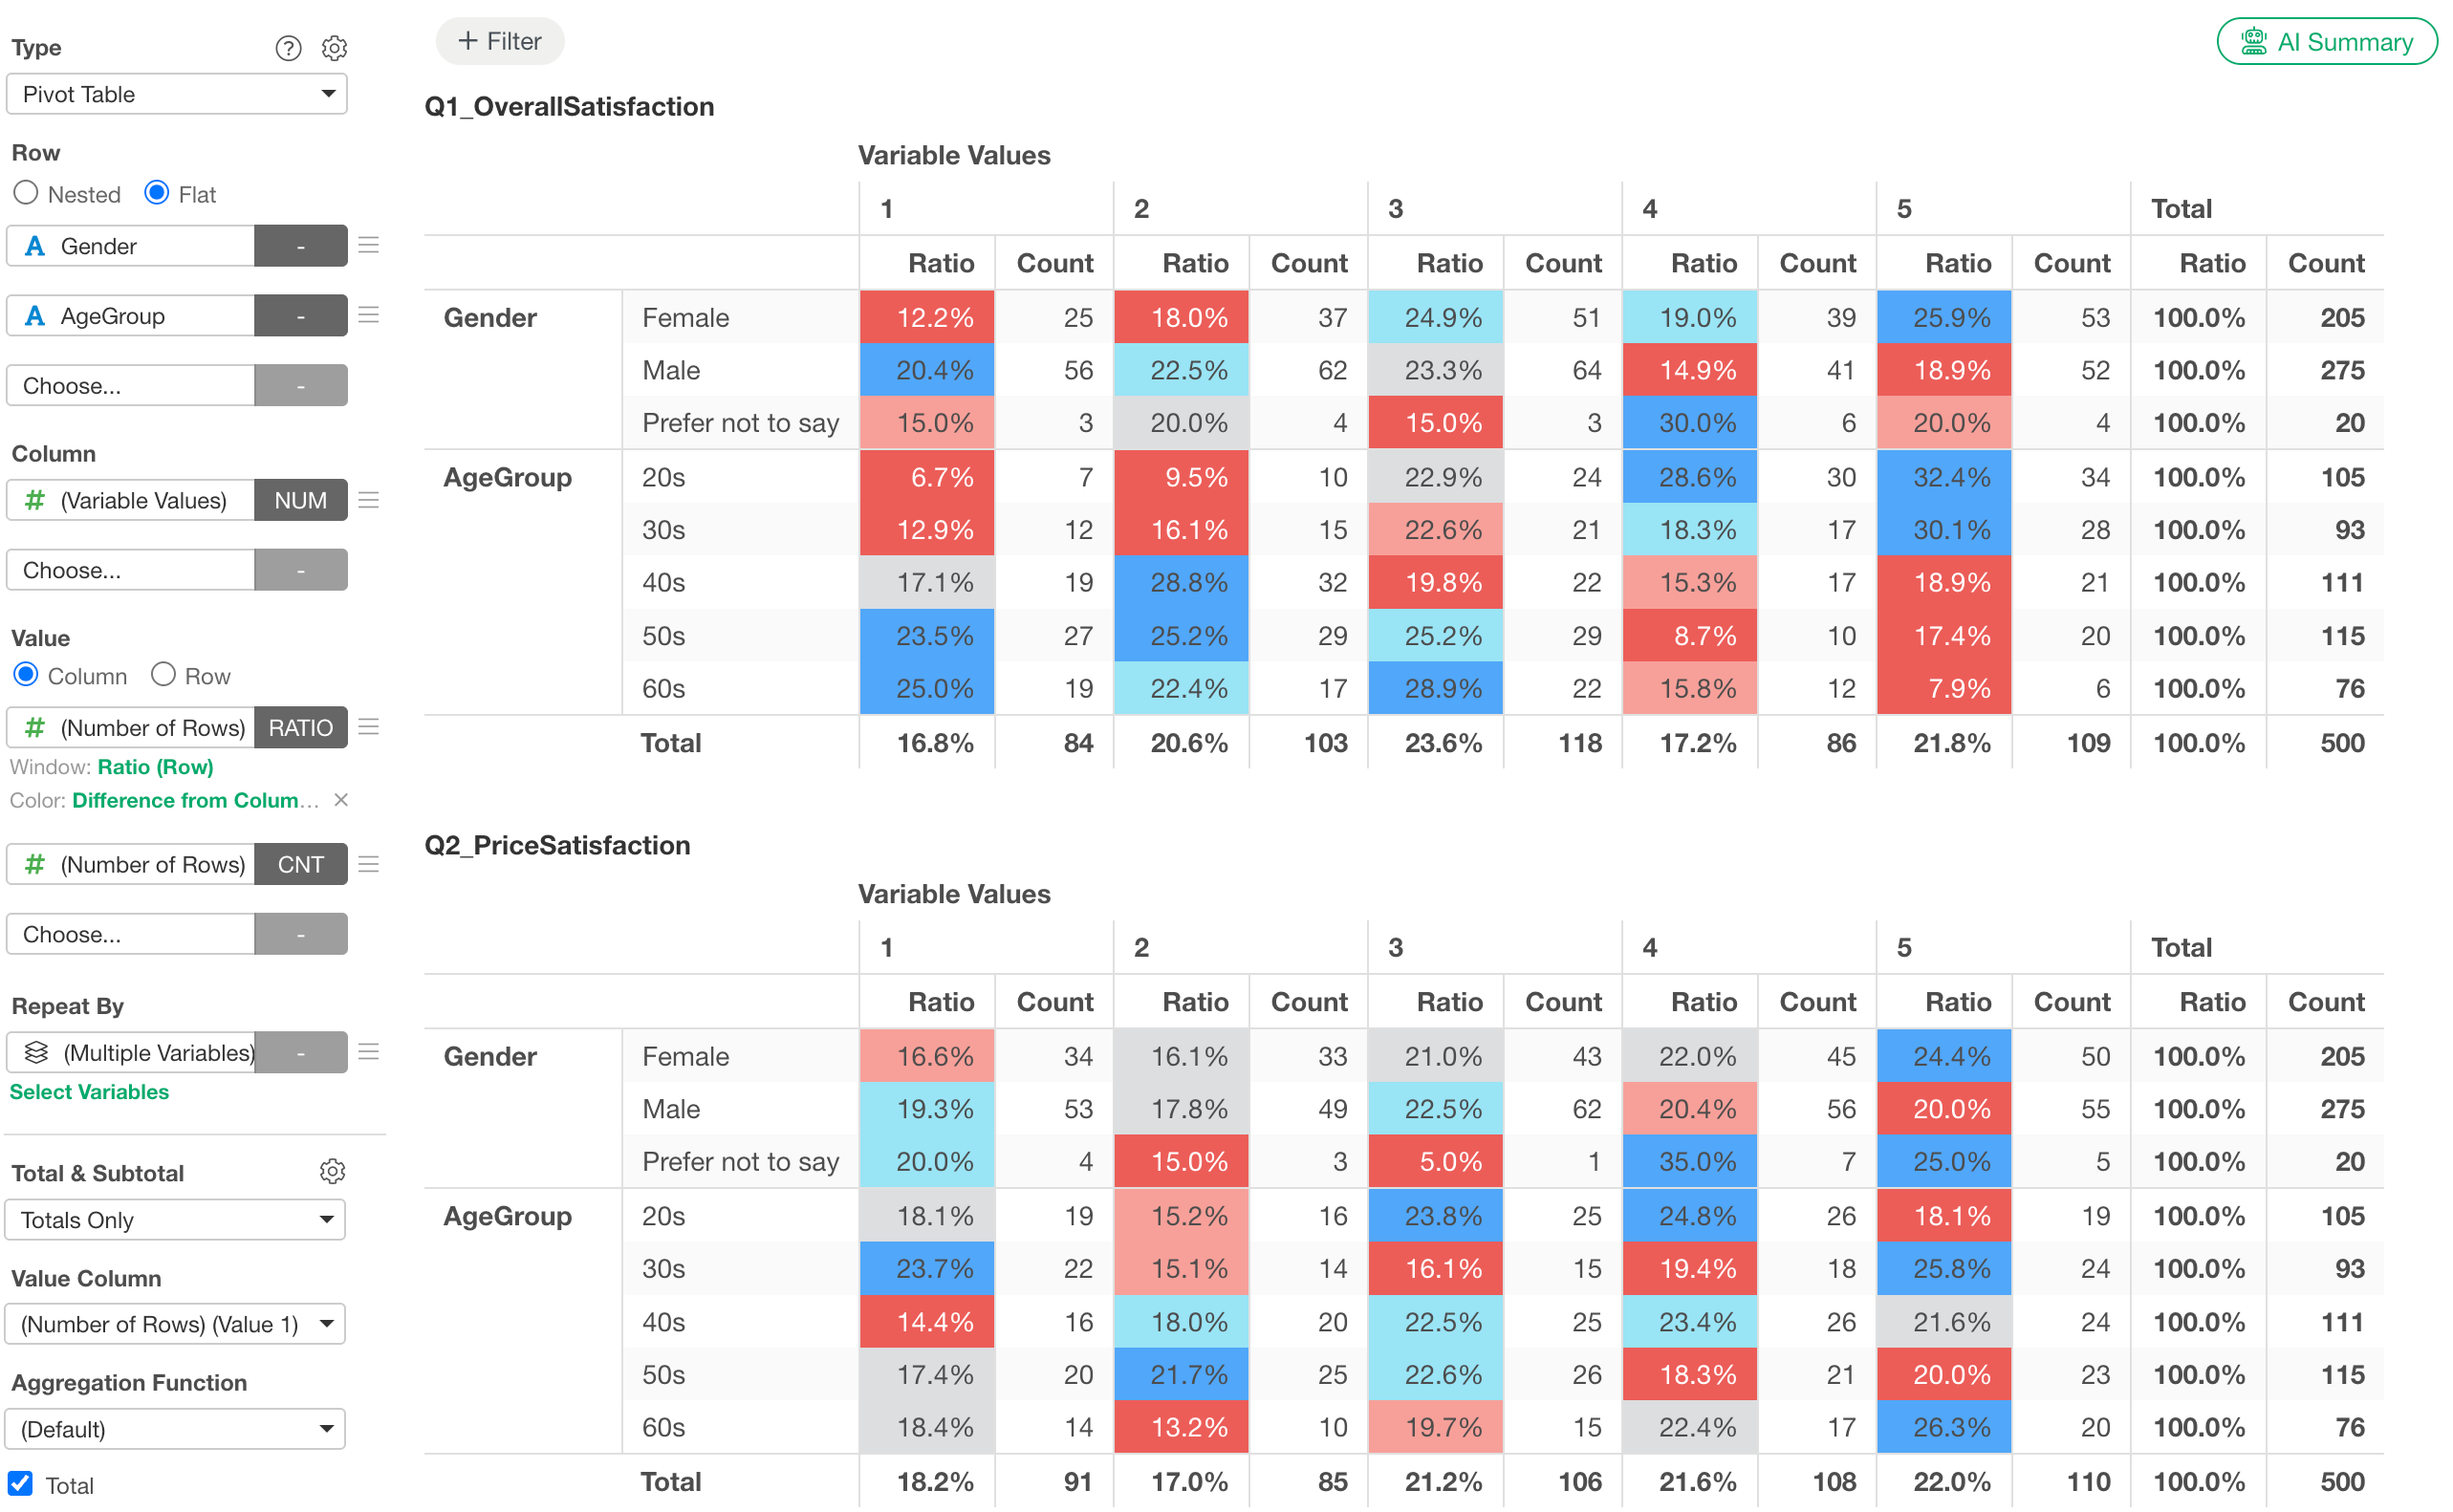
Cross-Tabulate
Break your data down by multiple variables to compare differences and trends across groups.
Check counts, percentages, and averages in pivot tables to surface the patterns and differences worth a closer look.
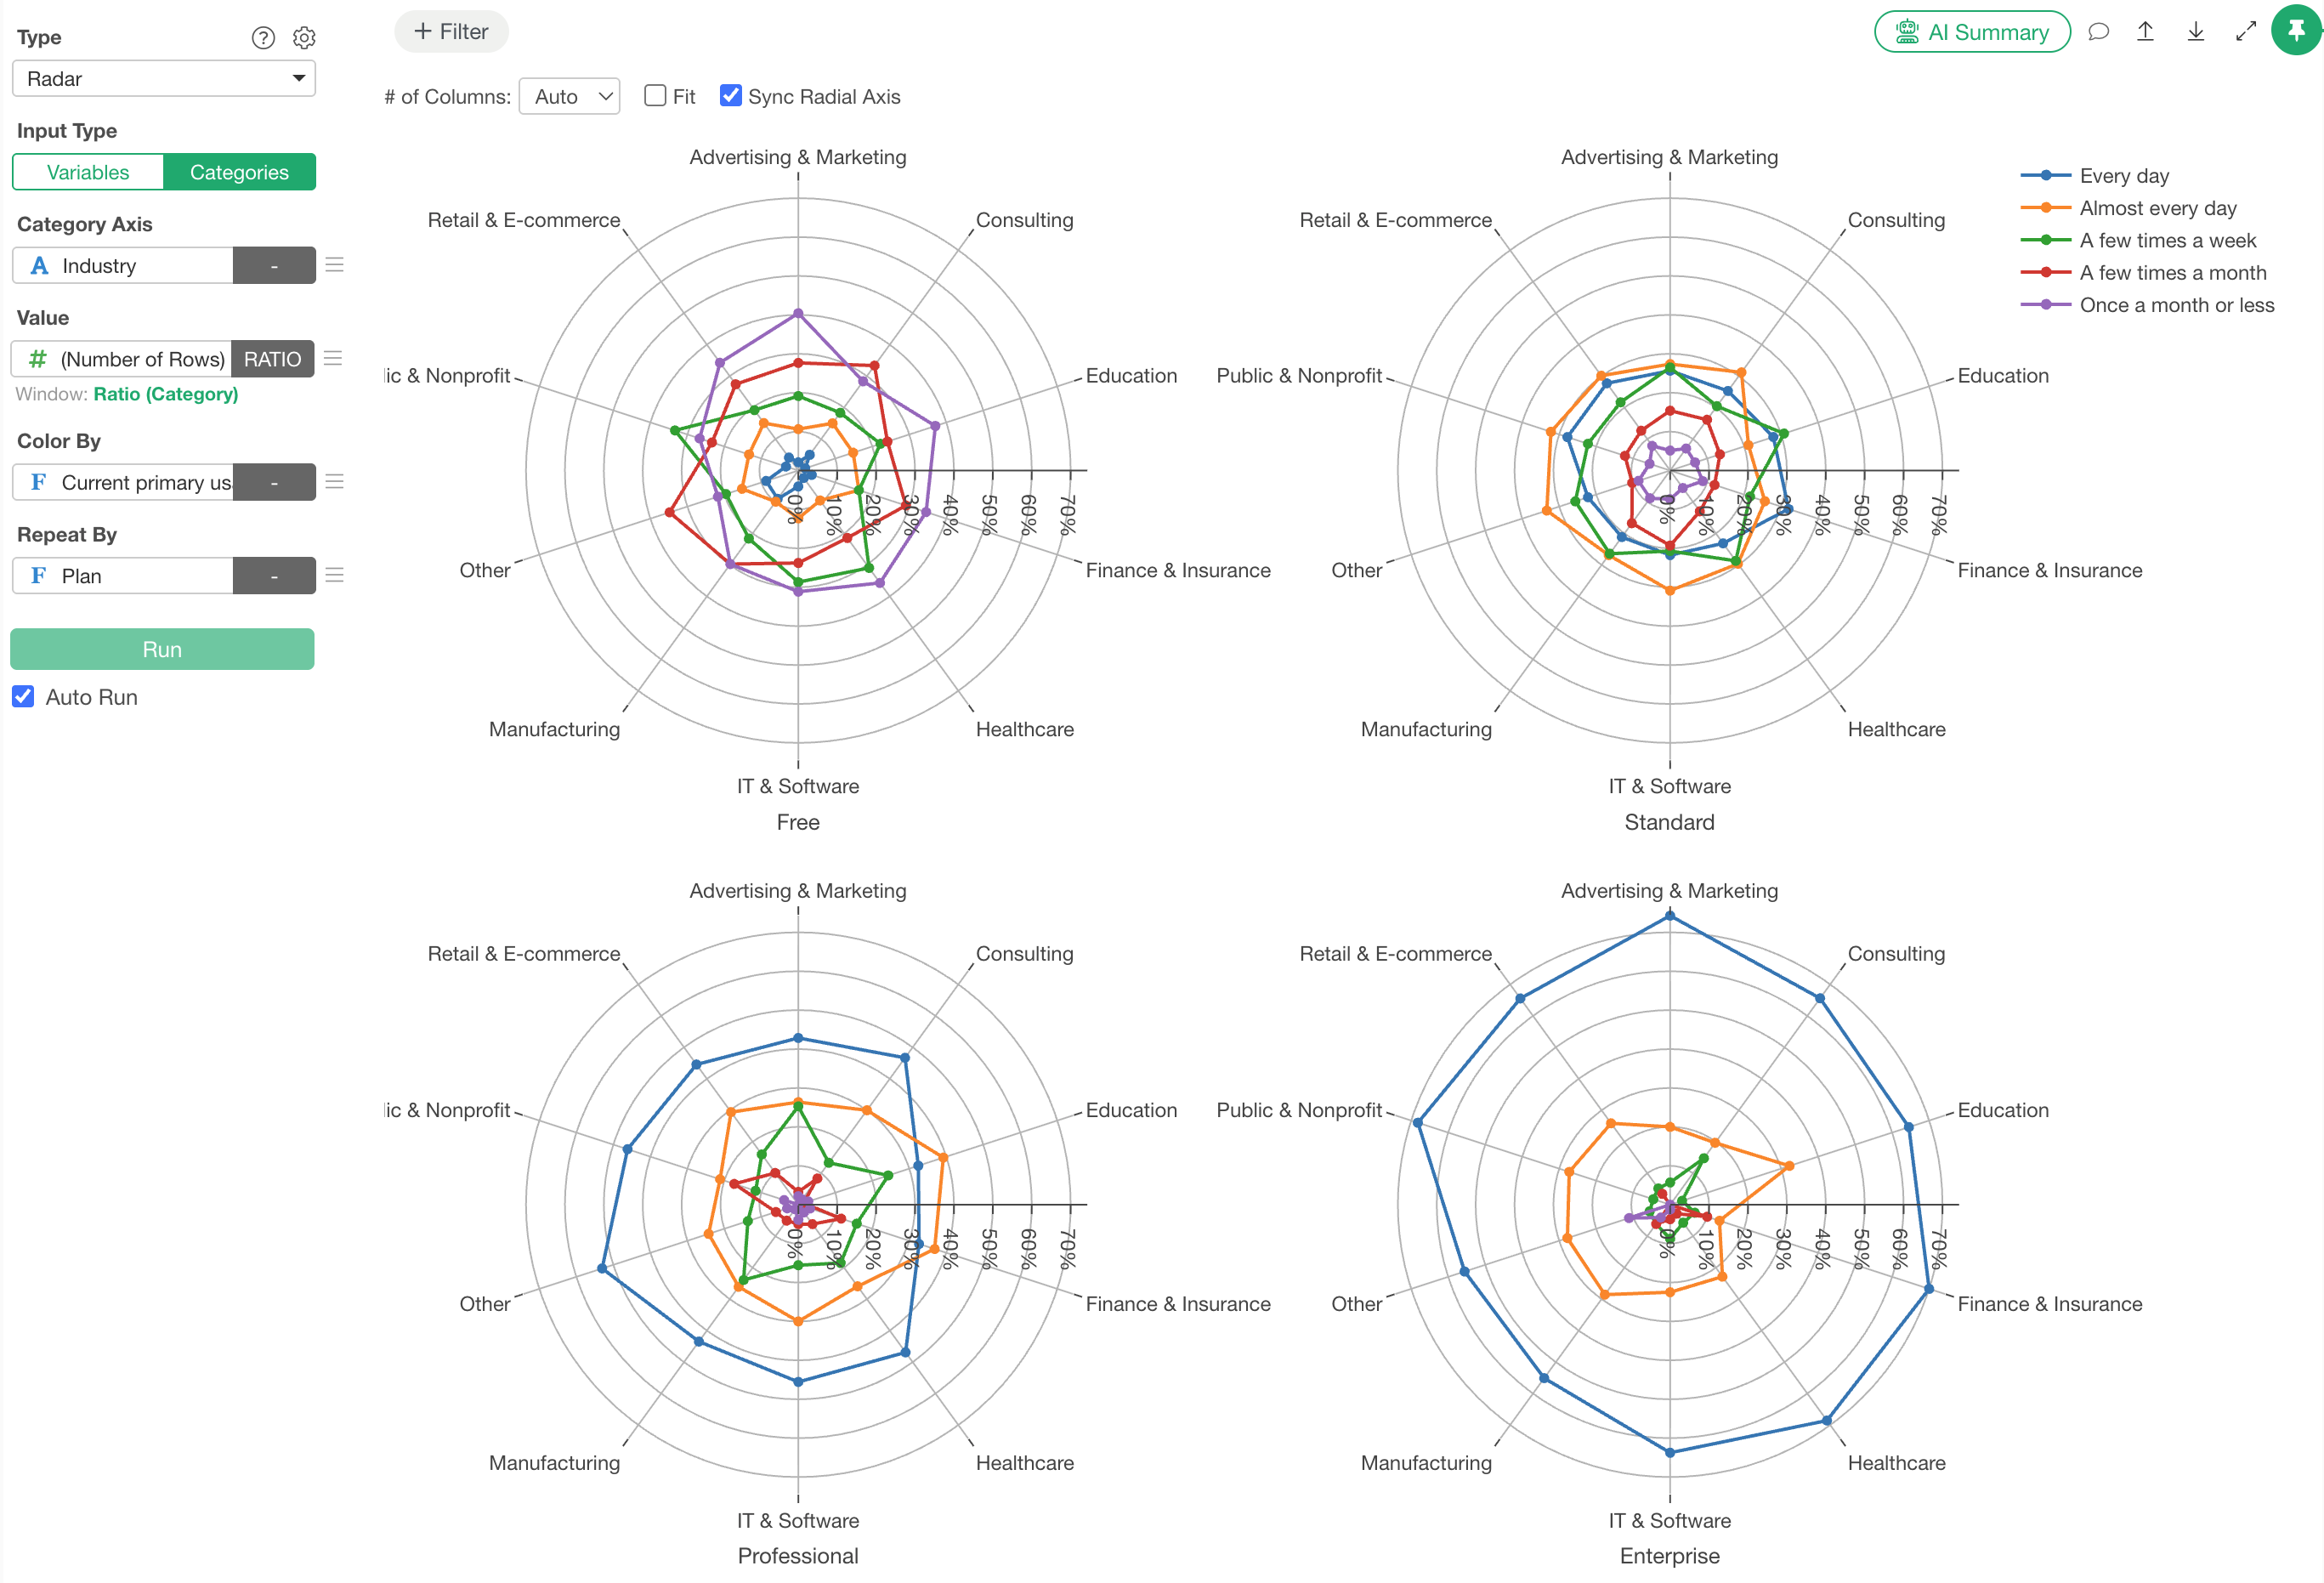
Visualize and Explore
Explore distributions, changes over time, differences, and relationships between variables with a wide range of charts.
When a pattern catches your eye, slice the data a different way or move straight on to statistical analysis.
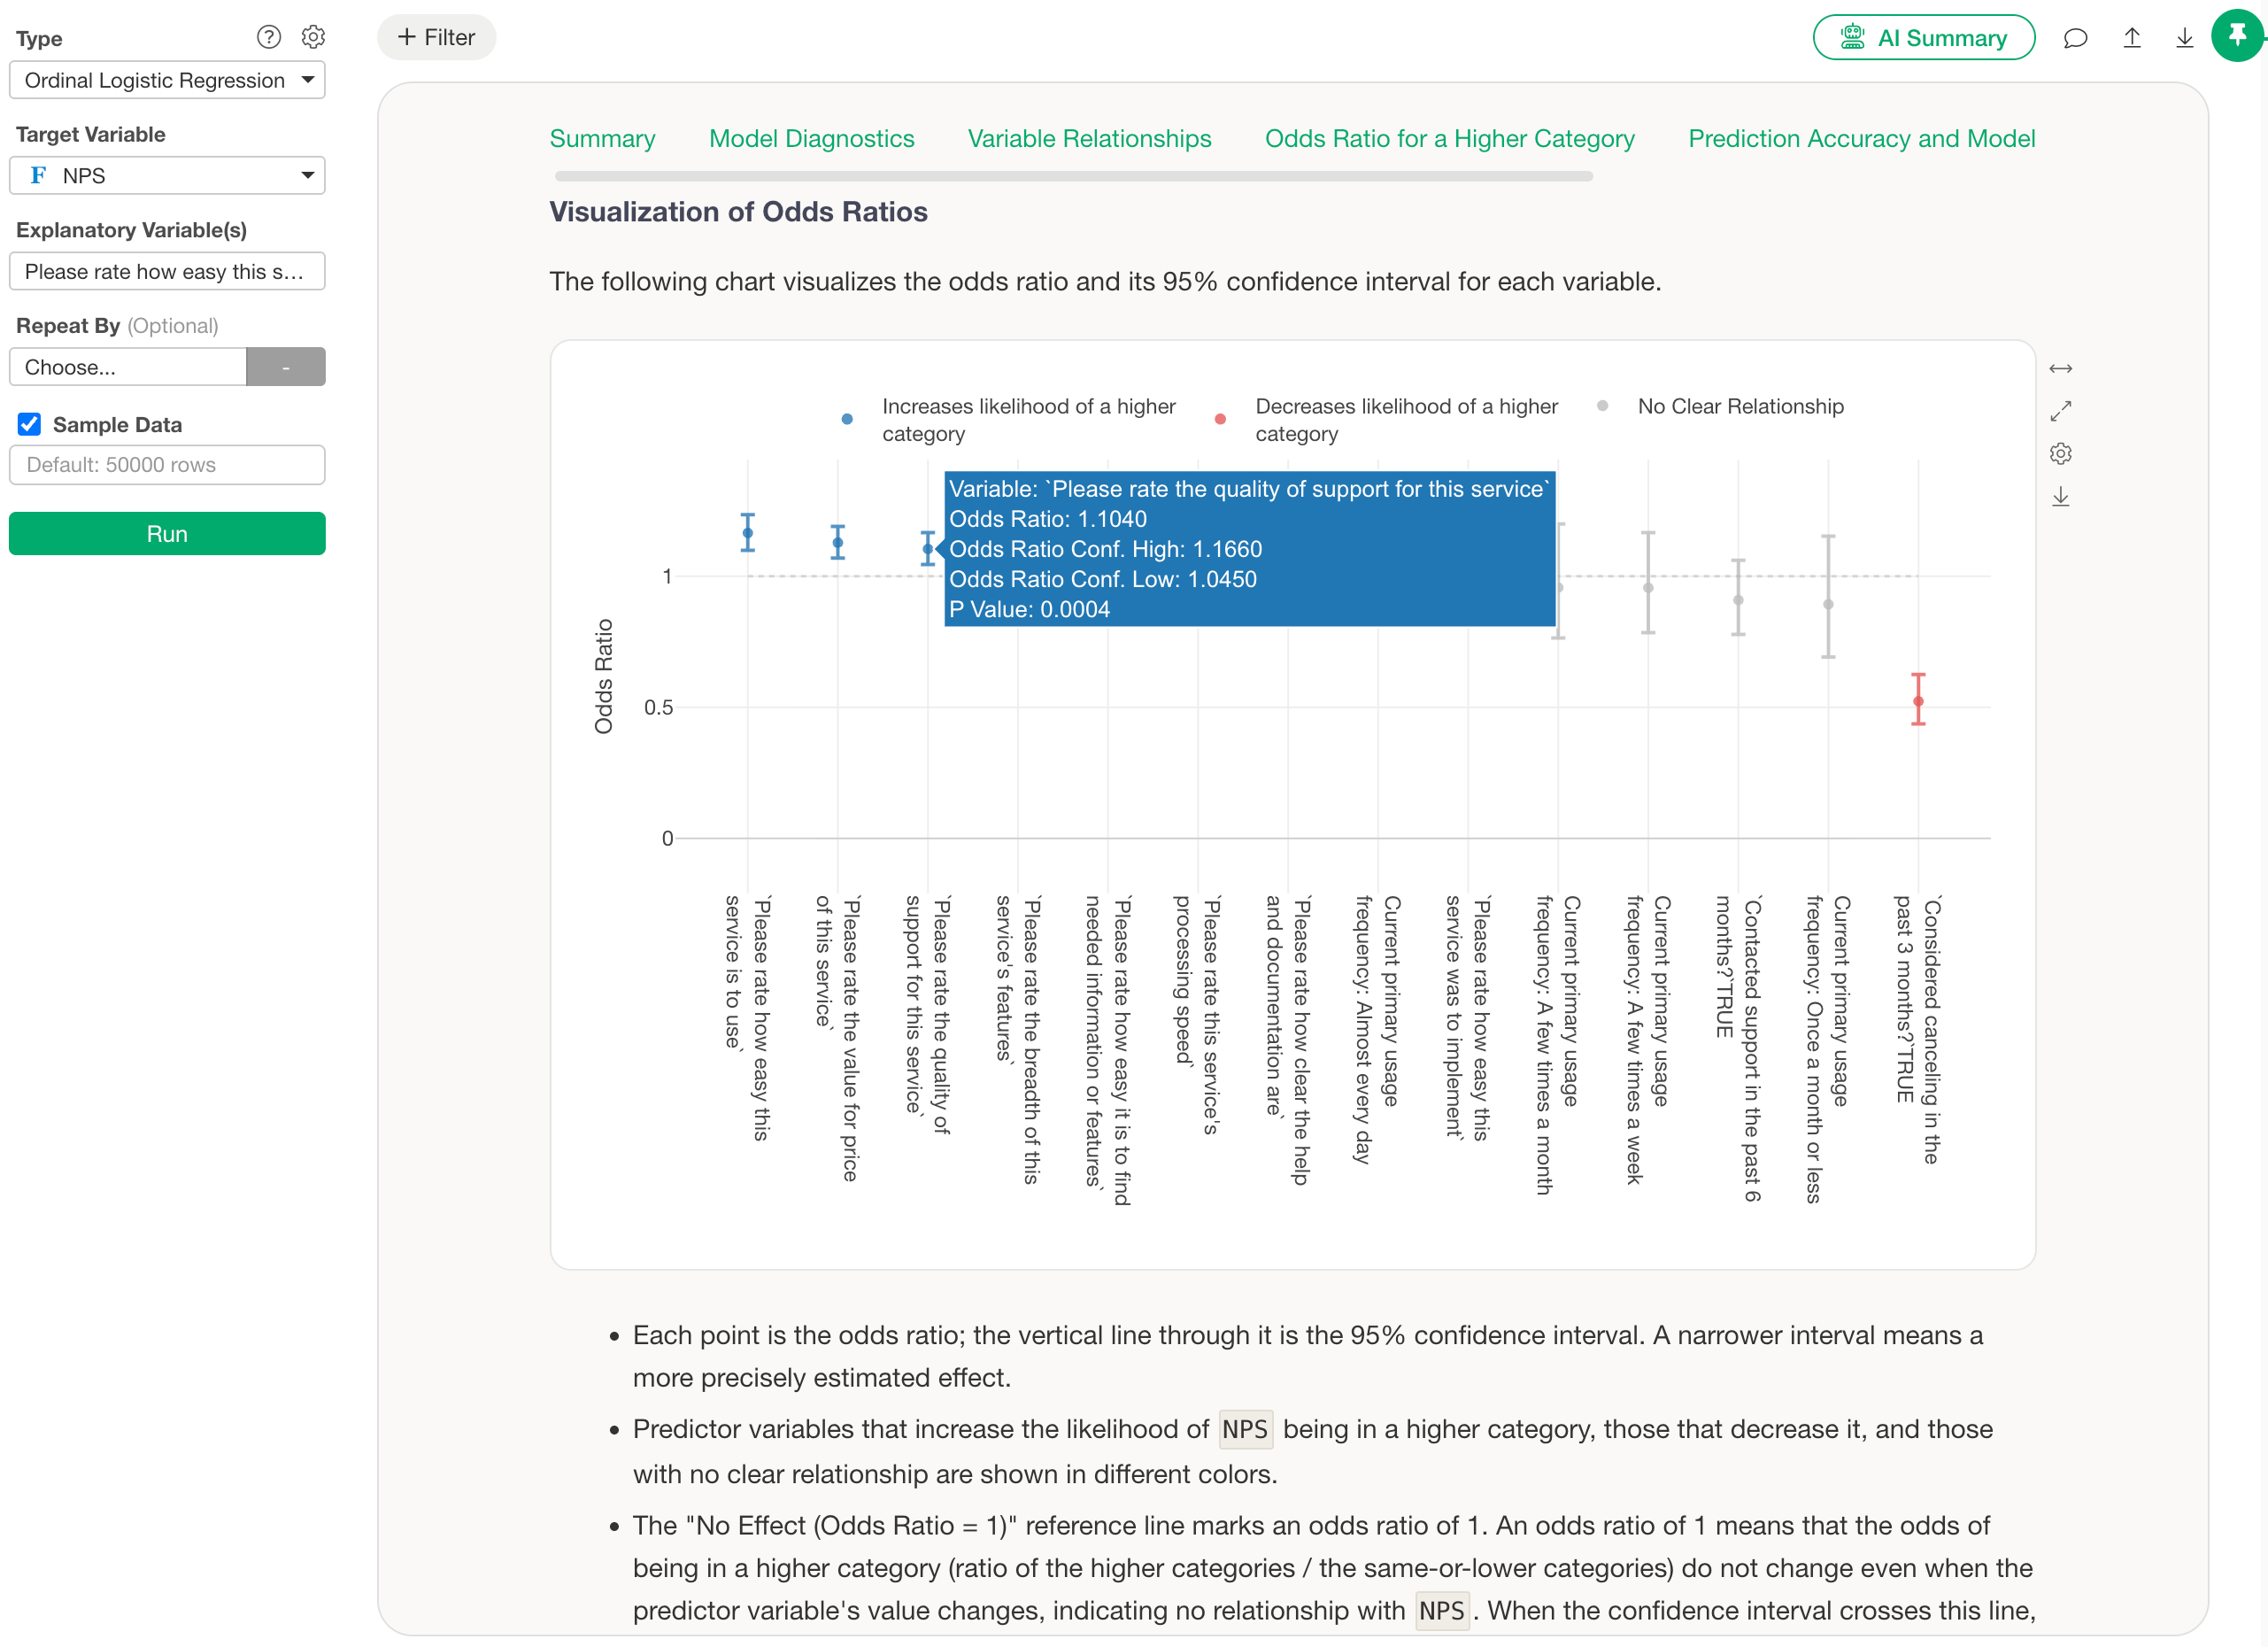
Analyze Statistically
Take the differences and relationships you found in your charts further with statistical tests, regression, decision trees, clustering, and more.
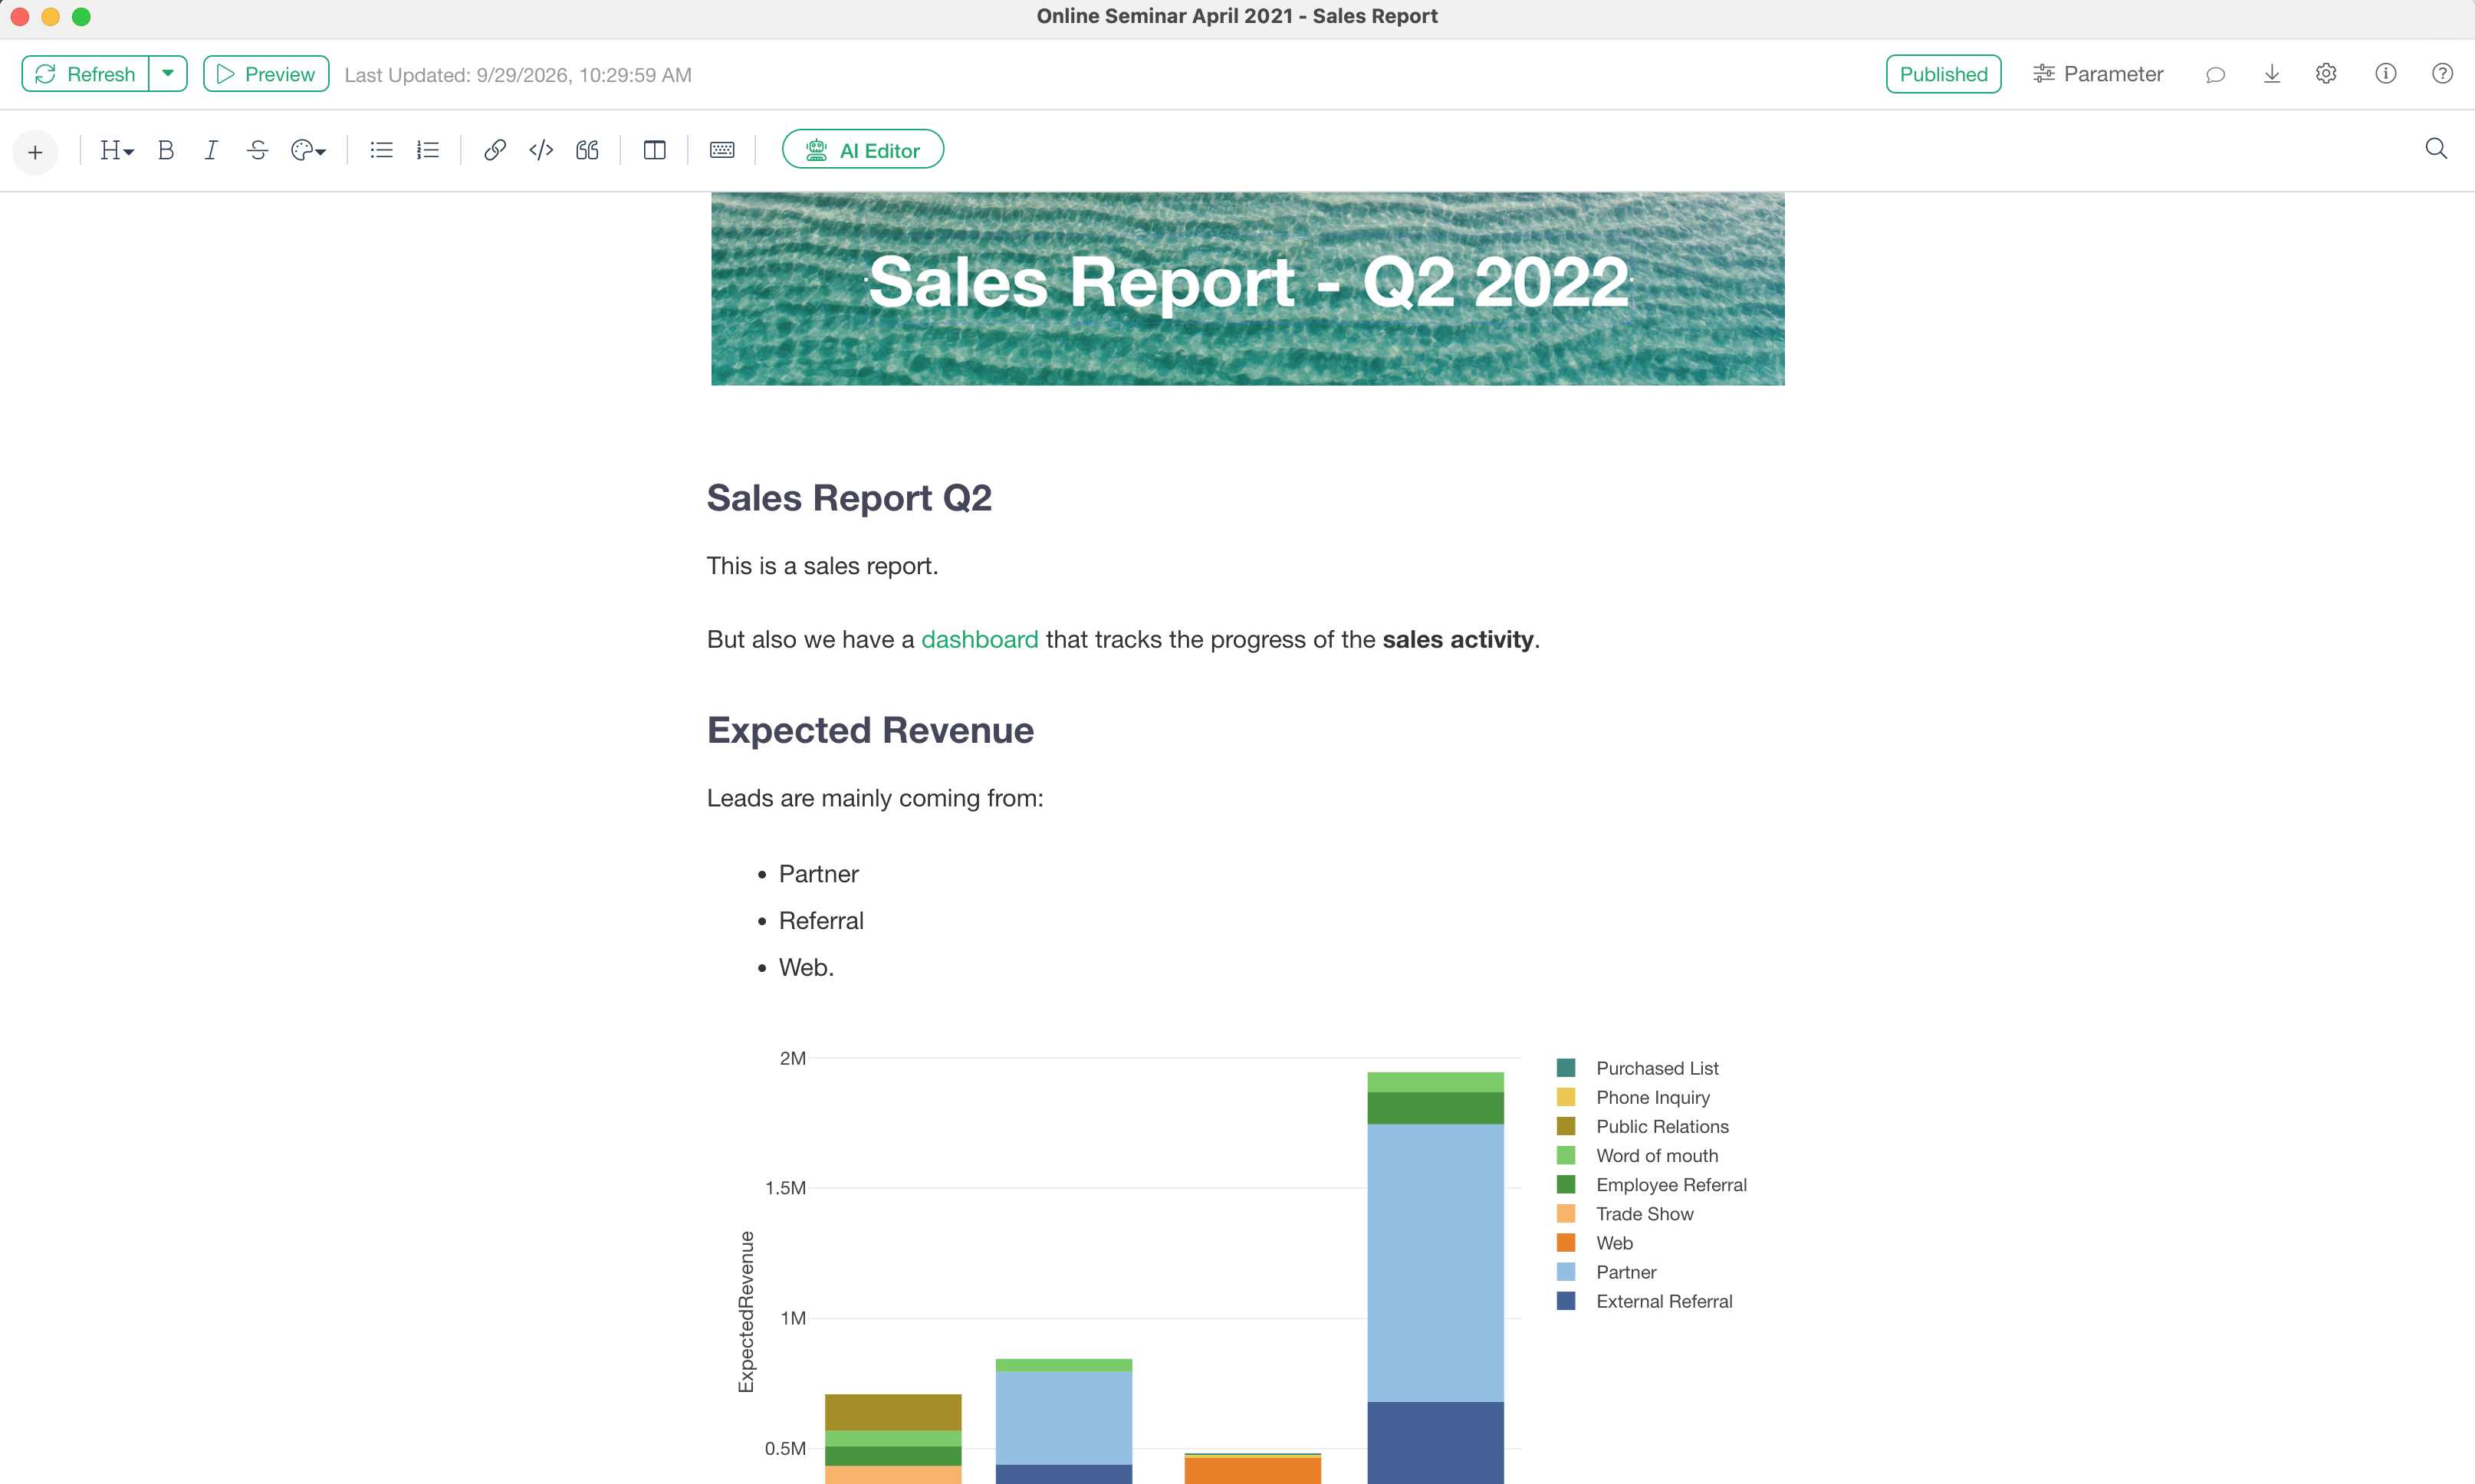
Build Reports
Combine charts, tables, and text into a report written as a Note, and share it with others.
When the data changes, rerun the same workflow from analysis to report to bring everything up to date.
Monitor with Dashboards
Keep an eye on key business metrics and changes in your data with dashboards.
Schedule your data and analysis to refresh automatically, and get the latest results by email on a regular basis.
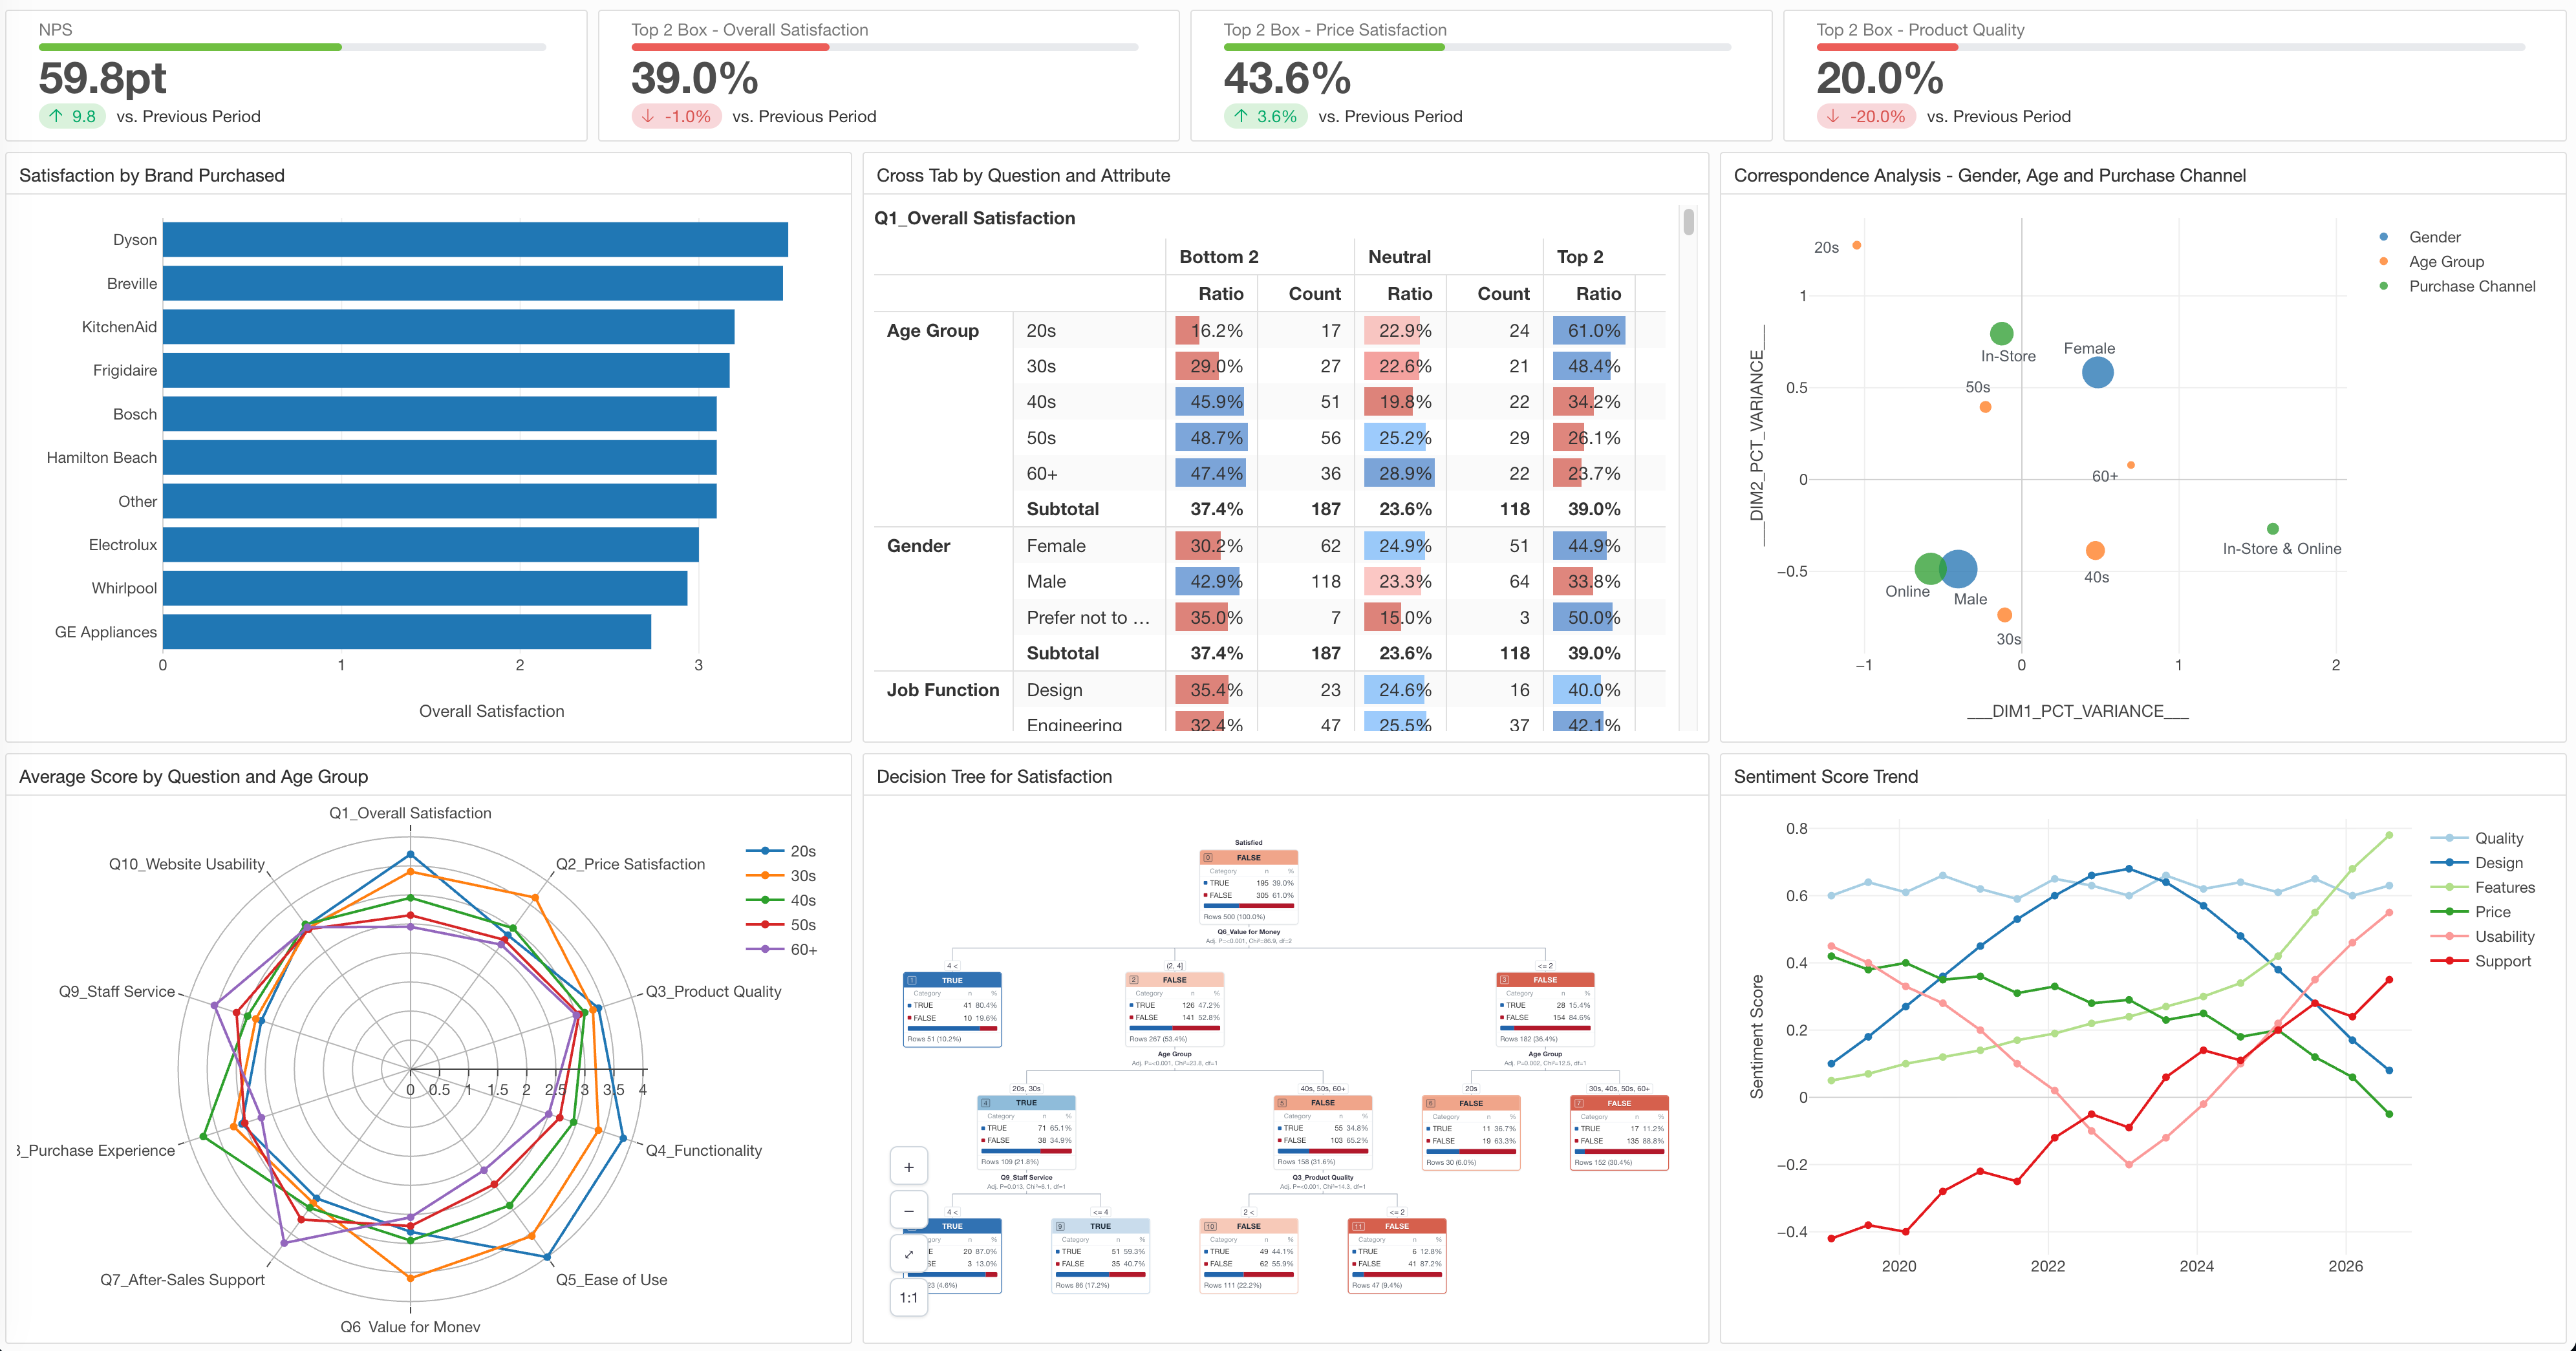
Move fast with AI. Stay in control with workflows. Go deeper with statistics.
AI has made data analysis faster than ever.
But the faster analysis gets, the more important that you can trace how a result was produced, find the root cause when something looks off, and reproduce the same analysis later.
Exploratory brings together the speed of AI, the control analysts need, and the depth of statistics and machine learning, all in a single analytics workflow.
Move fast with AI.
From getting and wrangling data to fixing errors, classifying text, summarizing results, and writing reports.
Put AI to work across your analytics workflow and speed up the tasks that used to take hours.
Explore AI features →Stay in control with workflows.
What did the AI actually do? Why does this number look wrong?
In Exploratory, every data wrangling and analysis step is kept as a workflow, so you can verify results, debug problems, and fix and rerun steps whenever you need to.
See the 3 Rs →Go deeper with statistics.
Spotting a difference in a table or chart is only the beginning.
Use statistical tests, regression, decision trees, factor analysis, clustering, and more to understand what a difference means, what’s driving it, and how your data is structured.
Put AI to work inside your analytics workflow.
AI in Exploratory does more than answer questions. It works inside your actual analysis process.
Get data. Wrangle it. Fix problems. Classify text. Make sense of the results. Write the report.
Exploratory’s AI helps you at every one of these stages.
And whatever the AI does is recorded as part of your workflow, so you can review it later and change it if you need to.
AI Data
Just describe what you need in plain language, and AI gets the right data for you from databases, APIs, cloud services, file systems, and more.
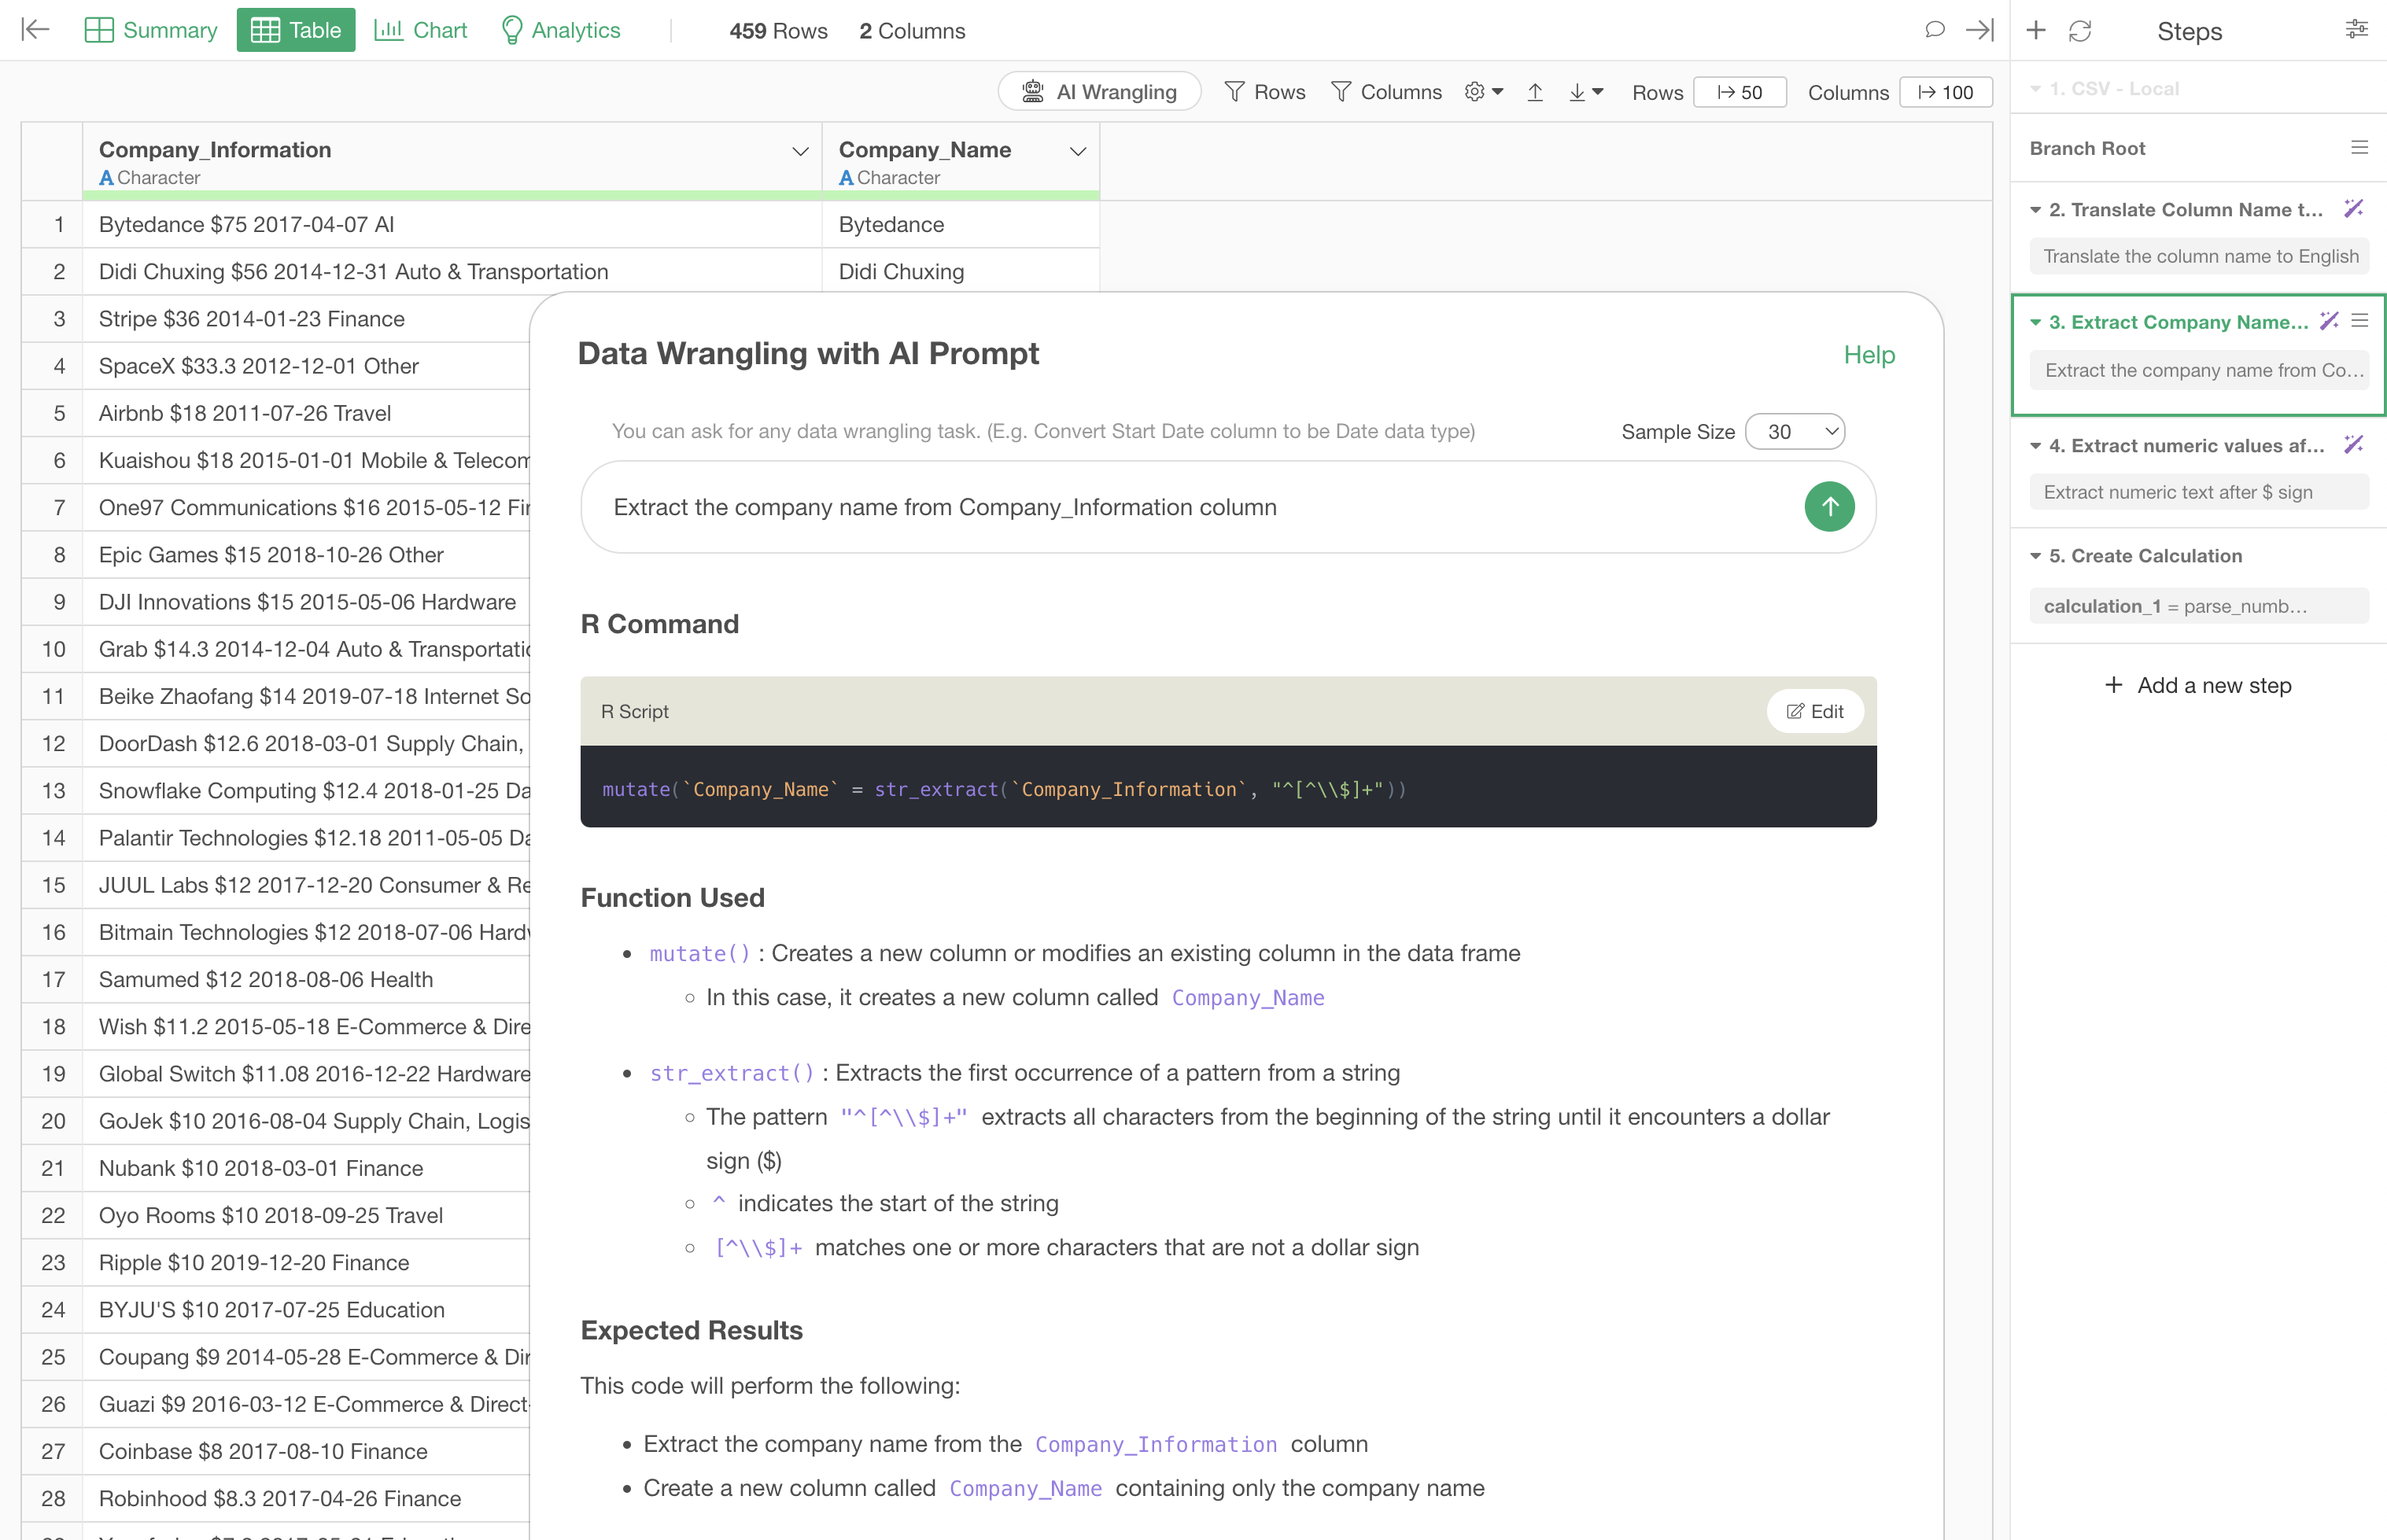
AI Data Wrangling
Type an instruction like “create a year-month column from the date” or “group rows into categories based on these conditions,” and AI builds the data wrangling steps for you.
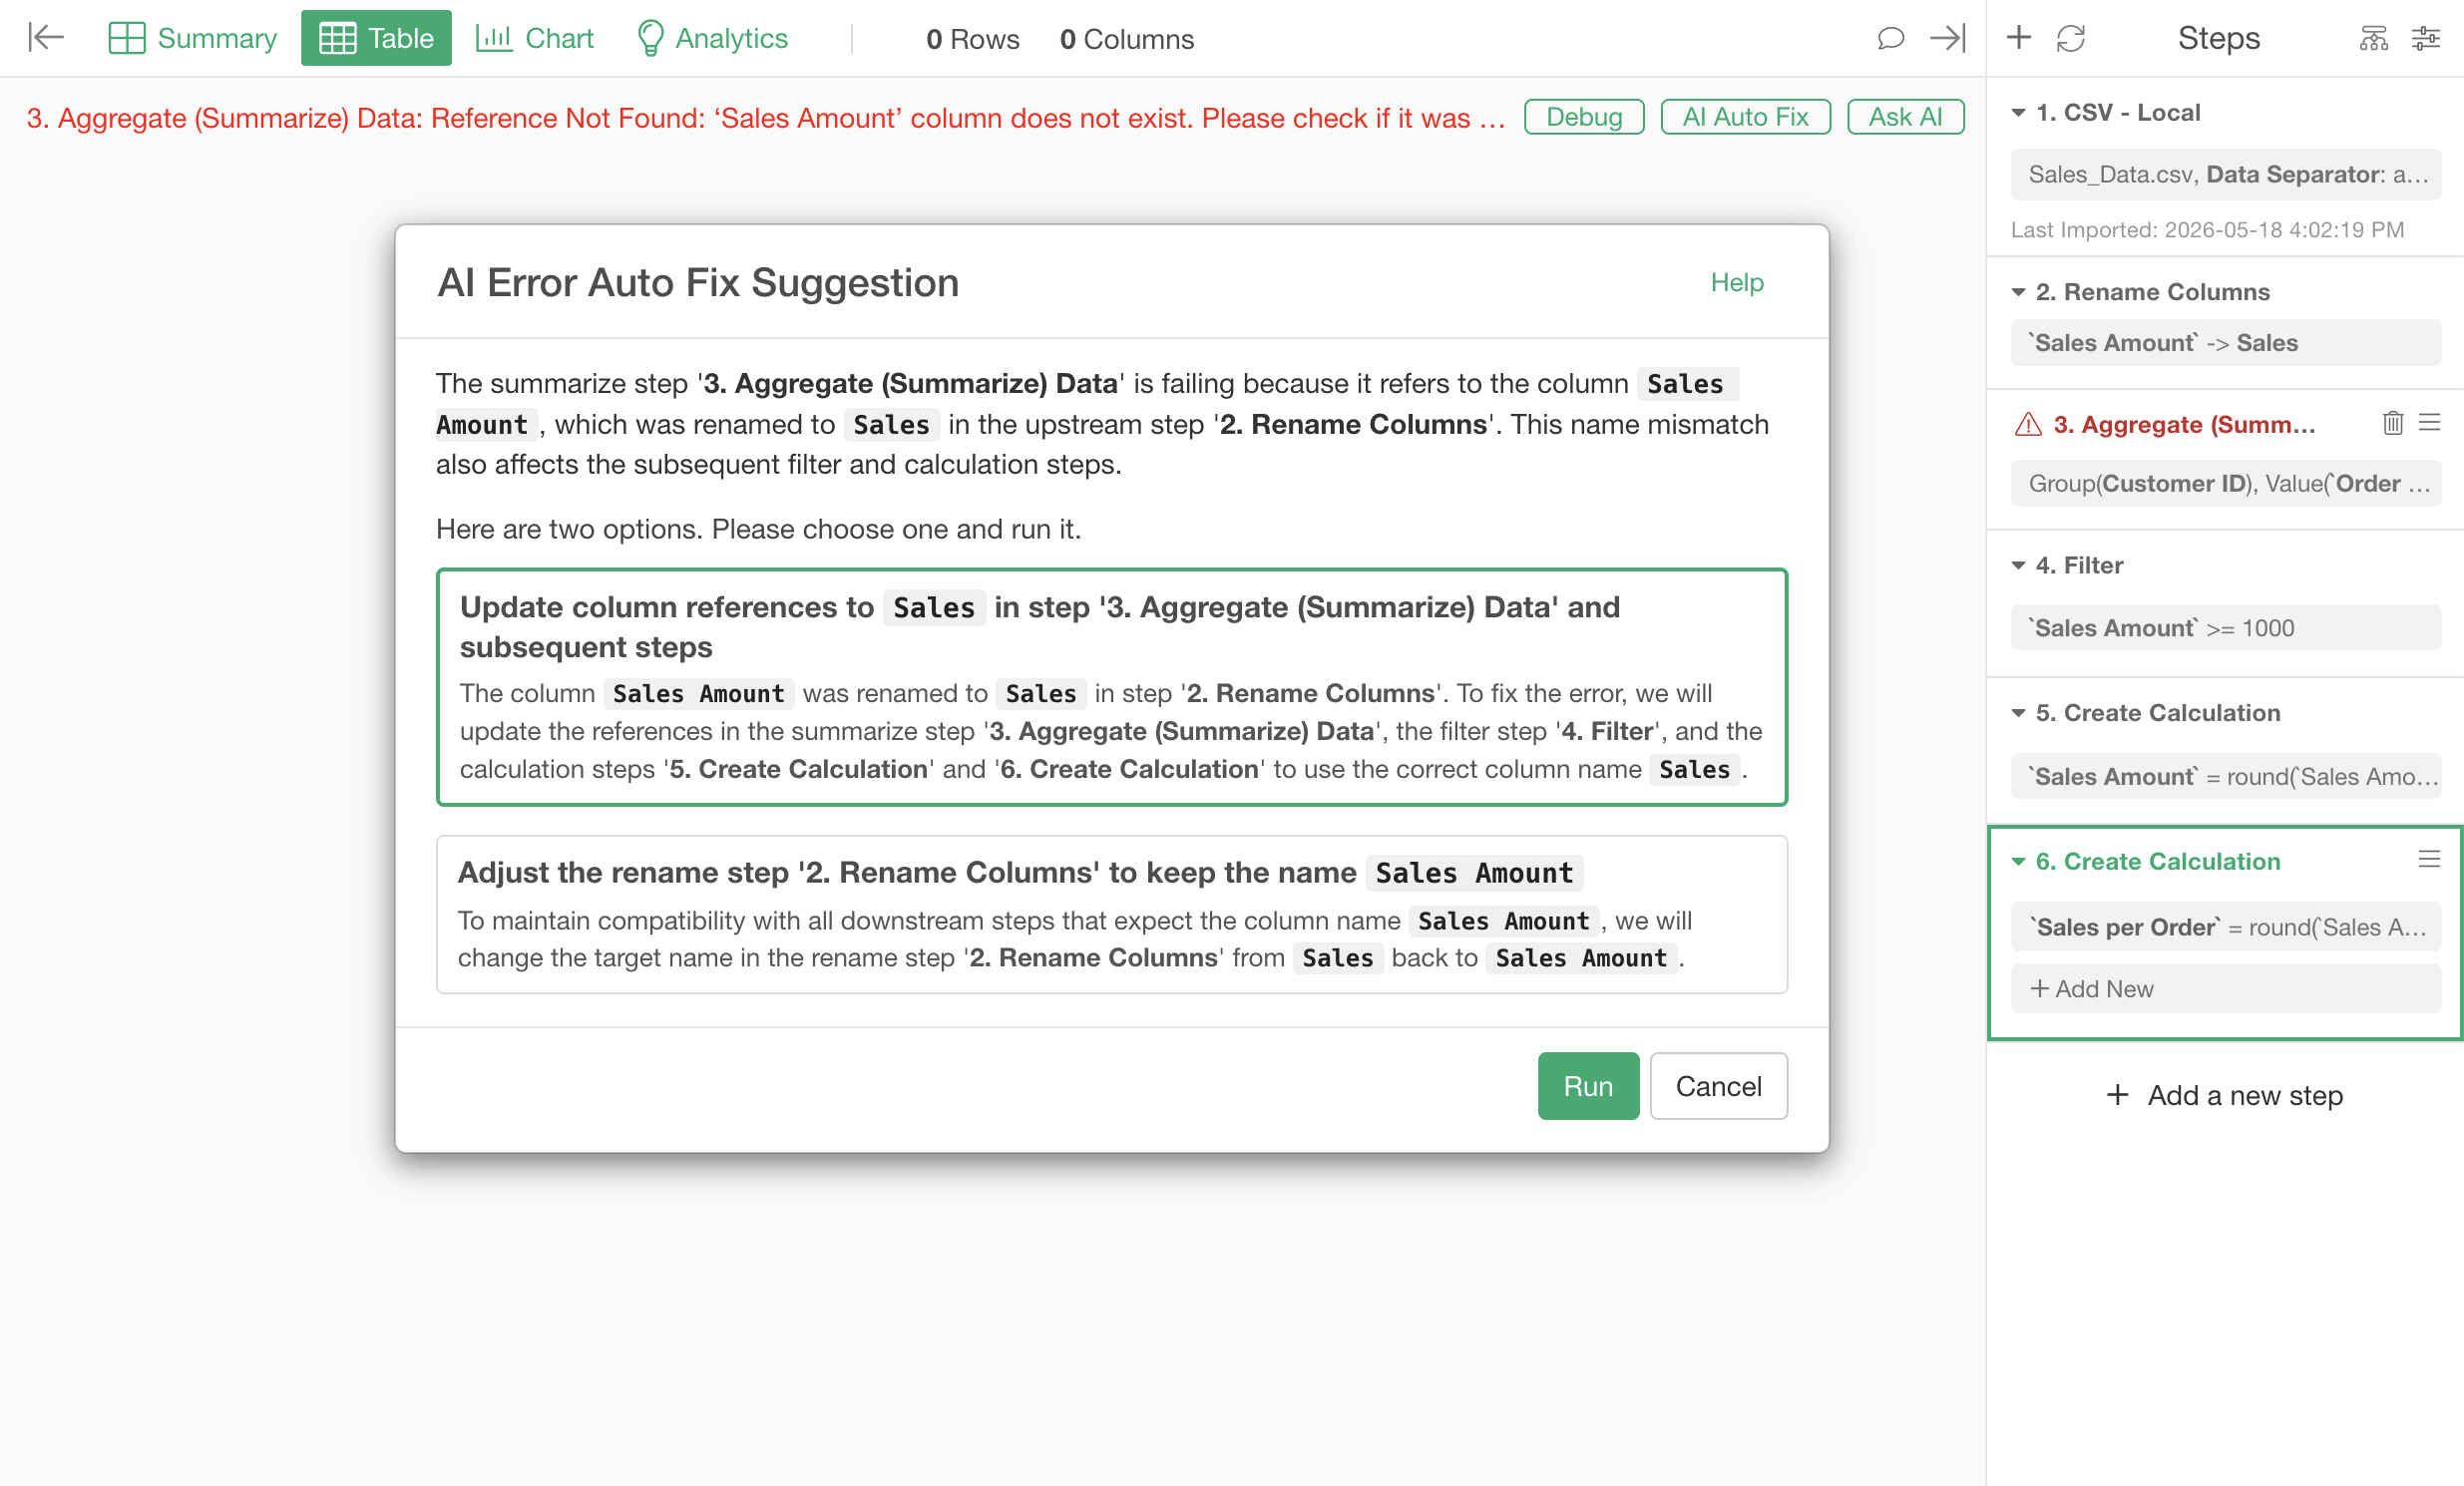
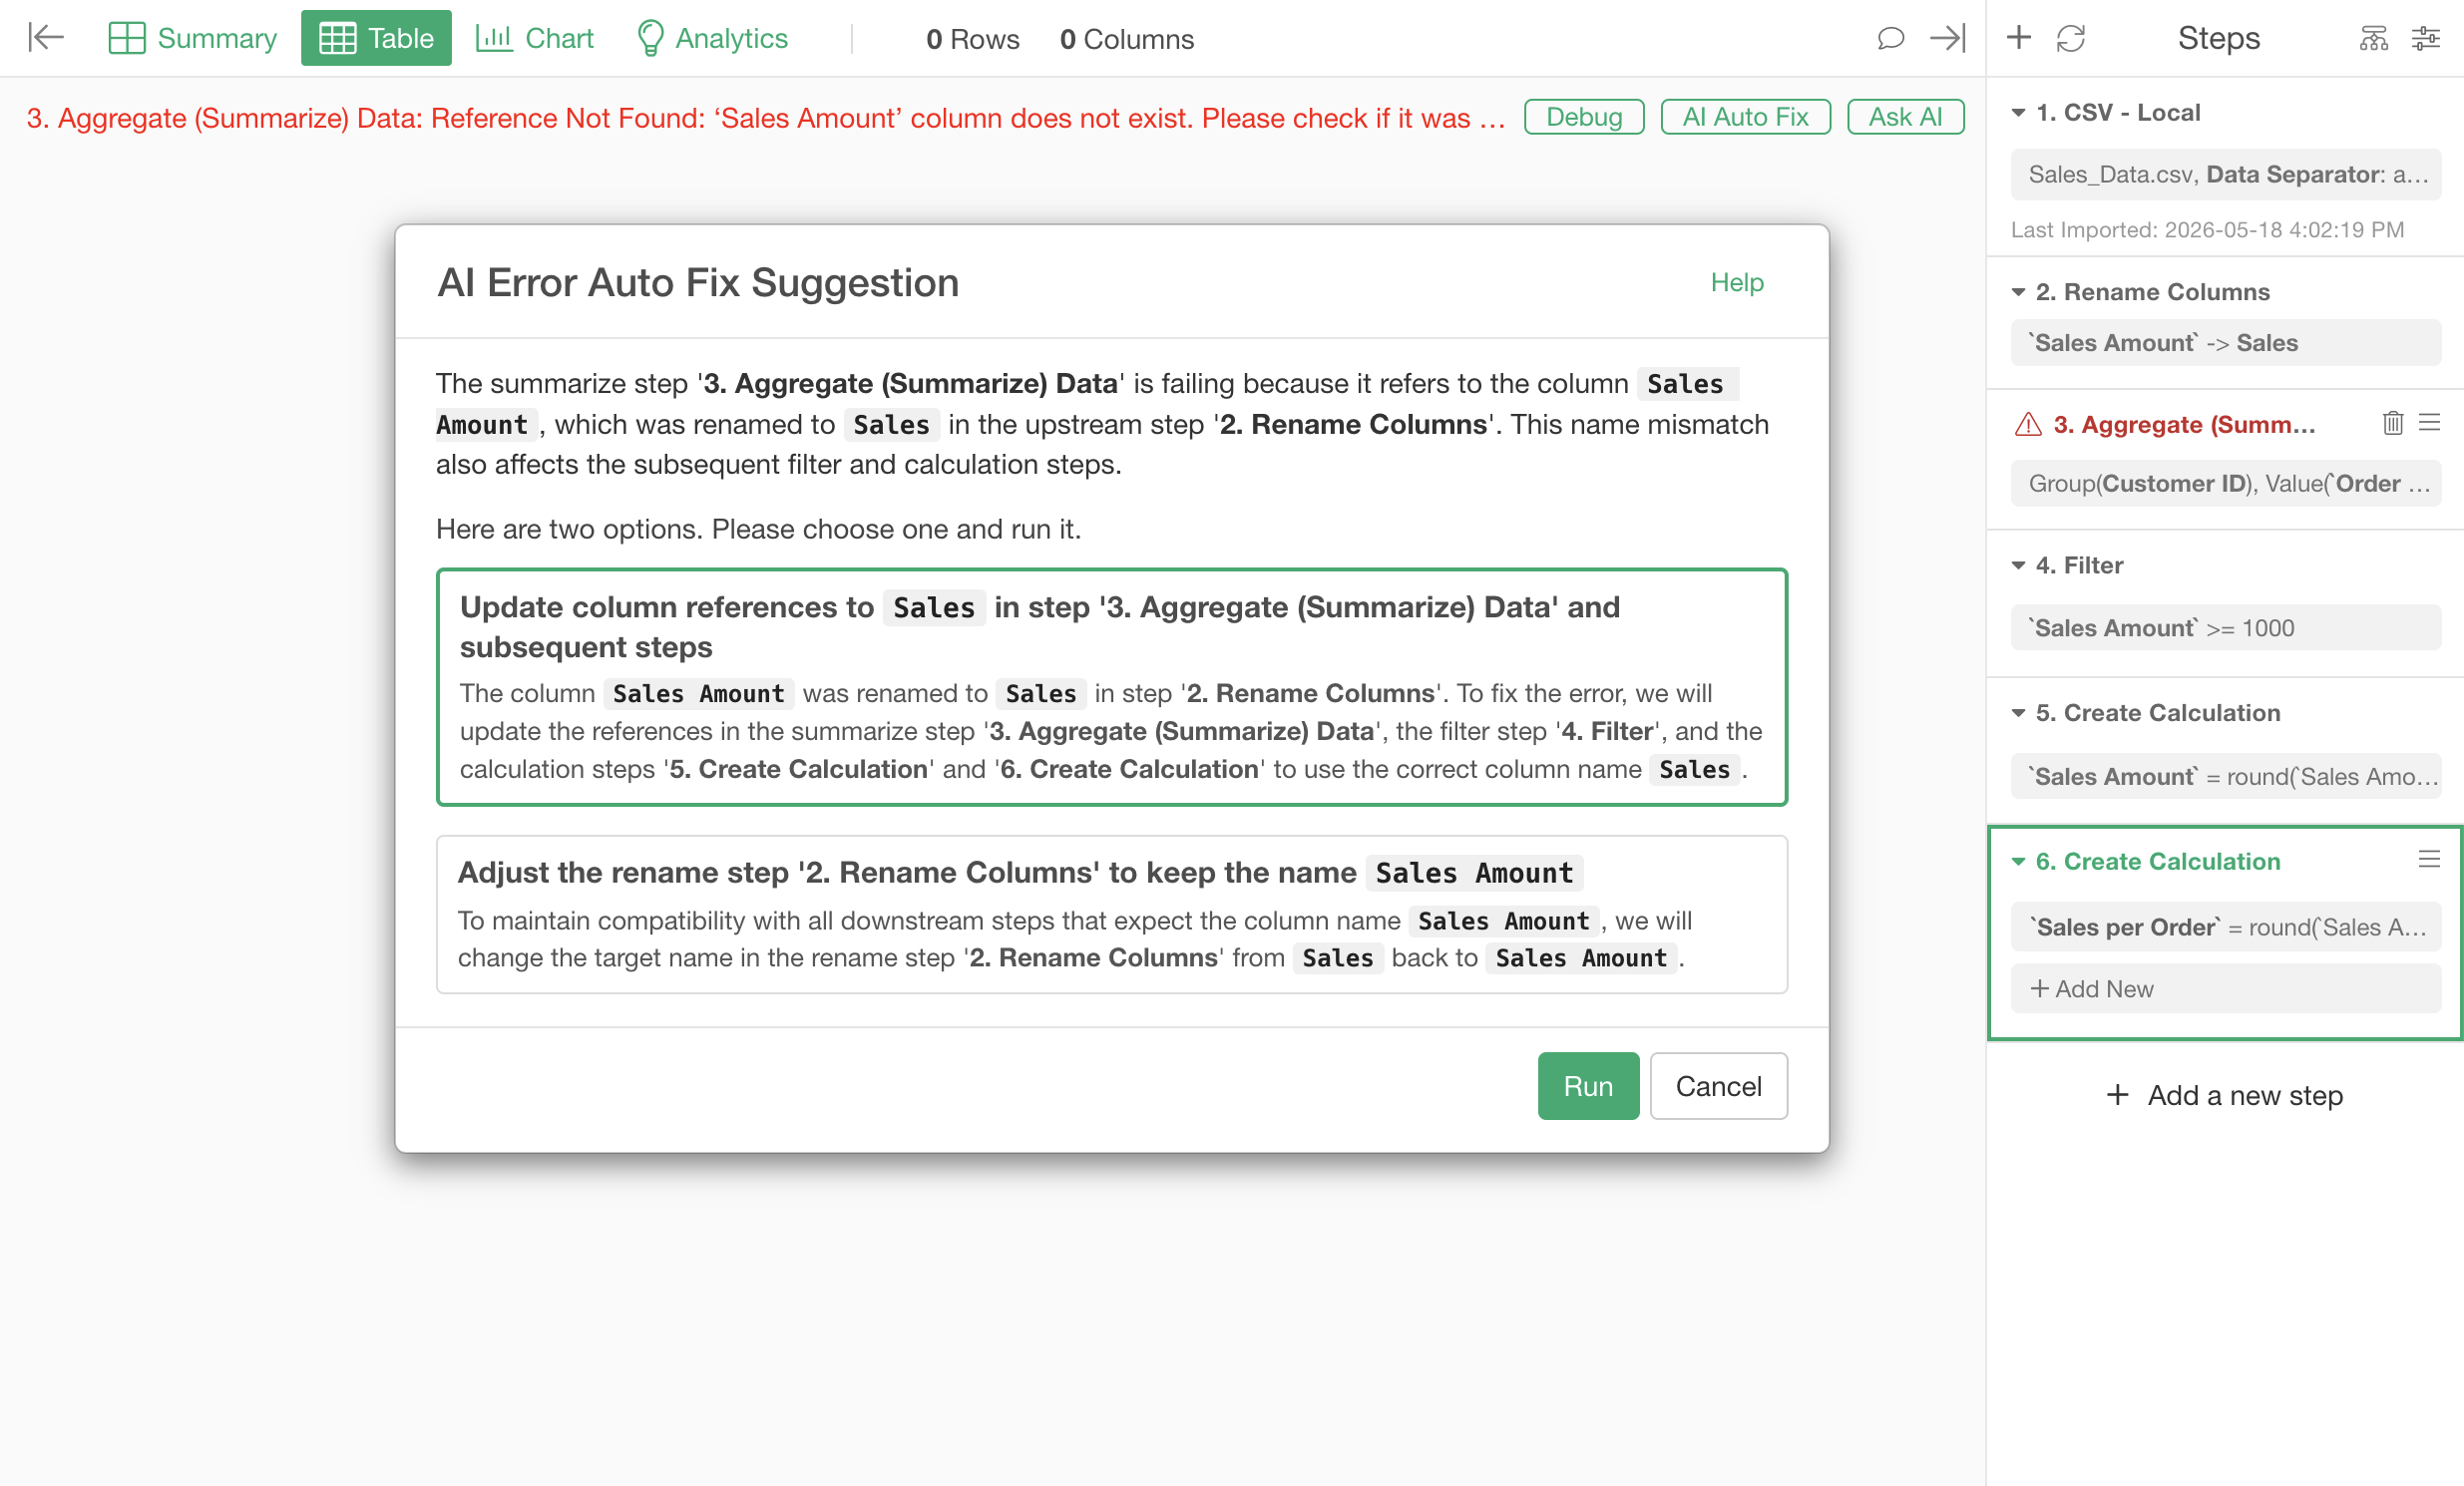
AI Auto-Fix
When an error comes up while you wrangle data, AI works out the cause, suggests how to fix it, and applies the fix for you.
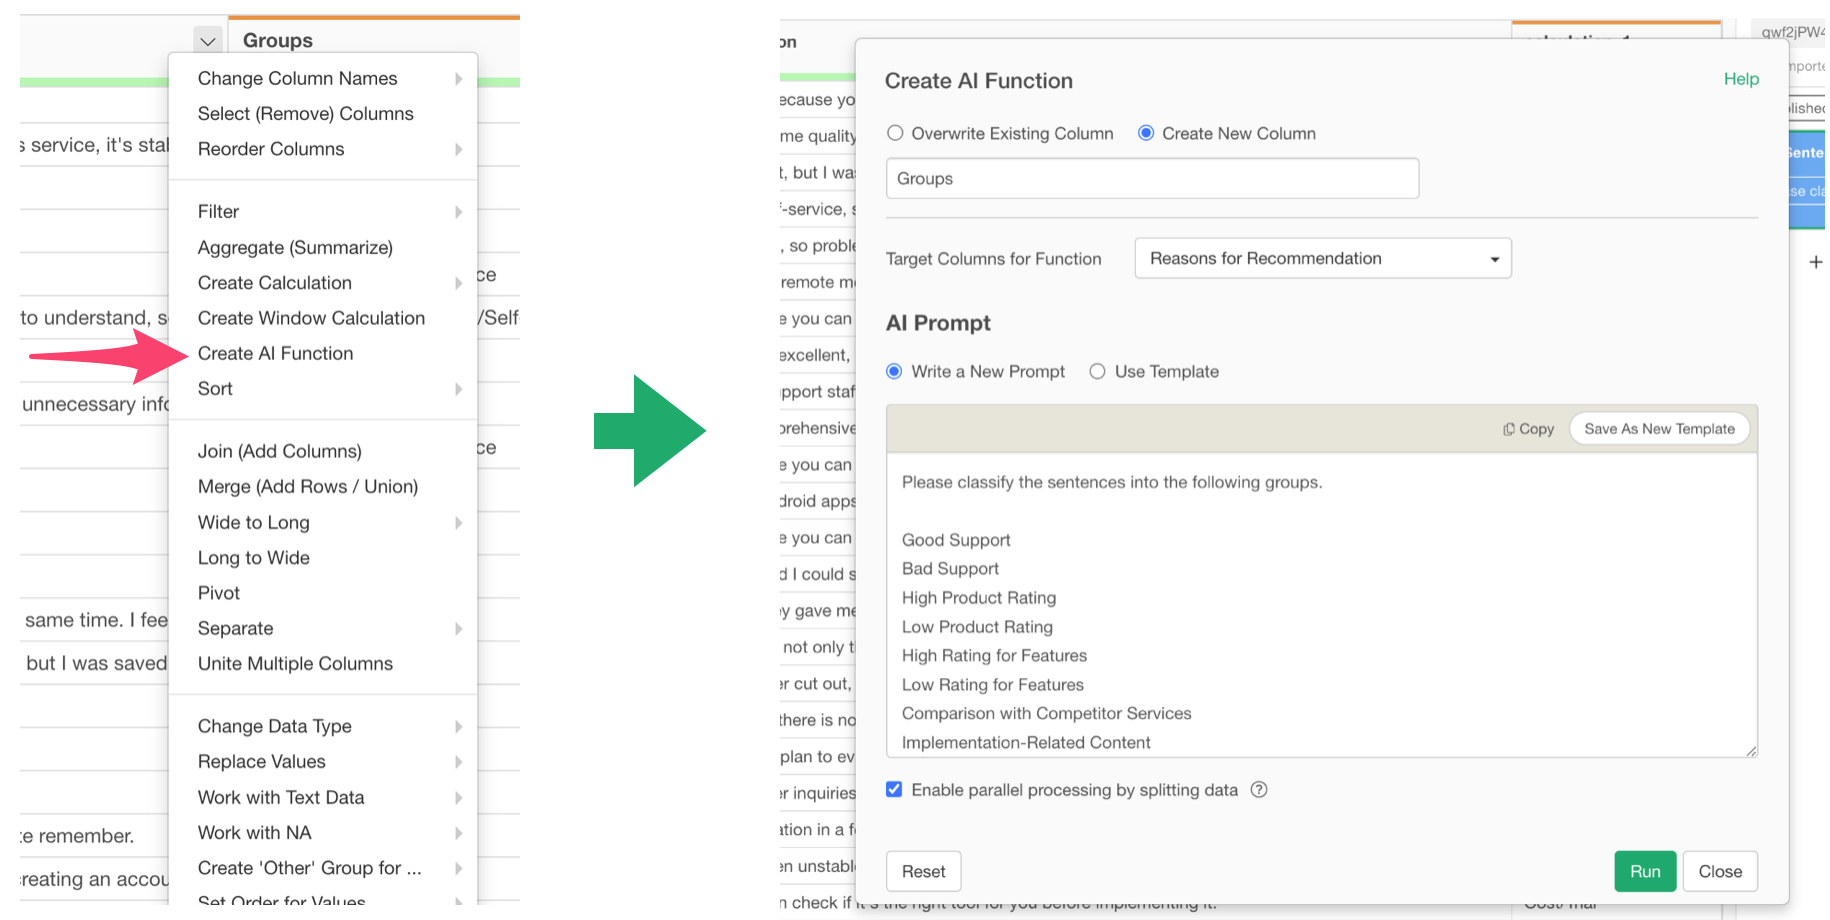
AI Functions
Use AI to classify, summarize, and extract information from text: the kind of work that’s hard to do with rules alone.
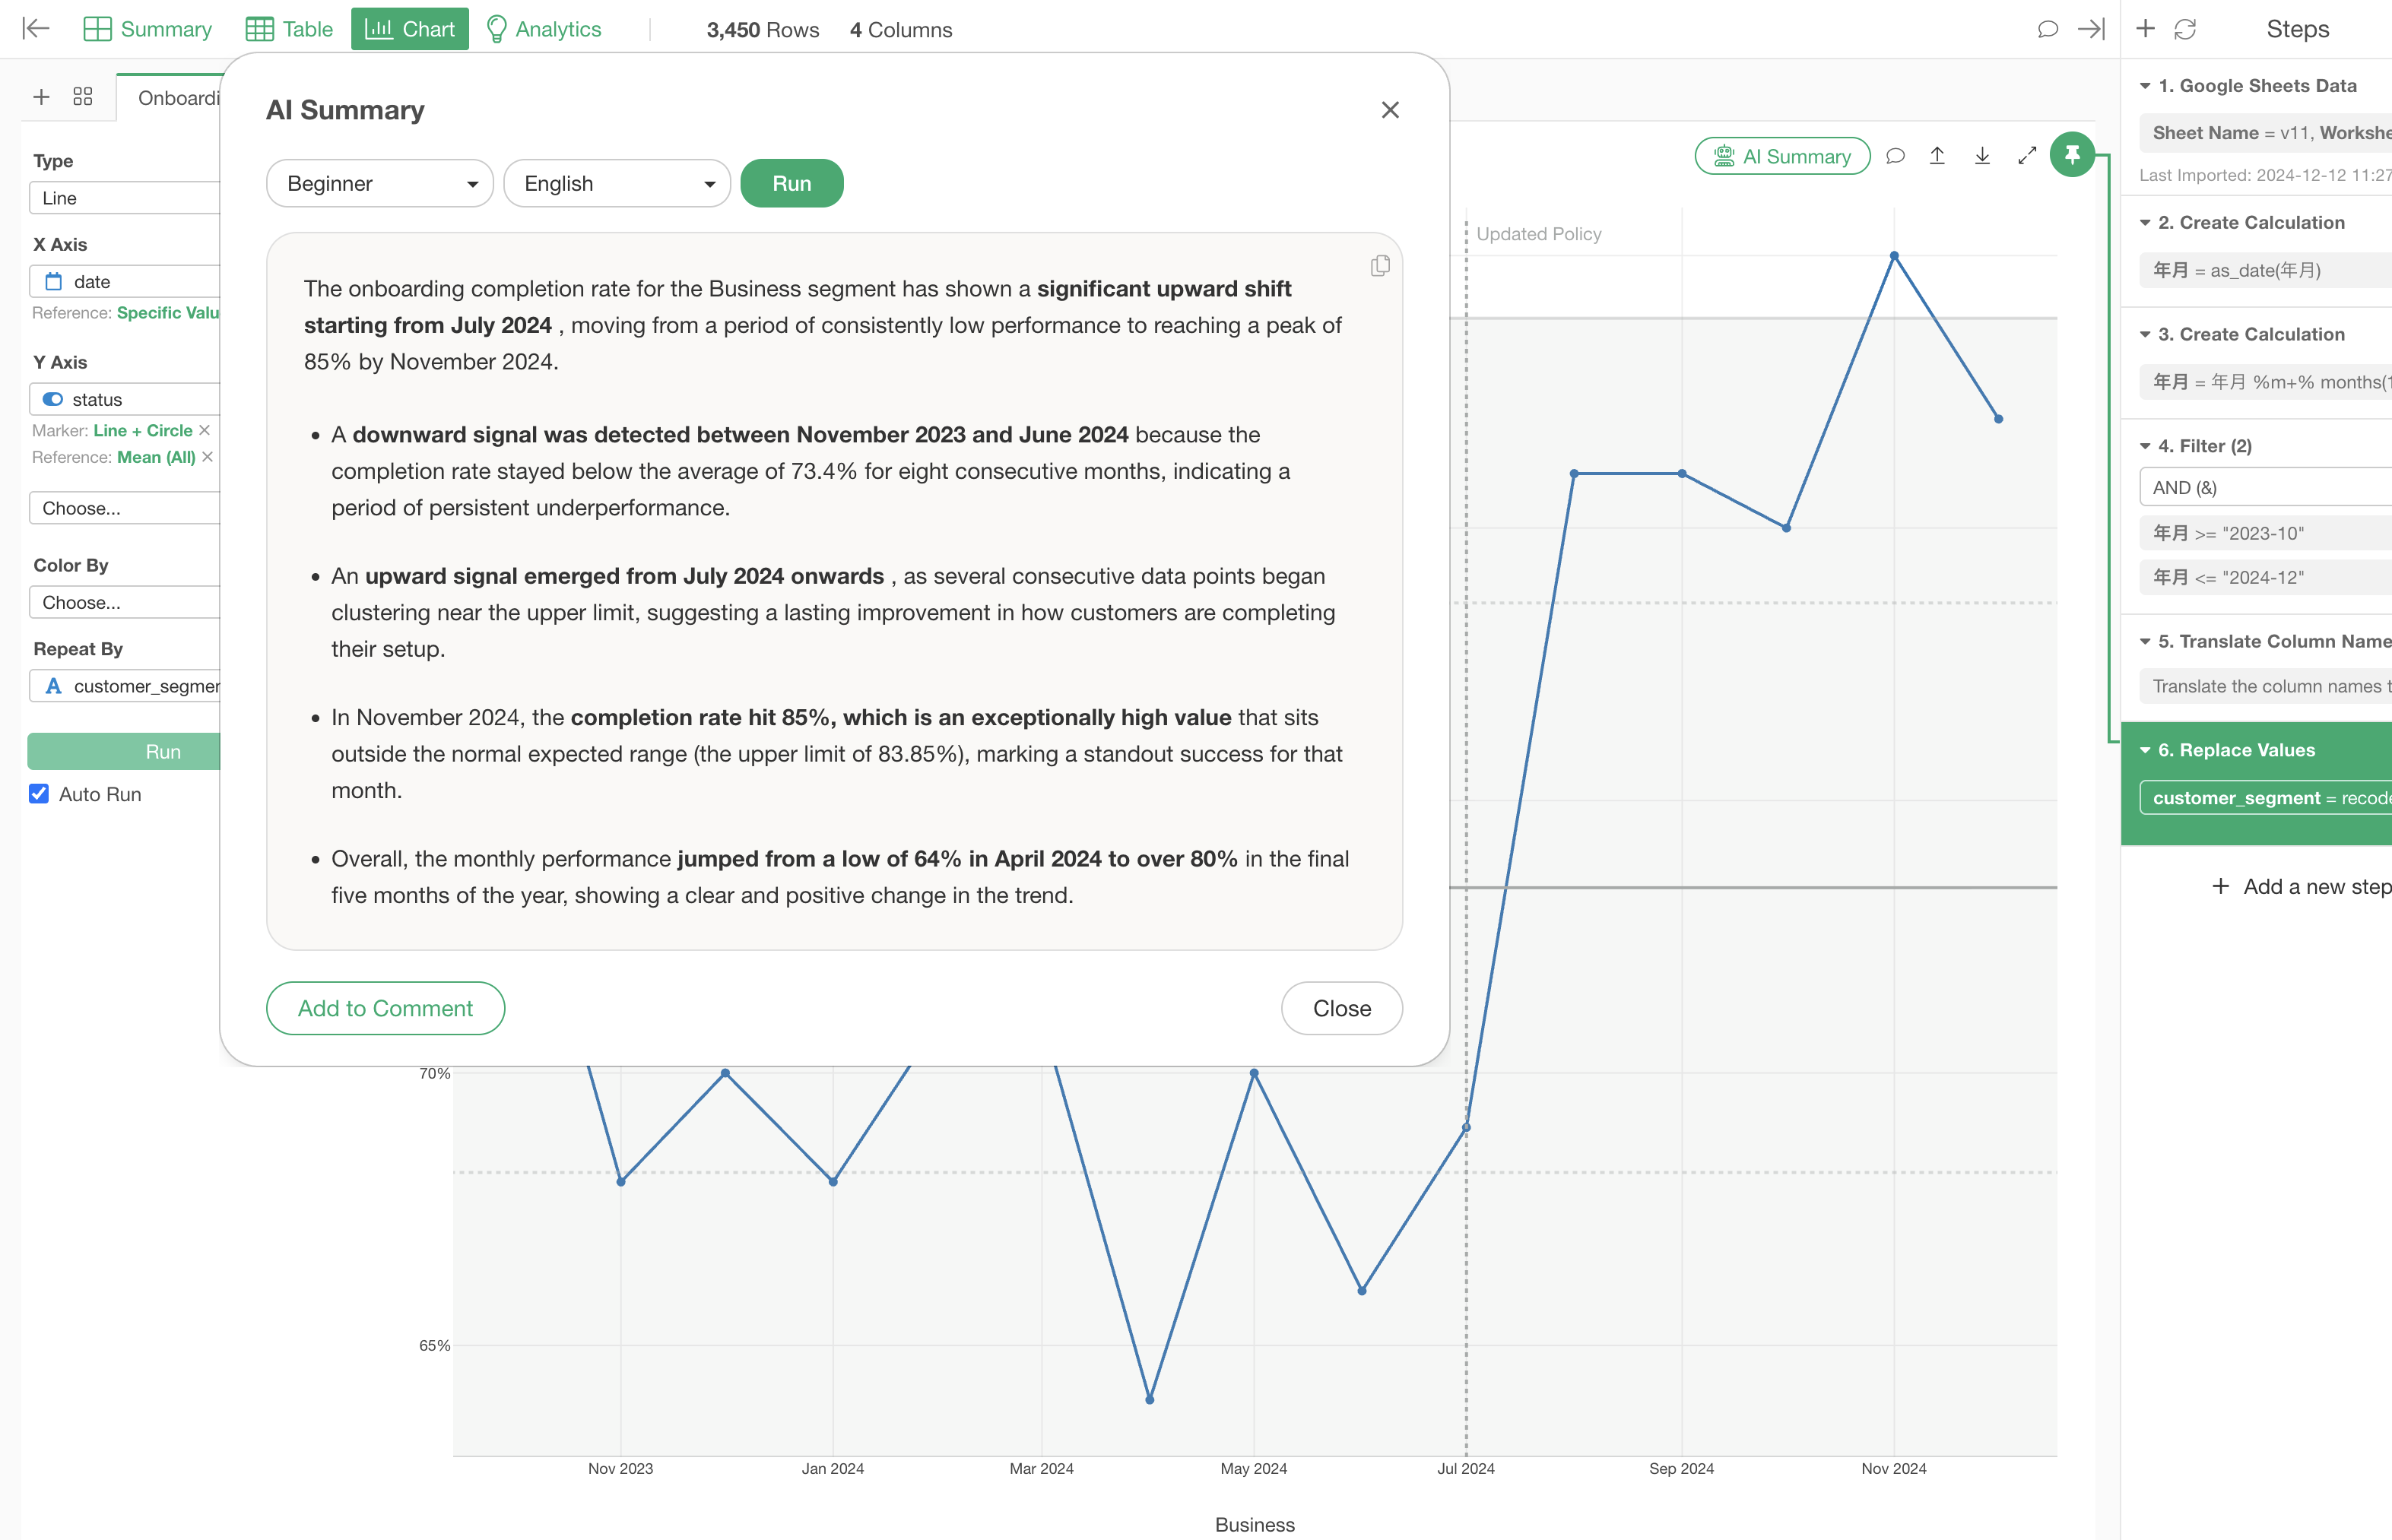
AI Summary
AI reads your charts and statistical results and sums up the key trends and takeaways in plain language, so you can understand the results and see where to dig next.
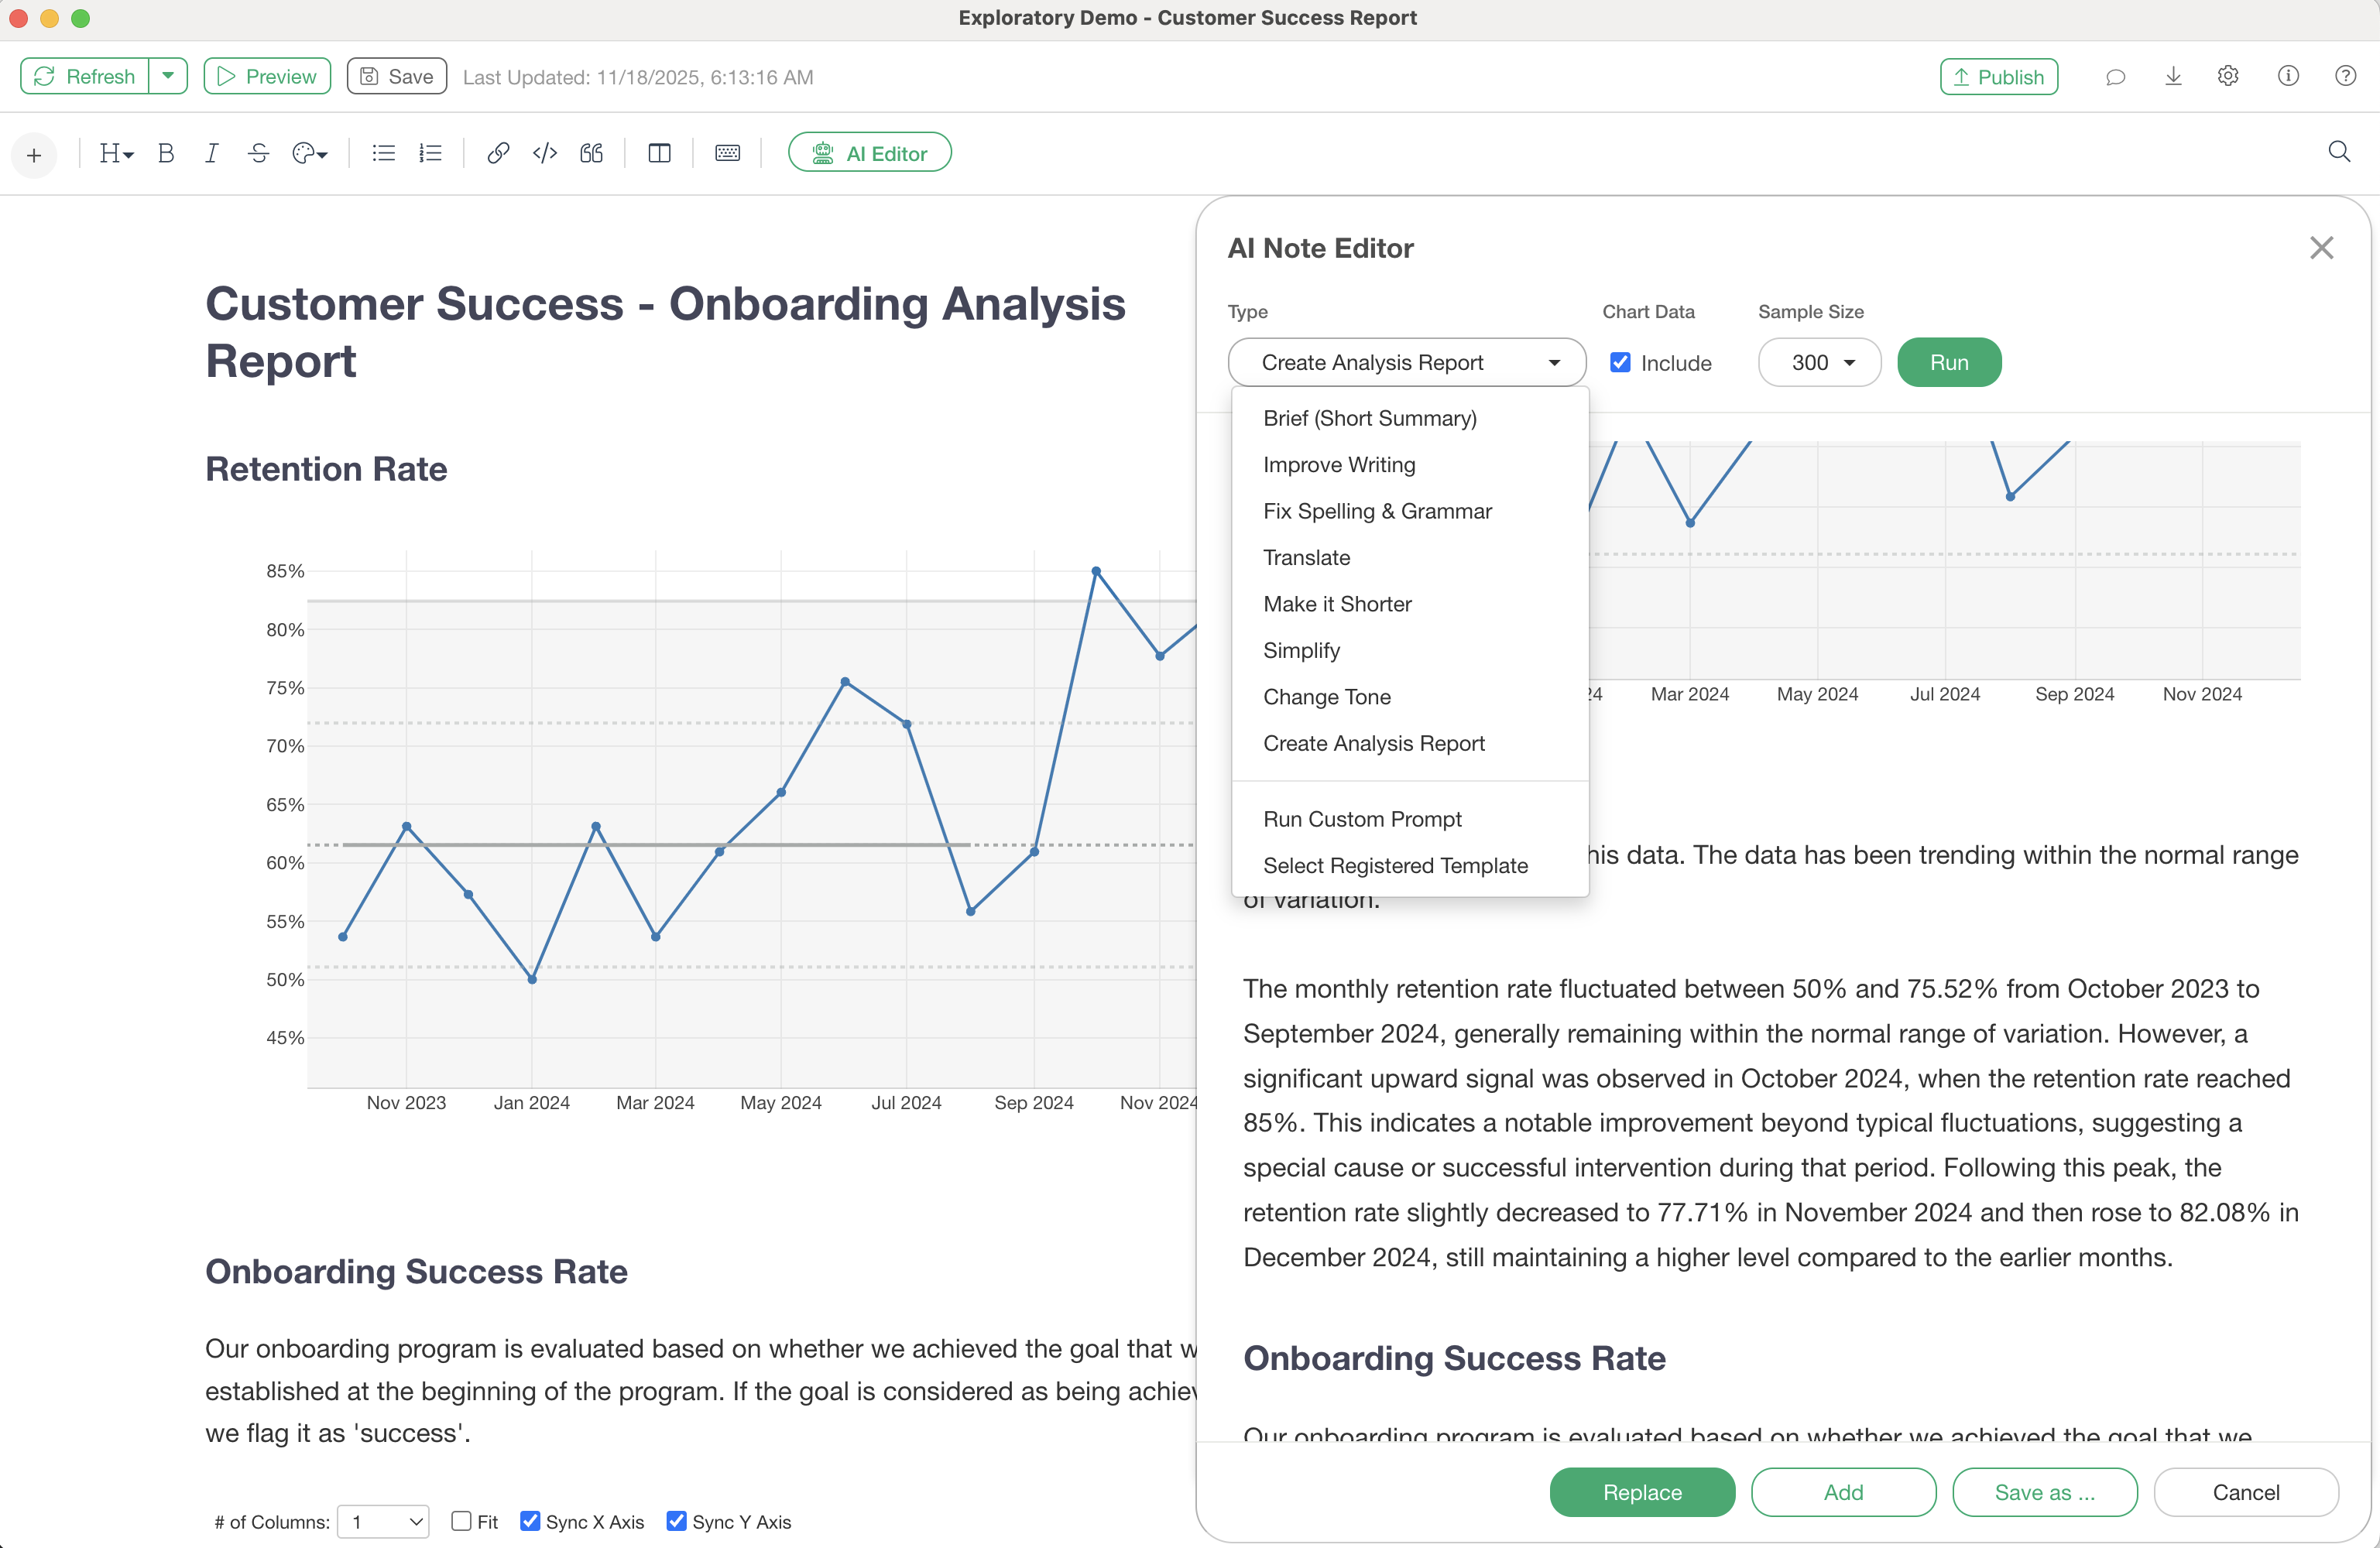
AI Note Editor
AI drafts a report from the charts and analysis you’ve created. Beyond writing, summarizing, and interpreting results, it turns your analysis into one coherent story.
The 3 Rs of trustworthy data analysis
AI has made it easy to produce charts and reports.
But if there’s a problem in the source data or somewhere along the way, even the most polished output isn’t something you can base a decision on.
“Can I actually trust this result?”
To answer that question, Exploratory keeps the analysis process itself: readable, reproducible, and reliable over time.
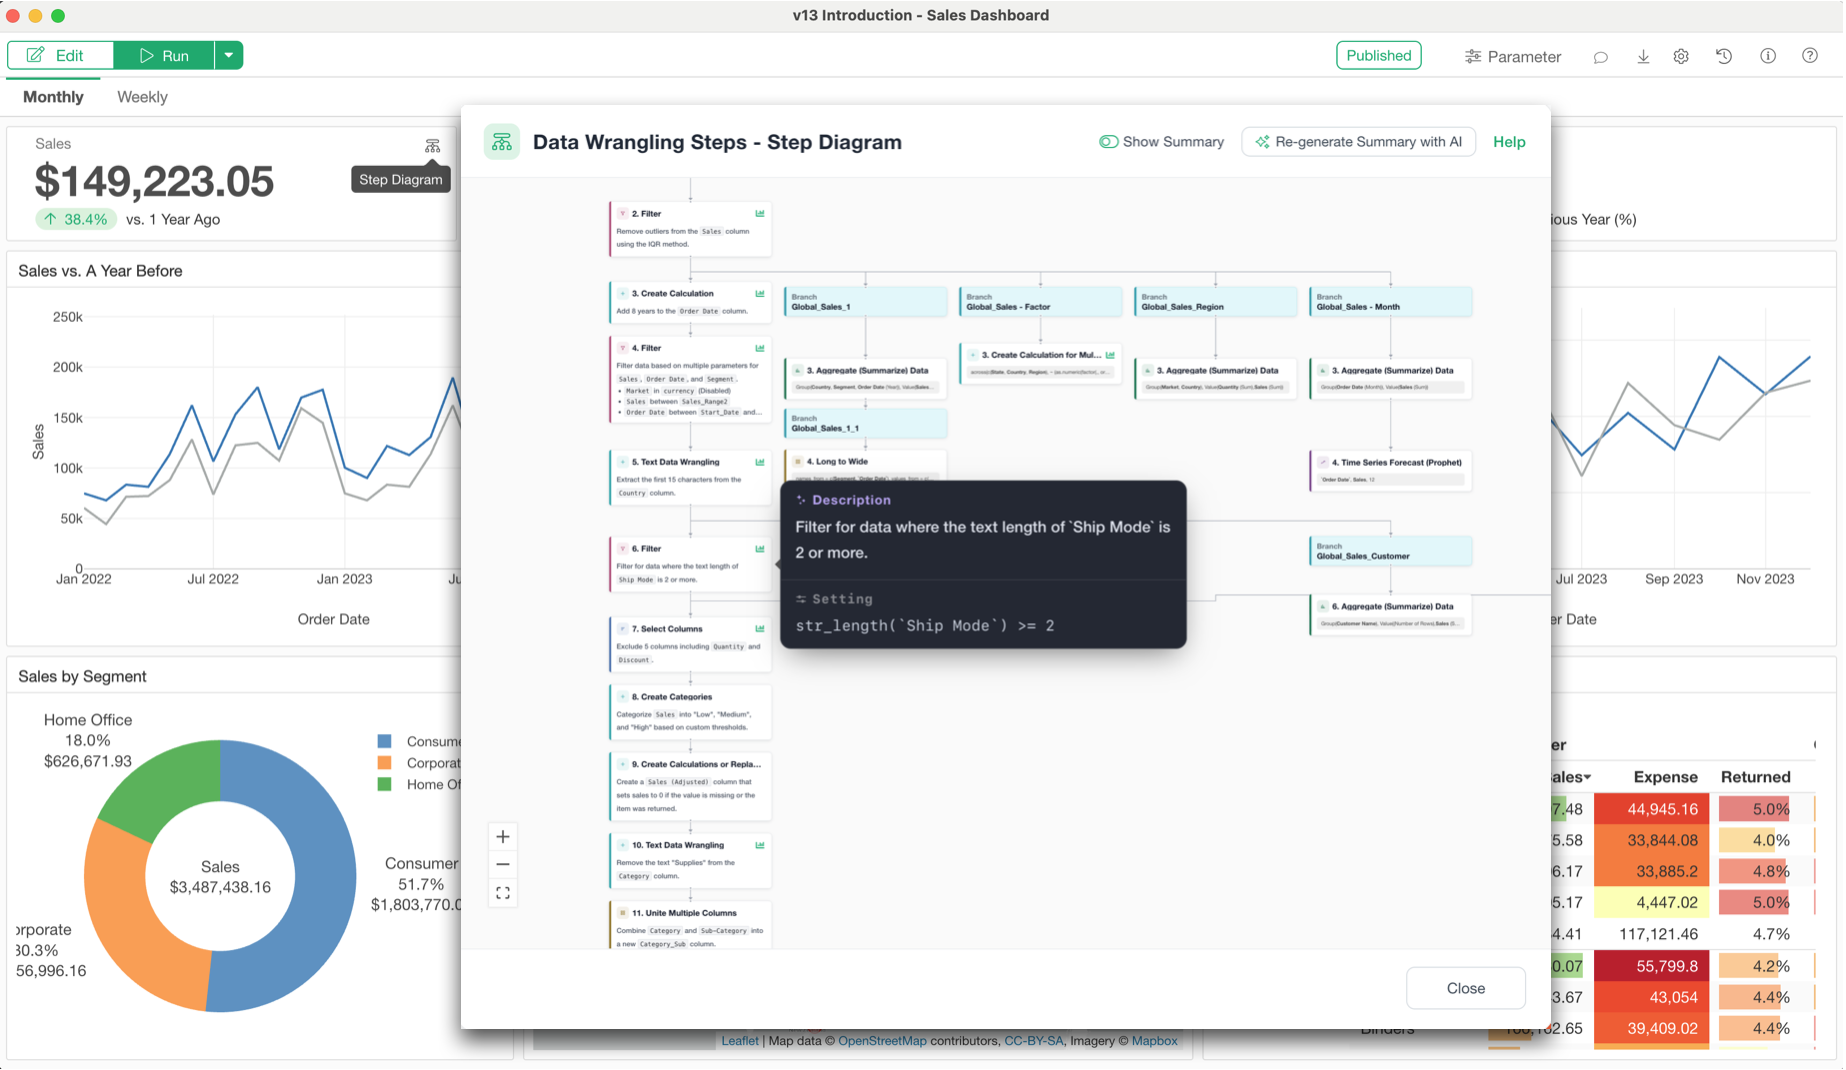
Readability
See exactly how your data was prepared.
Which data was used, and how was it transformed and calculated? You can trace how every number in your charts and reports was produced.
- Step Diagram
- AI Step Summaries
- Data Wrangling Documentation
Reproducibility
Rerun the same analysis, any time.
Every data wrangling step is recorded, so updating a monthly report or running the same analysis on new data is just a matter of rerunning the workflow.
- Recorded data wrangling steps
- Rerun on new data
- Reuse past analyses
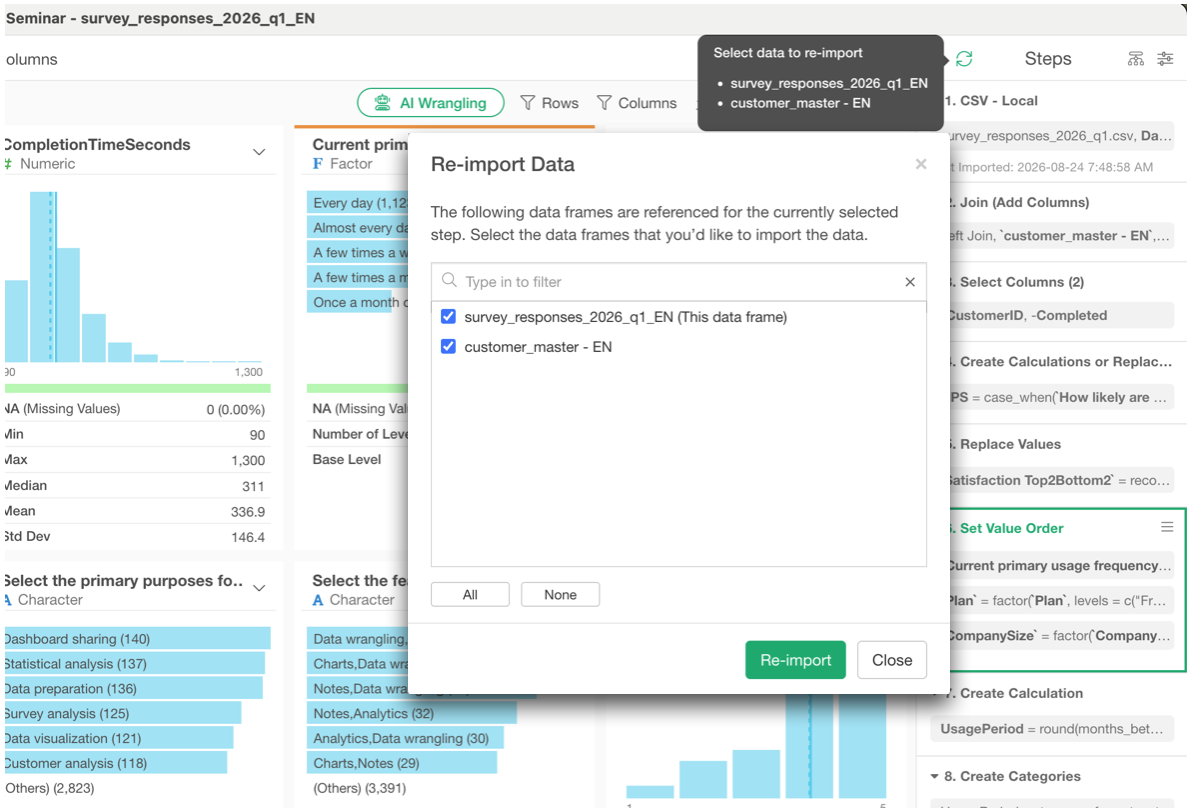
Reliability
Keep your workflows working as your data changes.
A column is renamed, a data type changes, etc., at some points the existing data wrangling can break. In Exploratory, AI checks it against the steps before and after, finds the cause, and suggests a fix that keeps your analysis intact.
- AI Auto-Fix
- Restore from history
Don’t stop at summaries. Understand what’s behind your data.
When you find a difference or a correlation, the next questions are:
Is it big enough to pay attention? Why is it happening? And what structure lies underneath?
In Exploratory, you can go straight from summaries and charts to analysis with statistical methods and machine learning.
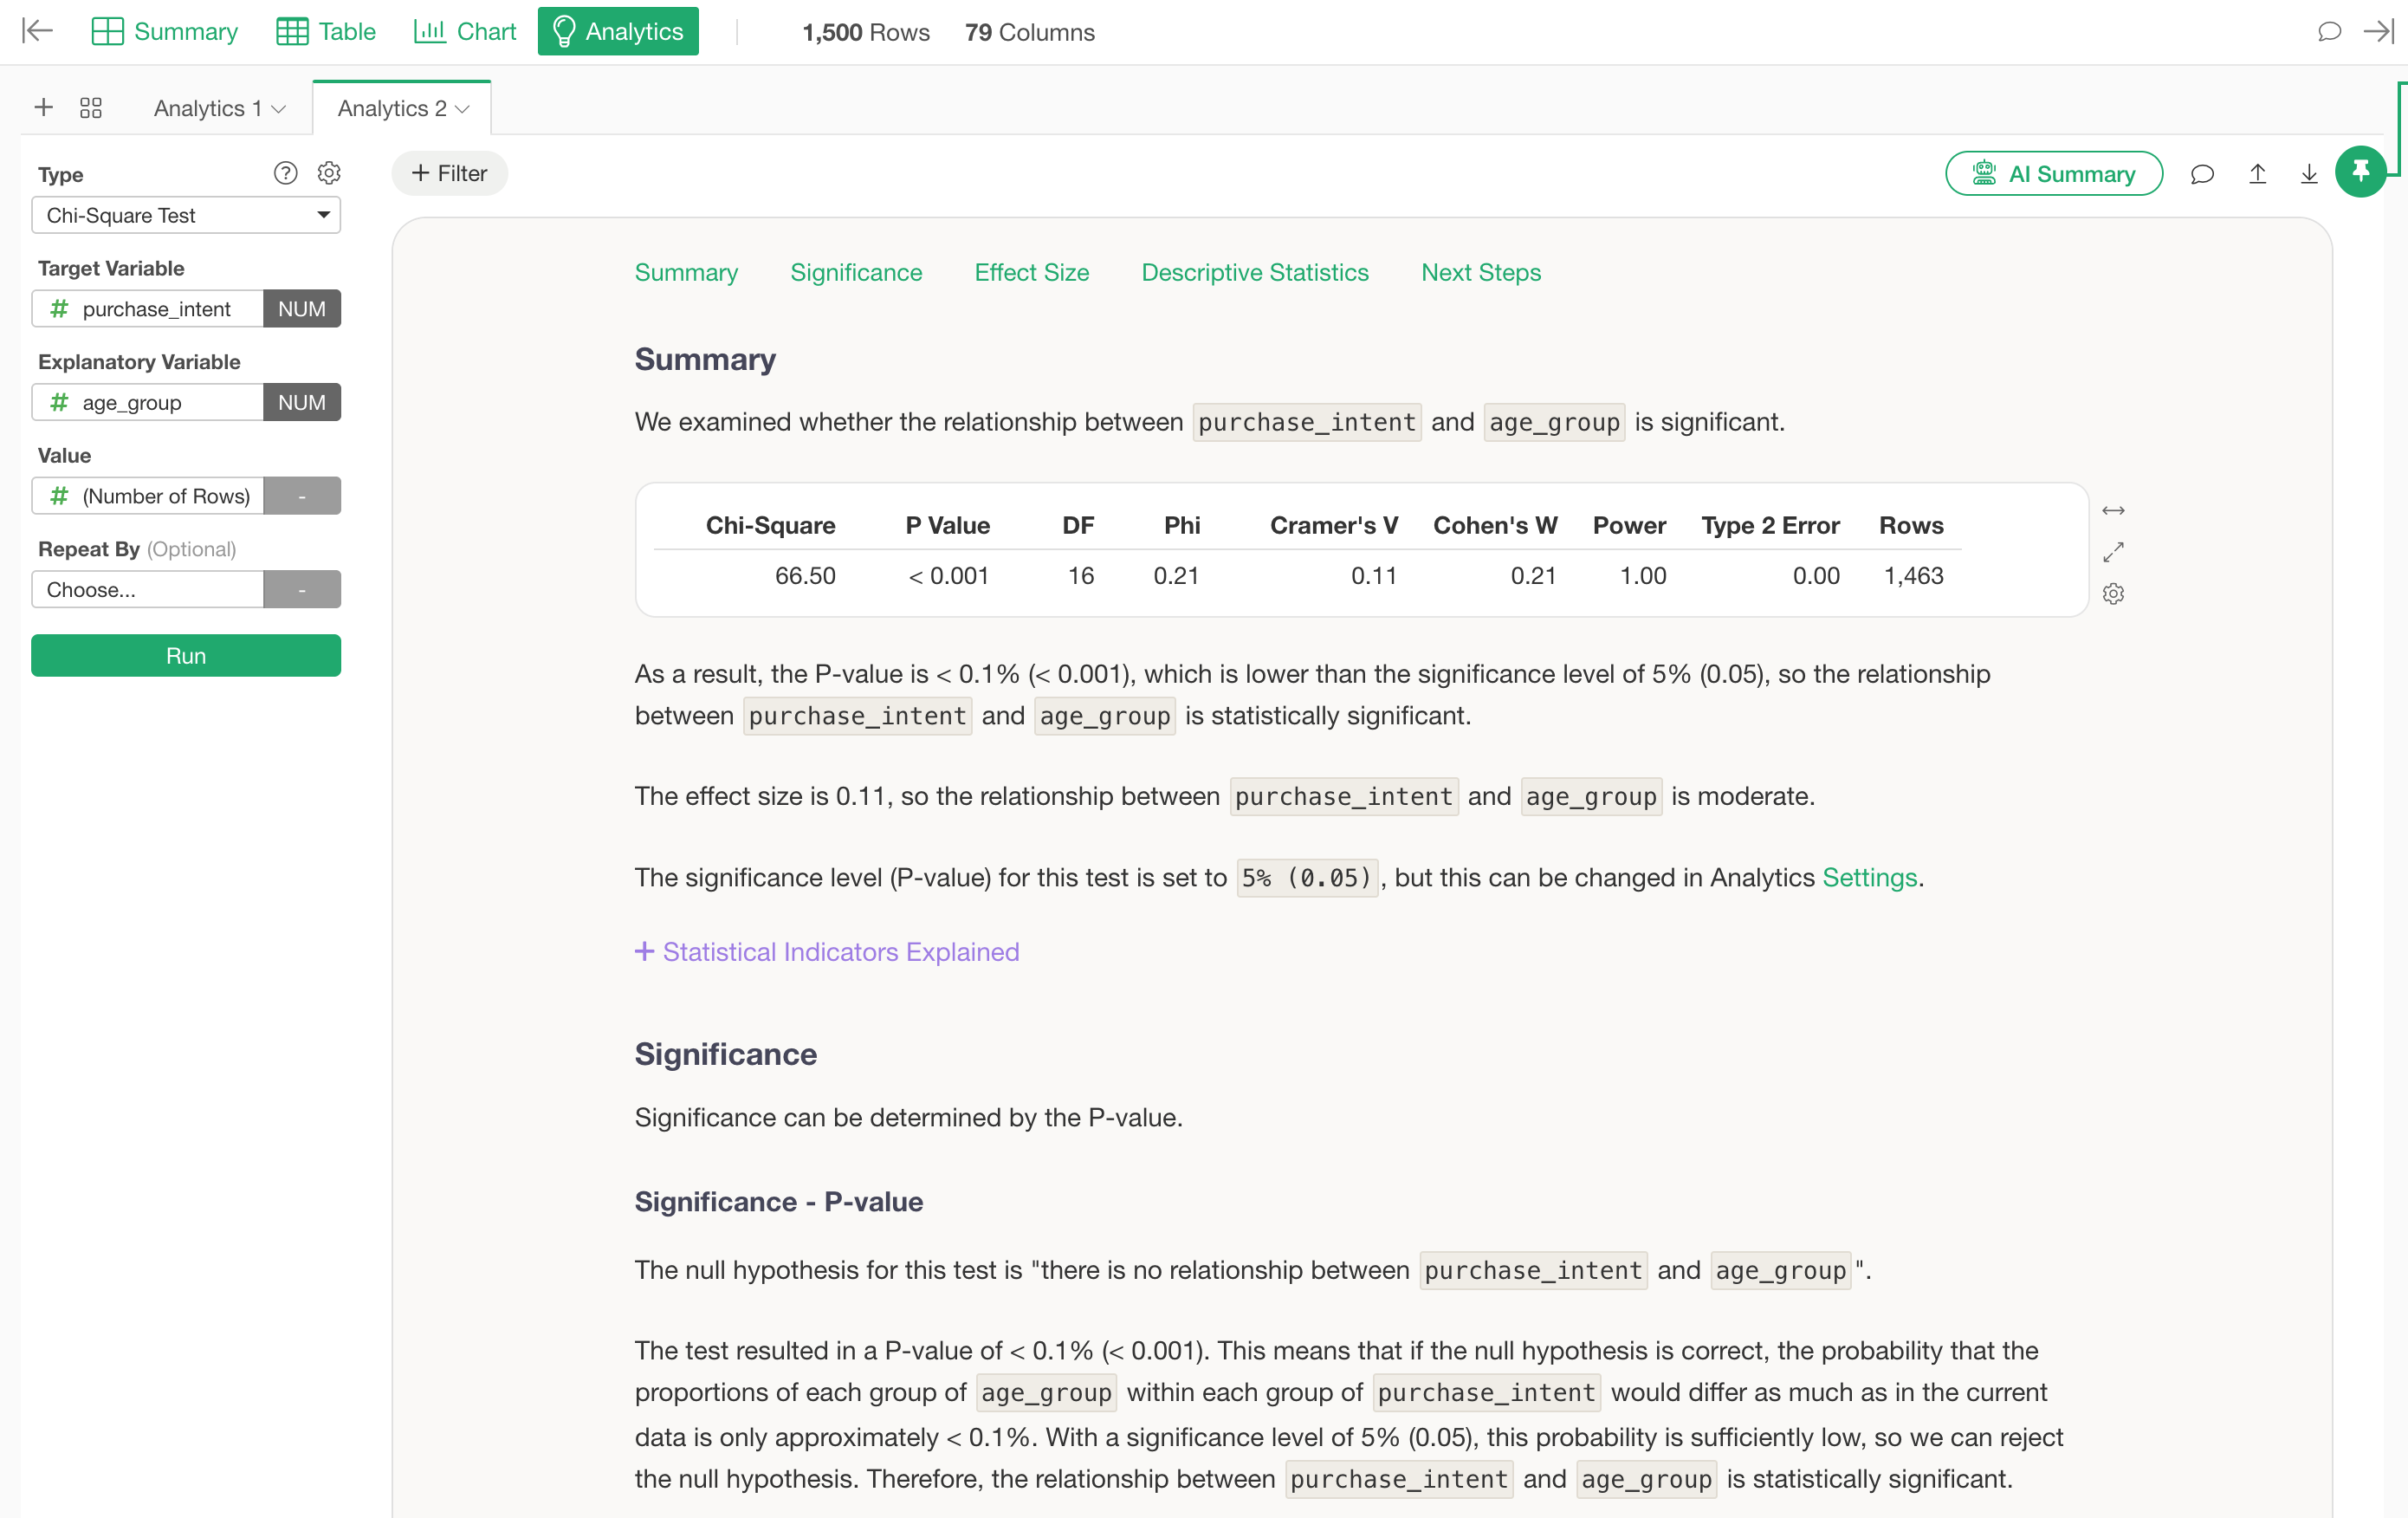
Hypothesis Testing
Check whether a difference between groups is statistically significant or could just be down to chance.
Regression Analysis
Account for multiple factors at once to see which variables are related to an outcome, and by how much.
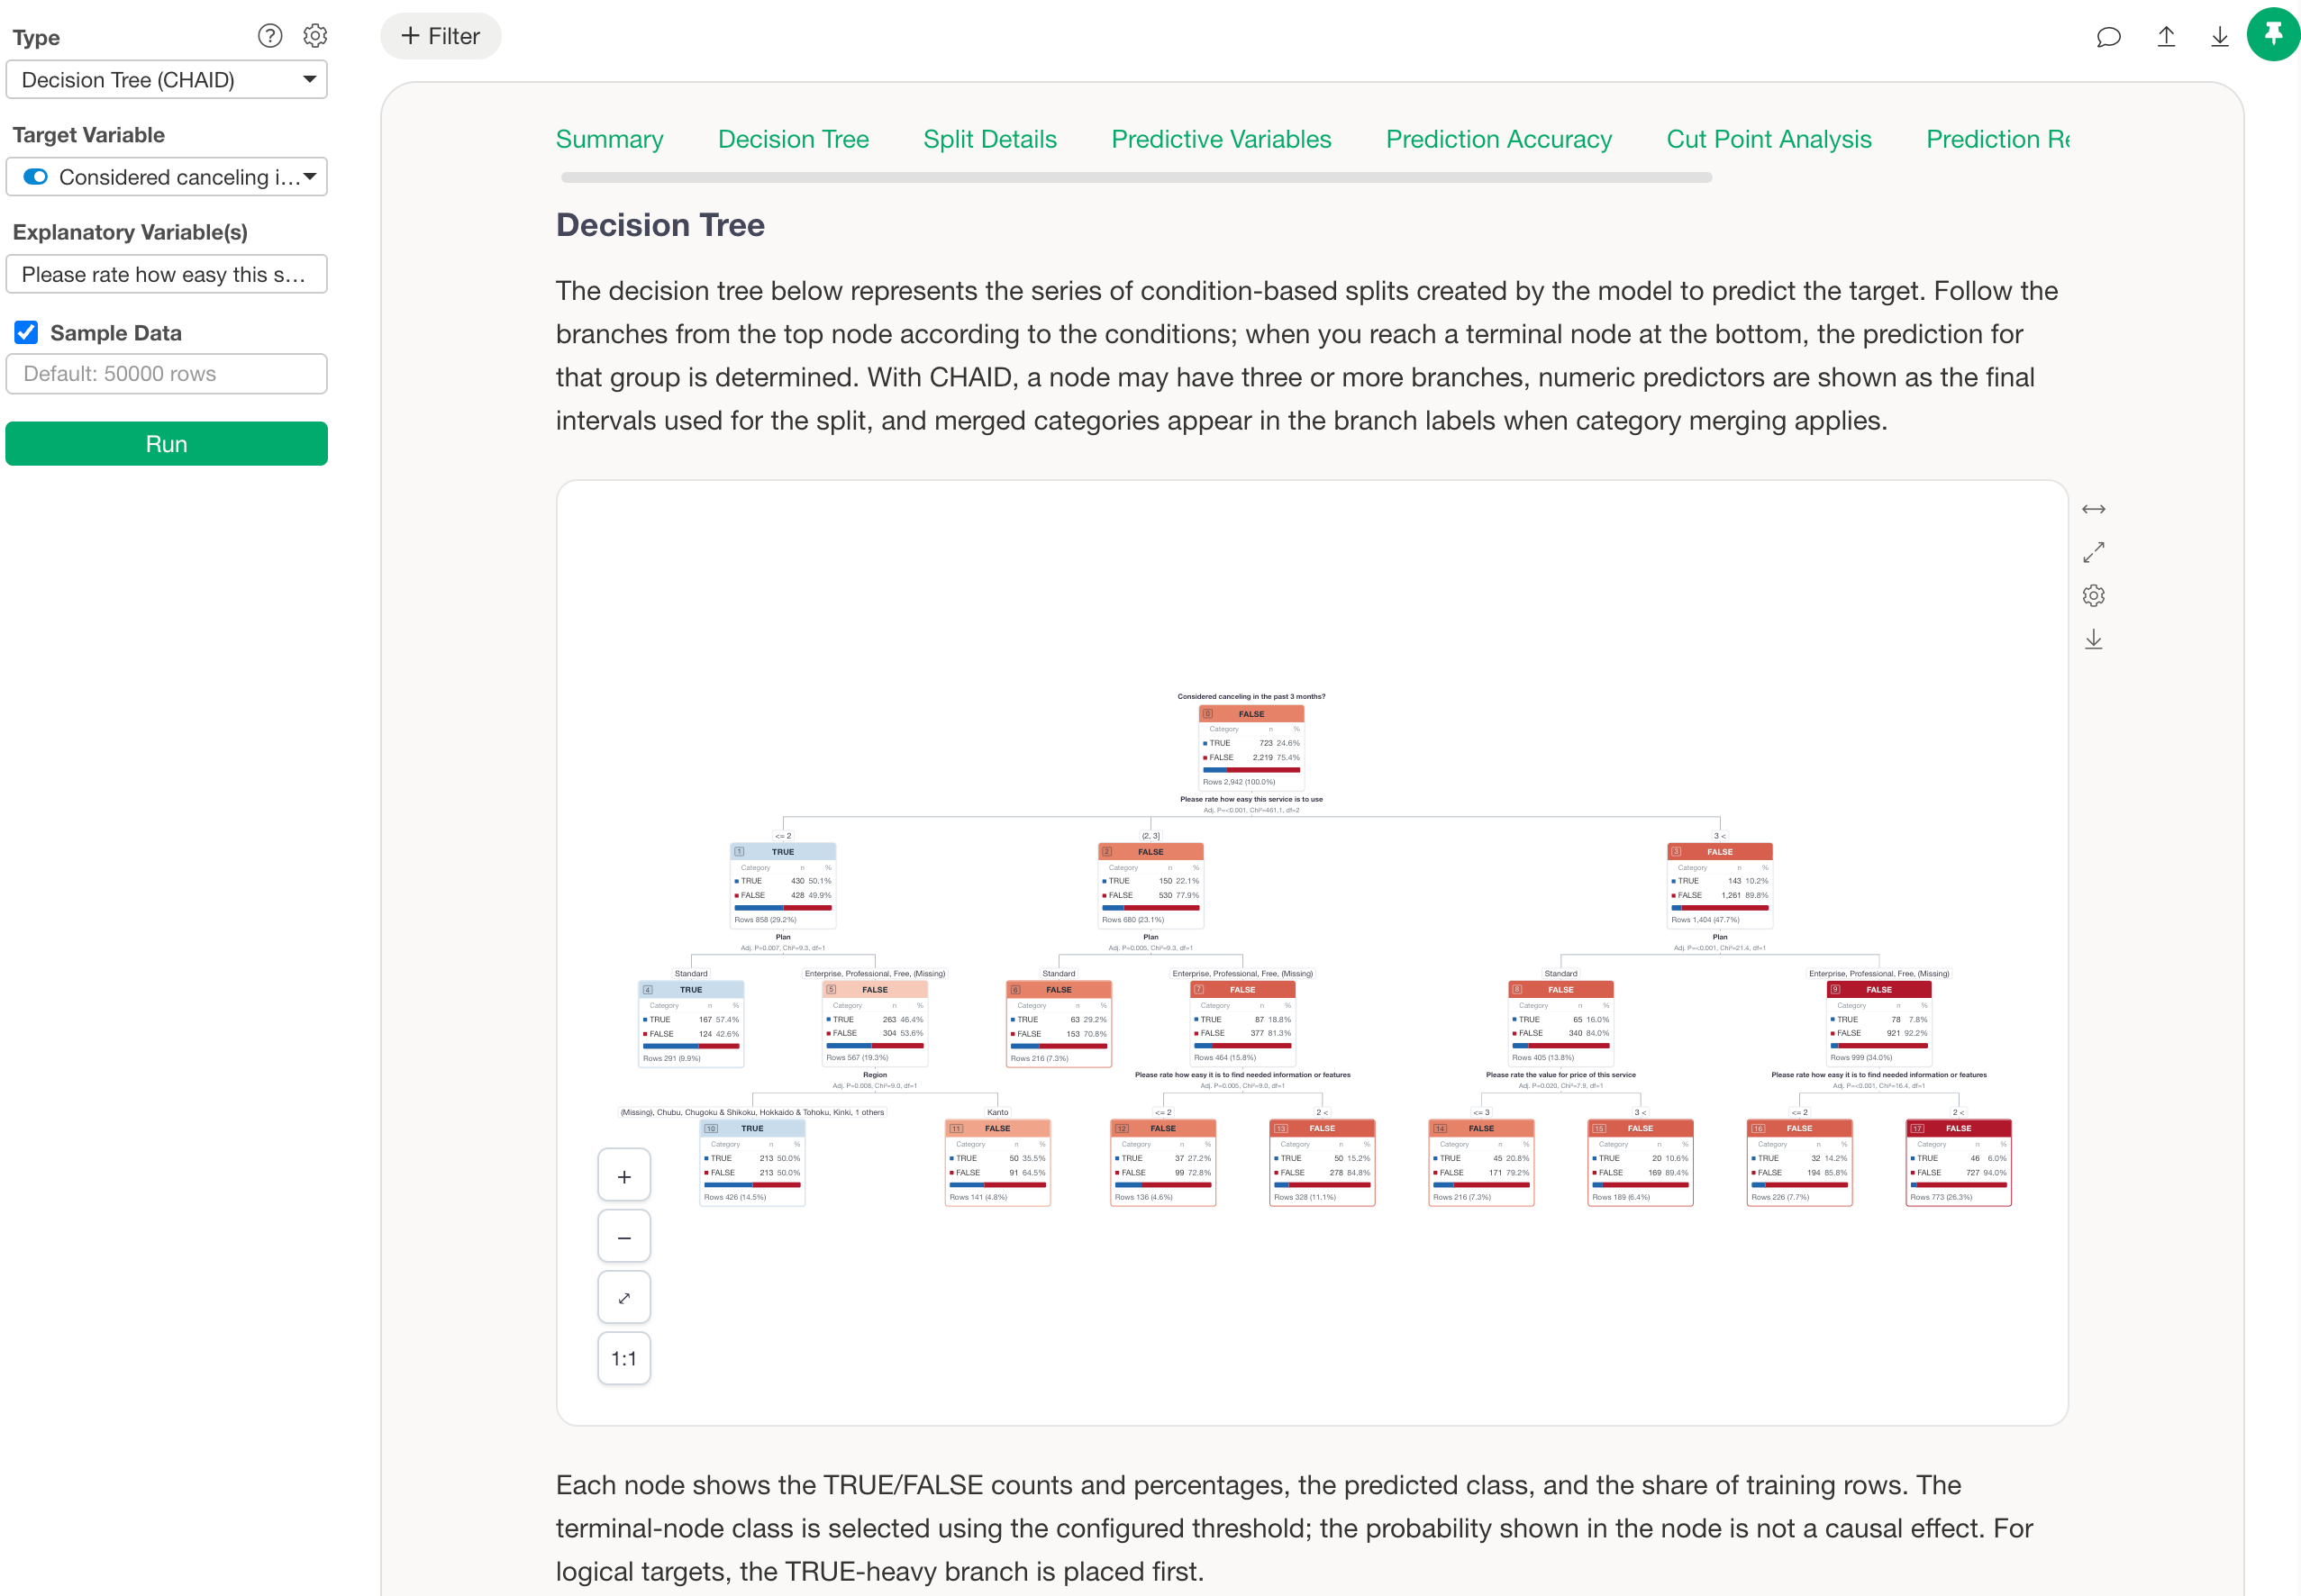
Decision Trees (CART / CHAID)
See which combinations of conditions lead to different outcomes, laid out as an easy-to-read tree.
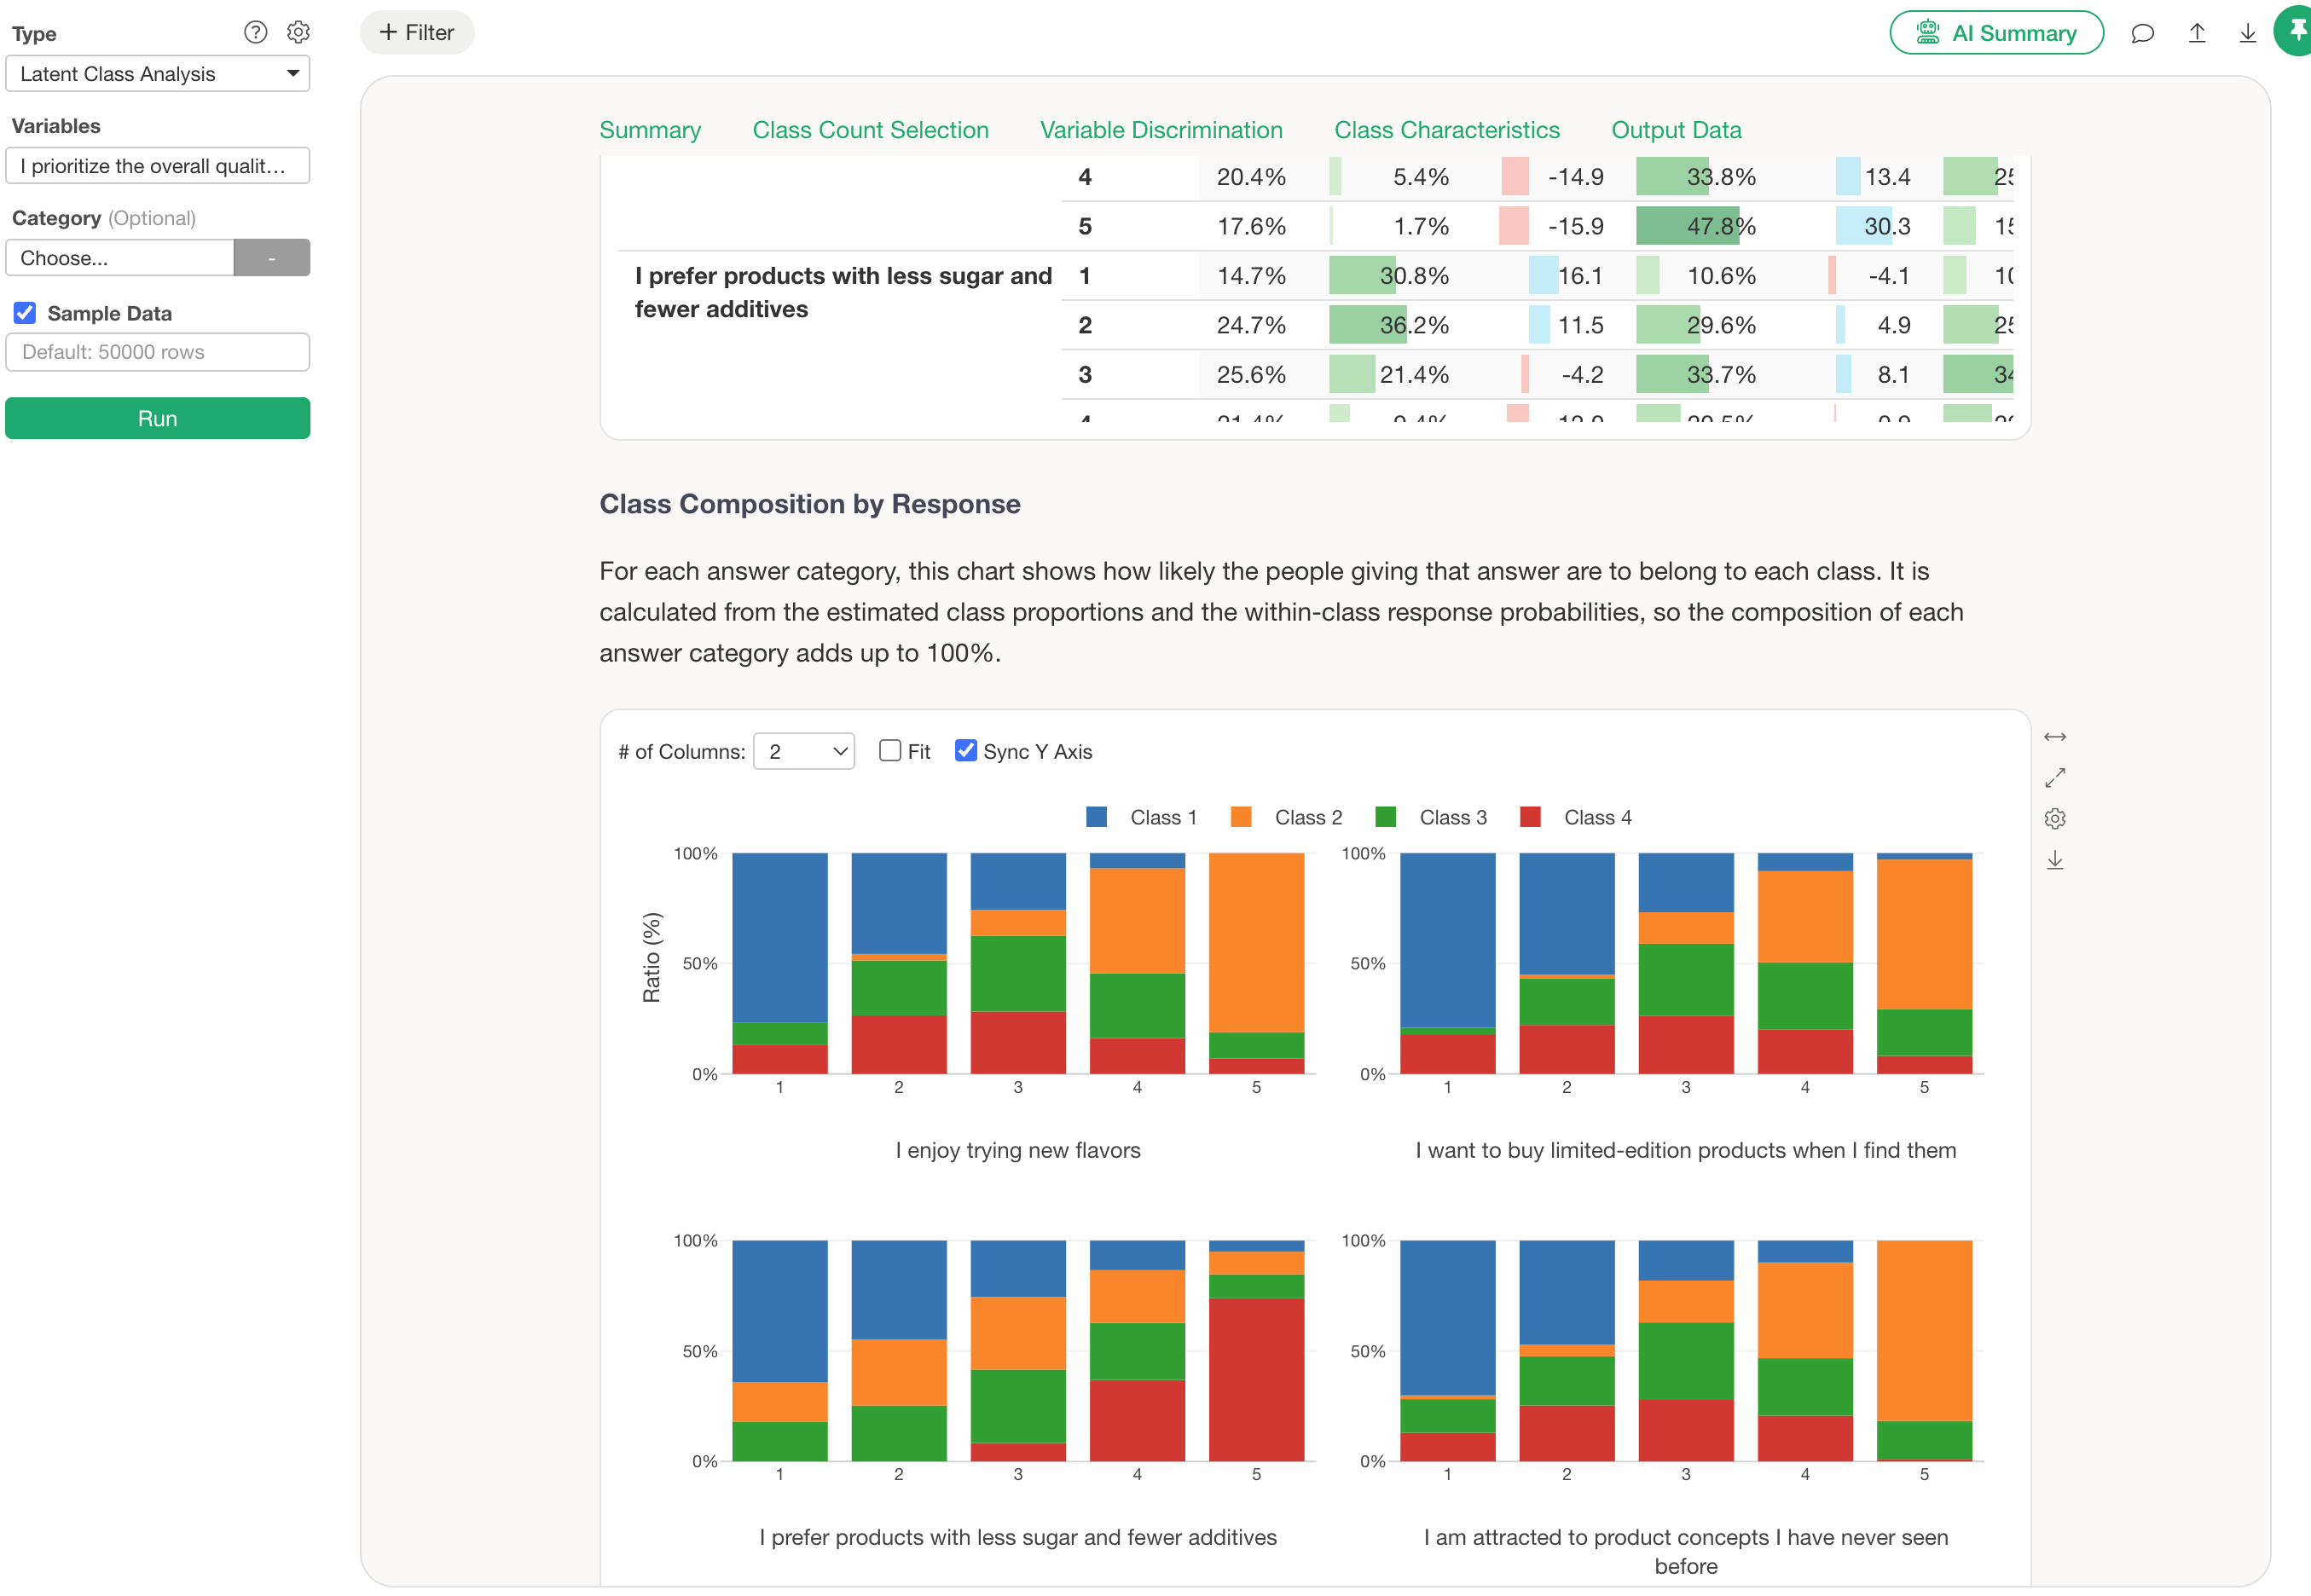
Clustering / Latent Class Analysis
Group people or items with similar characteristics or response patterns to uncover the segments hidden in your data.
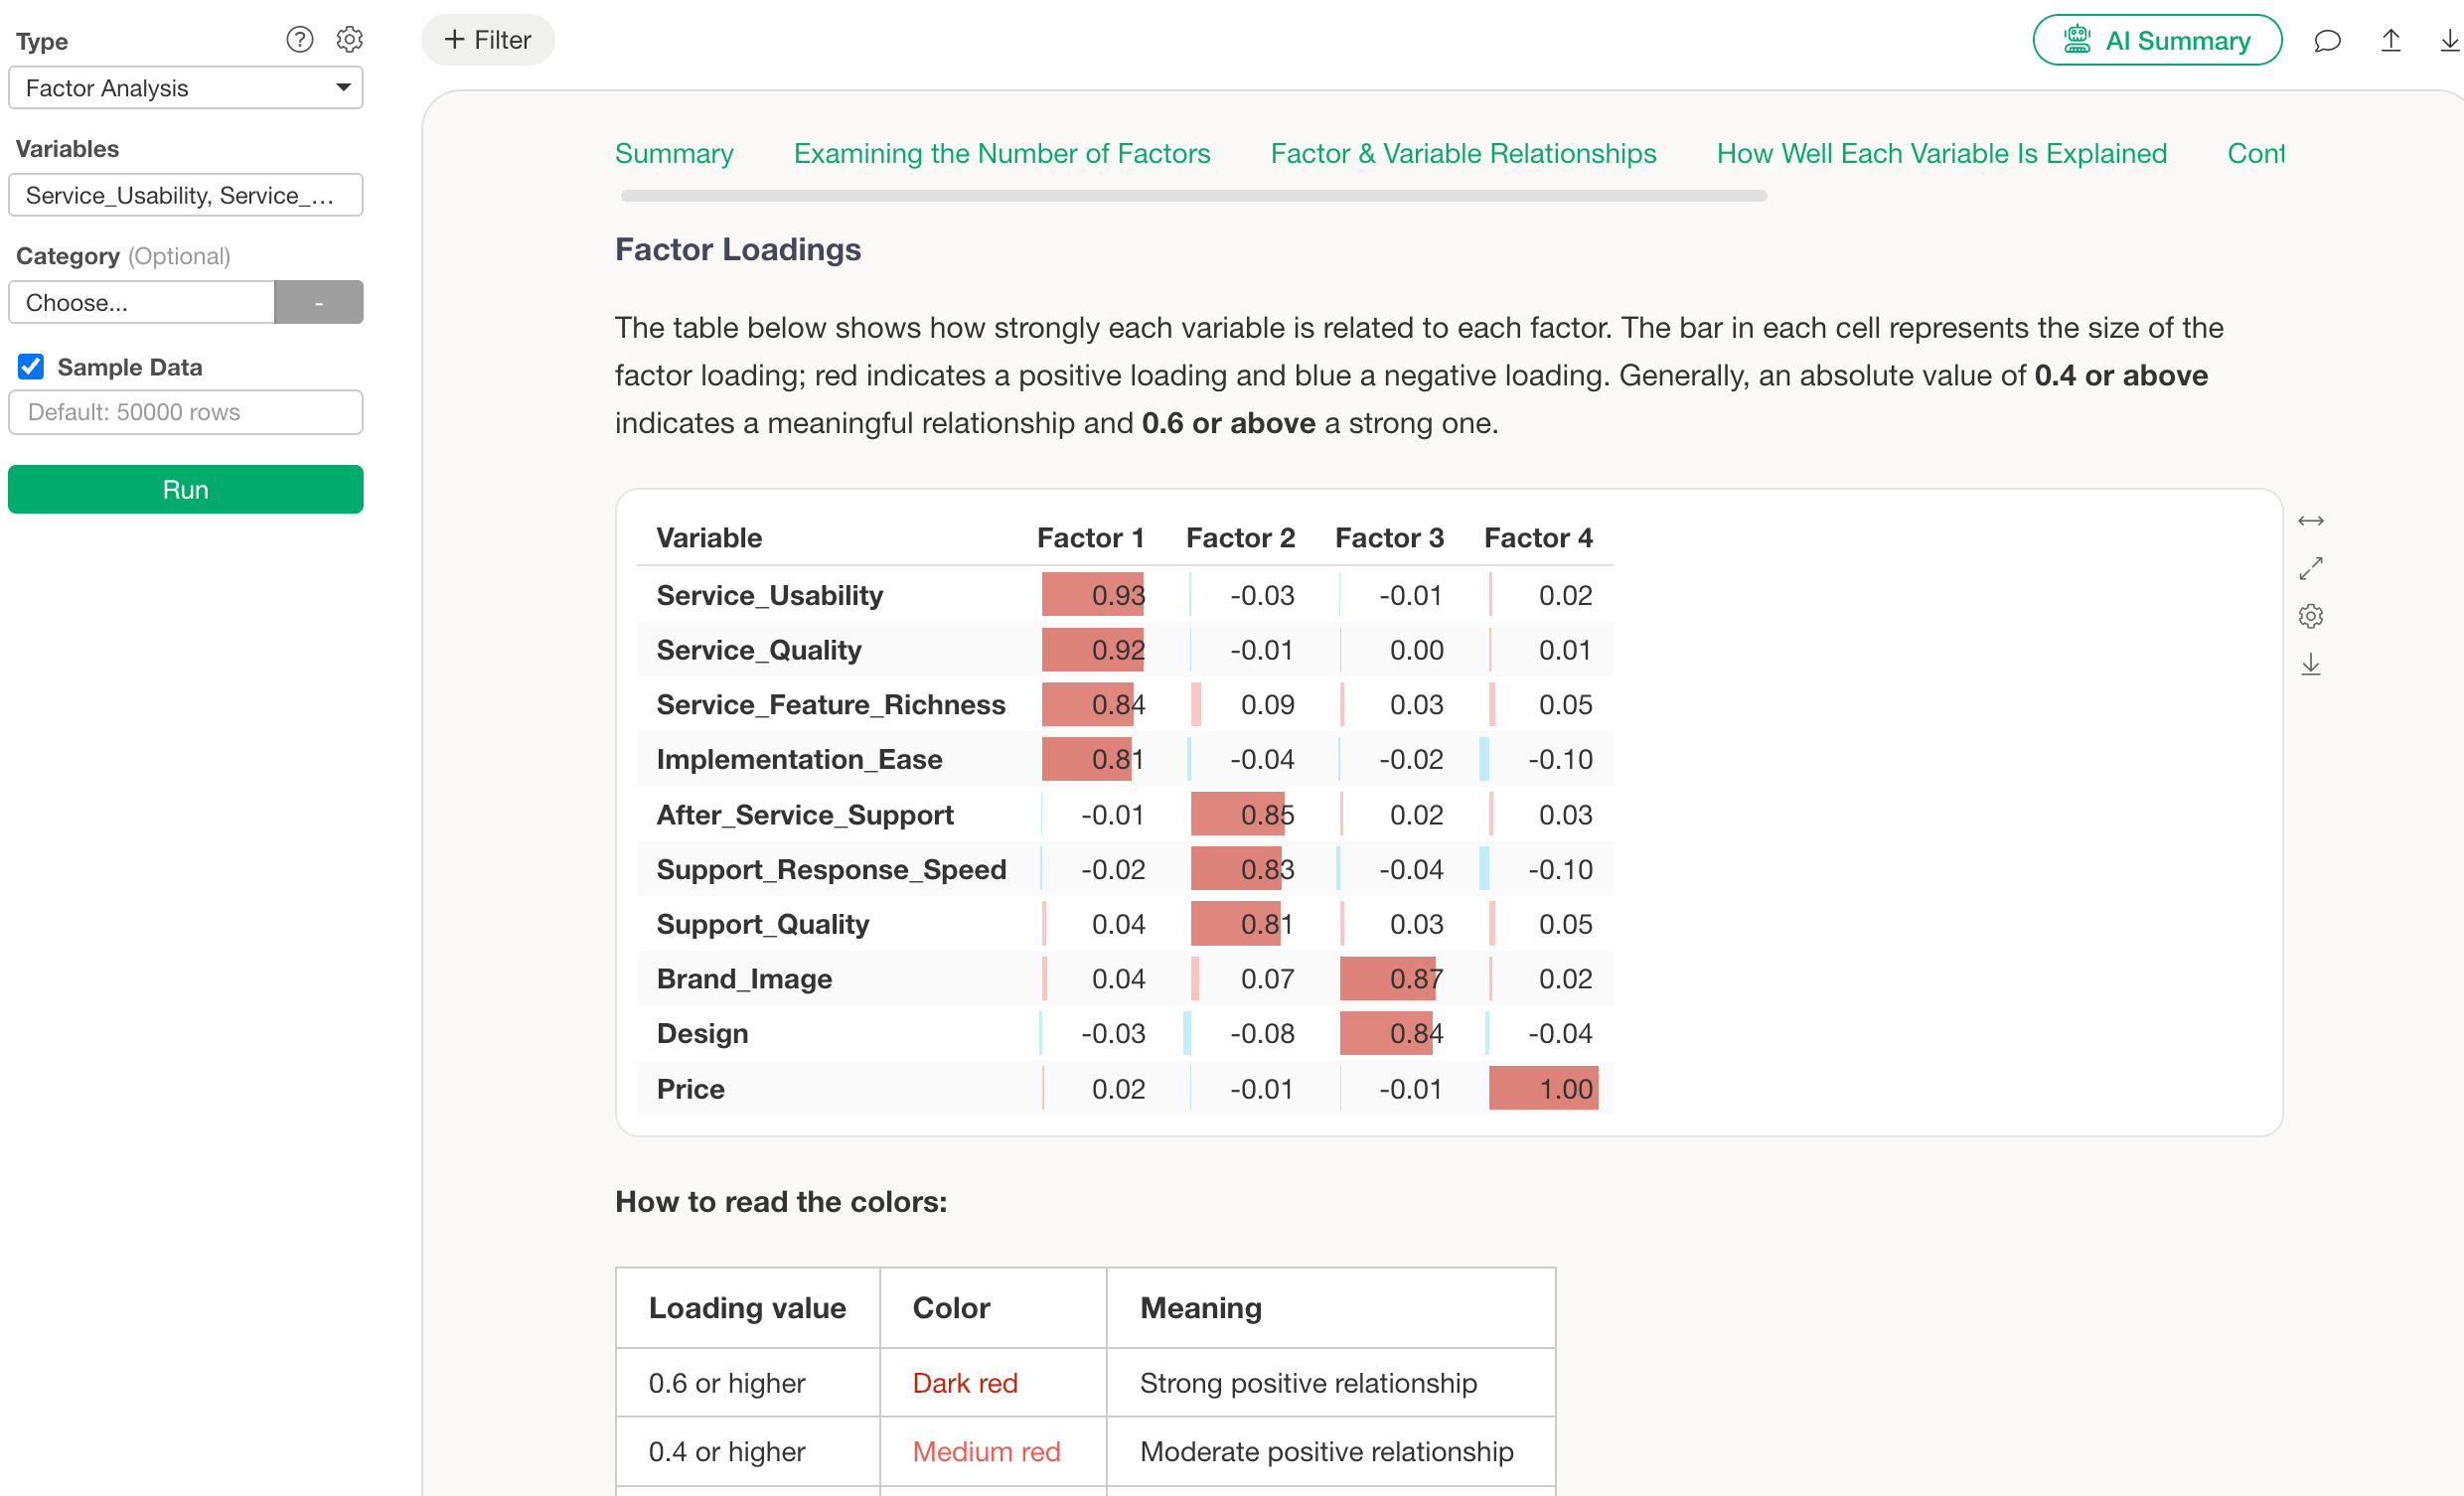
Factor Analysis / Principal Component Analysis
Find the common factors and patterns behind many variables, and understand complex data through a simpler structure.
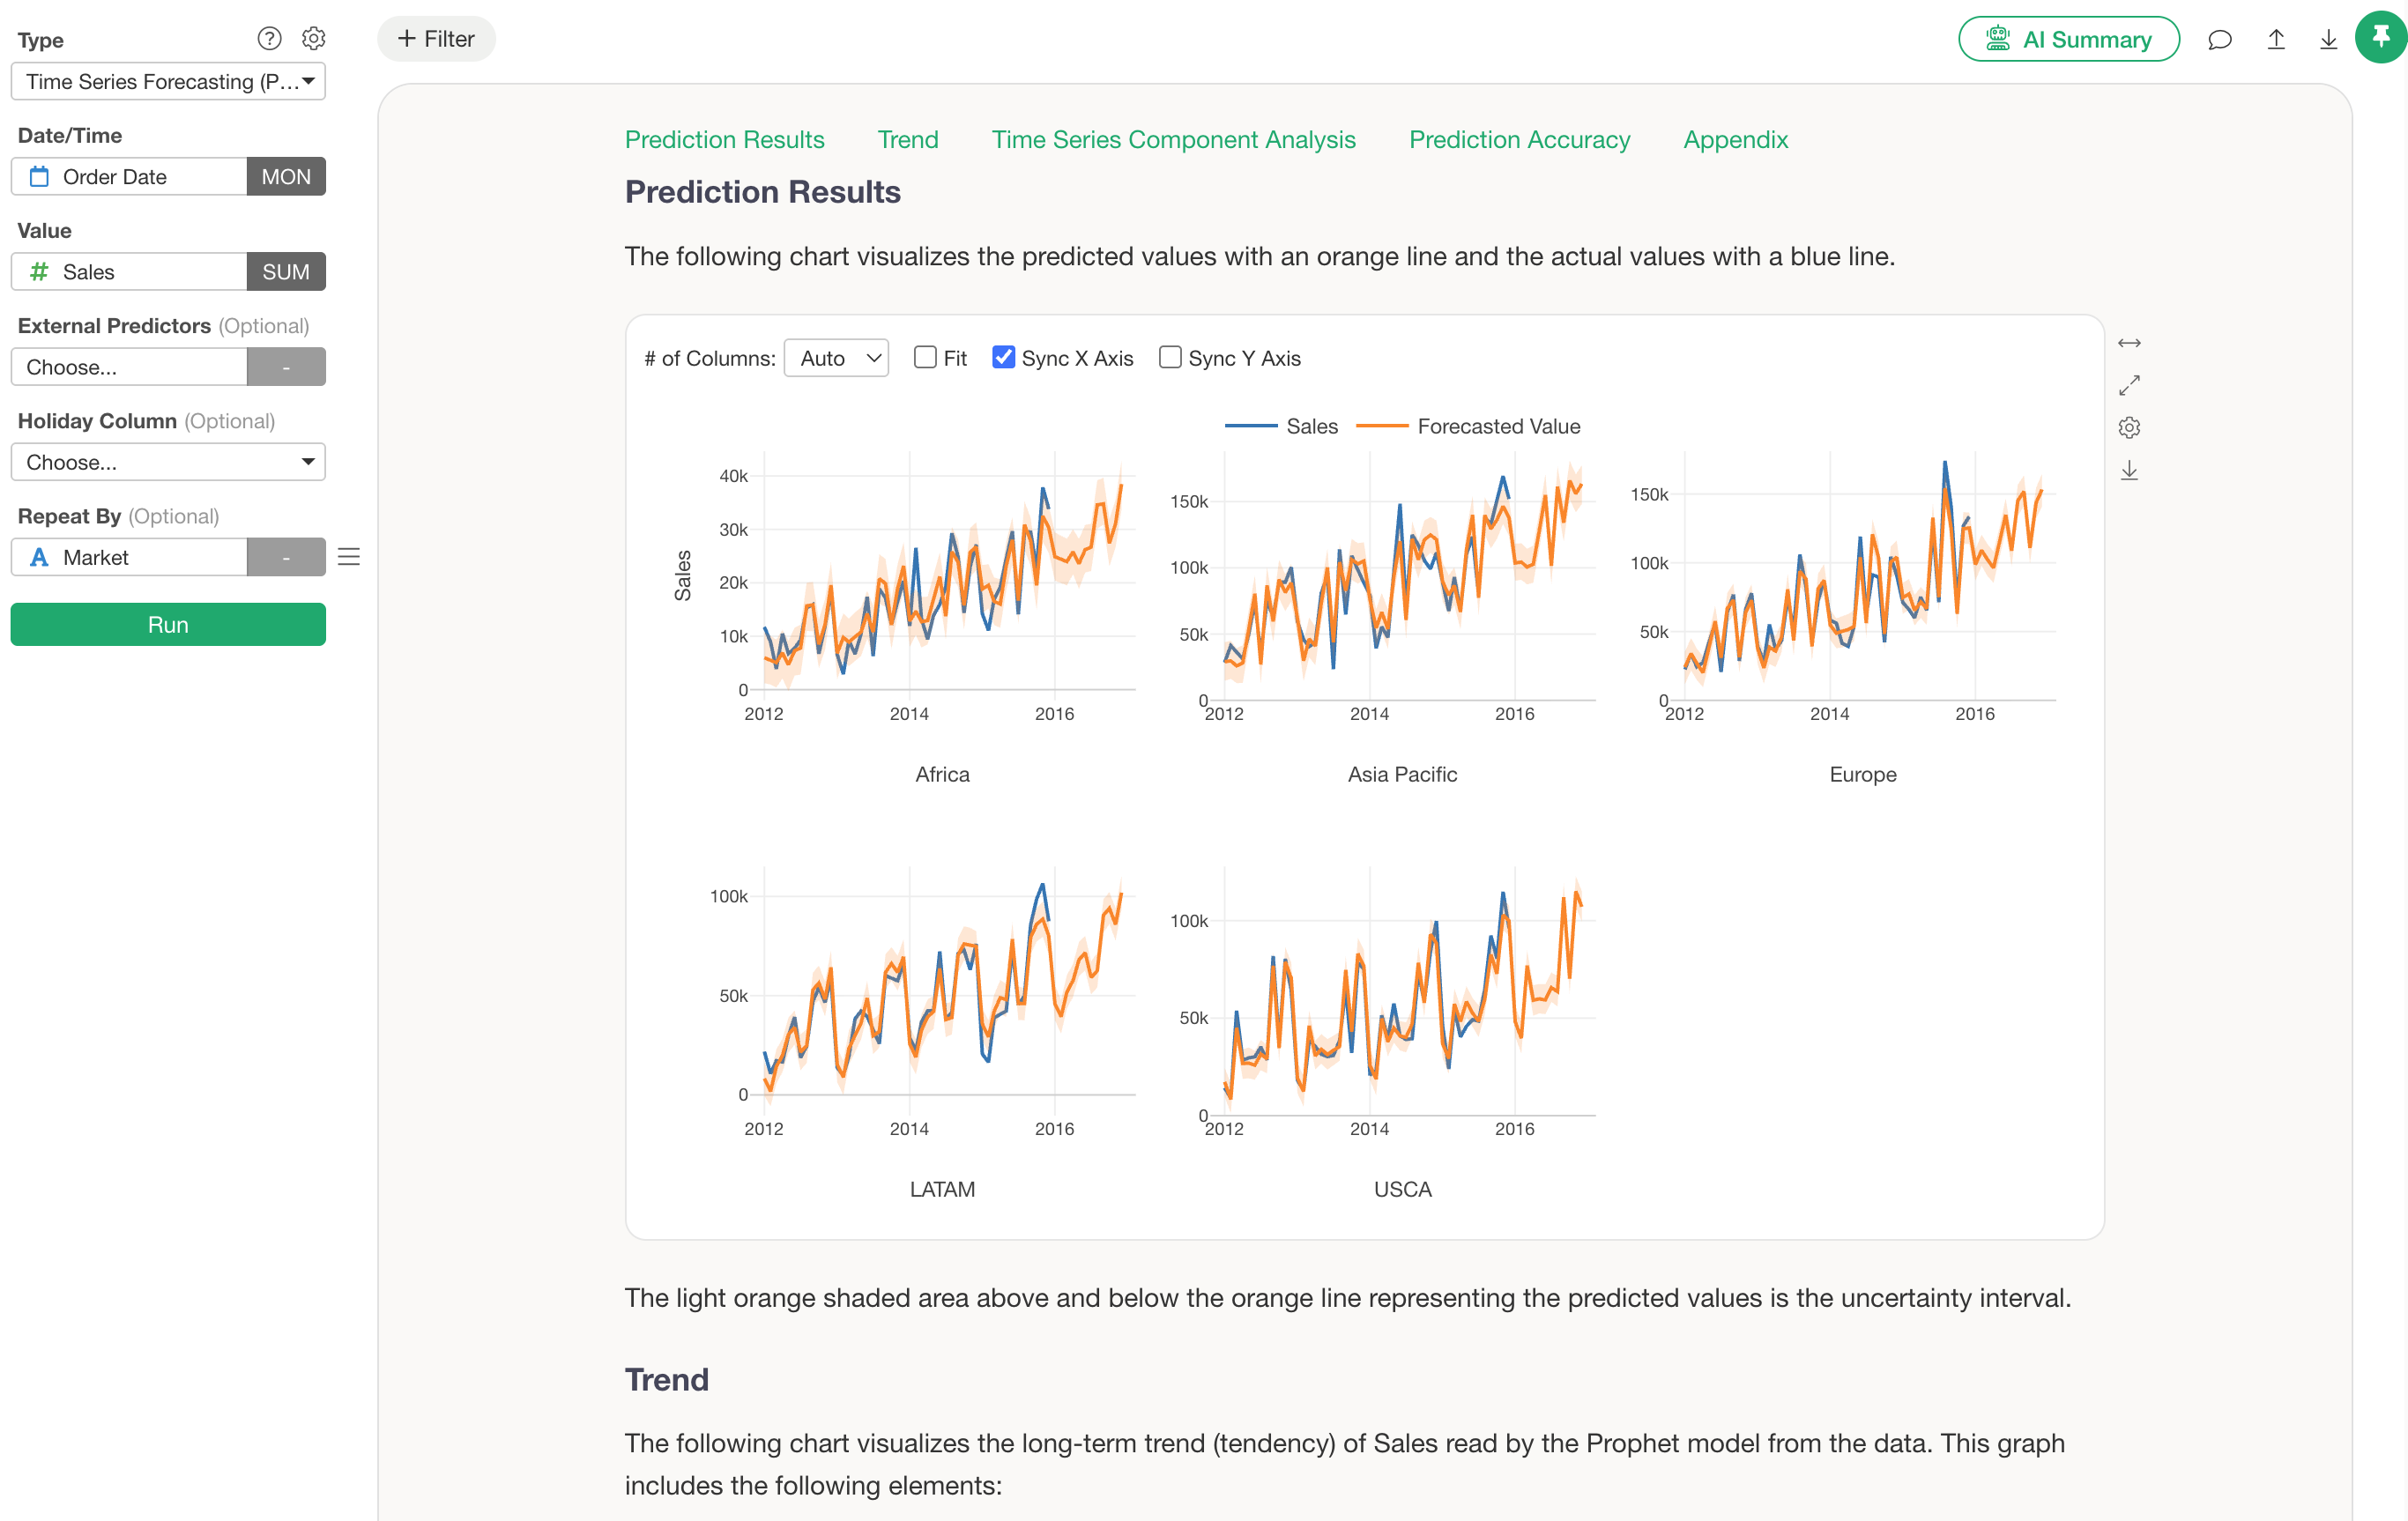
Time Series Analysis / Forecasting
Analyze the trends and seasonality in historical data to understand and forecast what comes next.
Take survey analysis from tabulation to real understanding.
In survey analysis, checking response trends with topline tables and cross-tabs is often just the start. You also want to understand the reasons behind the answers and who your respondents really are.
With Exploratory, you can handle survey data preparation, multiple-response questions, cross-tabs, statistical tests, driver analysis, segmentation, and AI analysis of open-ended responses in a single analytics workflow.
Faster, more flexible cross-tabs.
Handle survey-specific tabulation with ease: multiple-response questions, Top 2 / Bottom 2 box, net scores, multiple banners and stubs, and weighting.
Go from tables straight to deeper analysis.
When you spot a difference, dig into what’s behind it with hypothesis testing, regression, decision trees, factor analysis, clustering, latent class analysis, and more.
Analyze open-ended responses with AI.
Use AI to classify and summarize open-ended responses, then analyze them together with your quantitative data.
What our users say
Companies, universities, and research institutions around the world use Exploratory for their data analysis.
Exploring data is a key part of my duties. Exploratory allows me to quickly walk through different scenarios, add paths, visualize, and revert a few steps when I need to, all in an easy to use interface. It saves me quite a bit of time...
Exploratory has changed my data analysis workflow. Now I am able to use one tool from data wrangling to modeling, but it is also flexible so that I can use it with other tools if needed by the client.
I can spend my time thinking about the data and coming up with questions regarding the underlying patterns rather than spending time learning all the details of the R system.
You mix the power of R with a beautiful user-friendly interface. I once explored a table with more than 40 million rows in Exploratory!
This is an awesome UI experience for Data Scientists.