Analyze survey data,
in one reproducible workflow.
Bring in CSV and Excel exports from any survey tool, and handle data prep, topline tables, cross-tabs, Top 2 Box, multiple-response questions, statistical analysis, open-ended response analysis, and reporting in a single, reproducible analytics workflow in Exploratory.
Survey tools have made data collection easier. But, Analysis is still stuck in Excel.
Affordable, easy-to-use survey tools have made it simple to run surveys in-house instead of outsourcing everything to a research agency.
But every tool exports CSV and Excel files in its own format, leaving analysts to manually clean the data, build crosstabs, calculate metrics, and update reports in Excel.
From raw survey data to finished reports - all in one reproducible workflow.
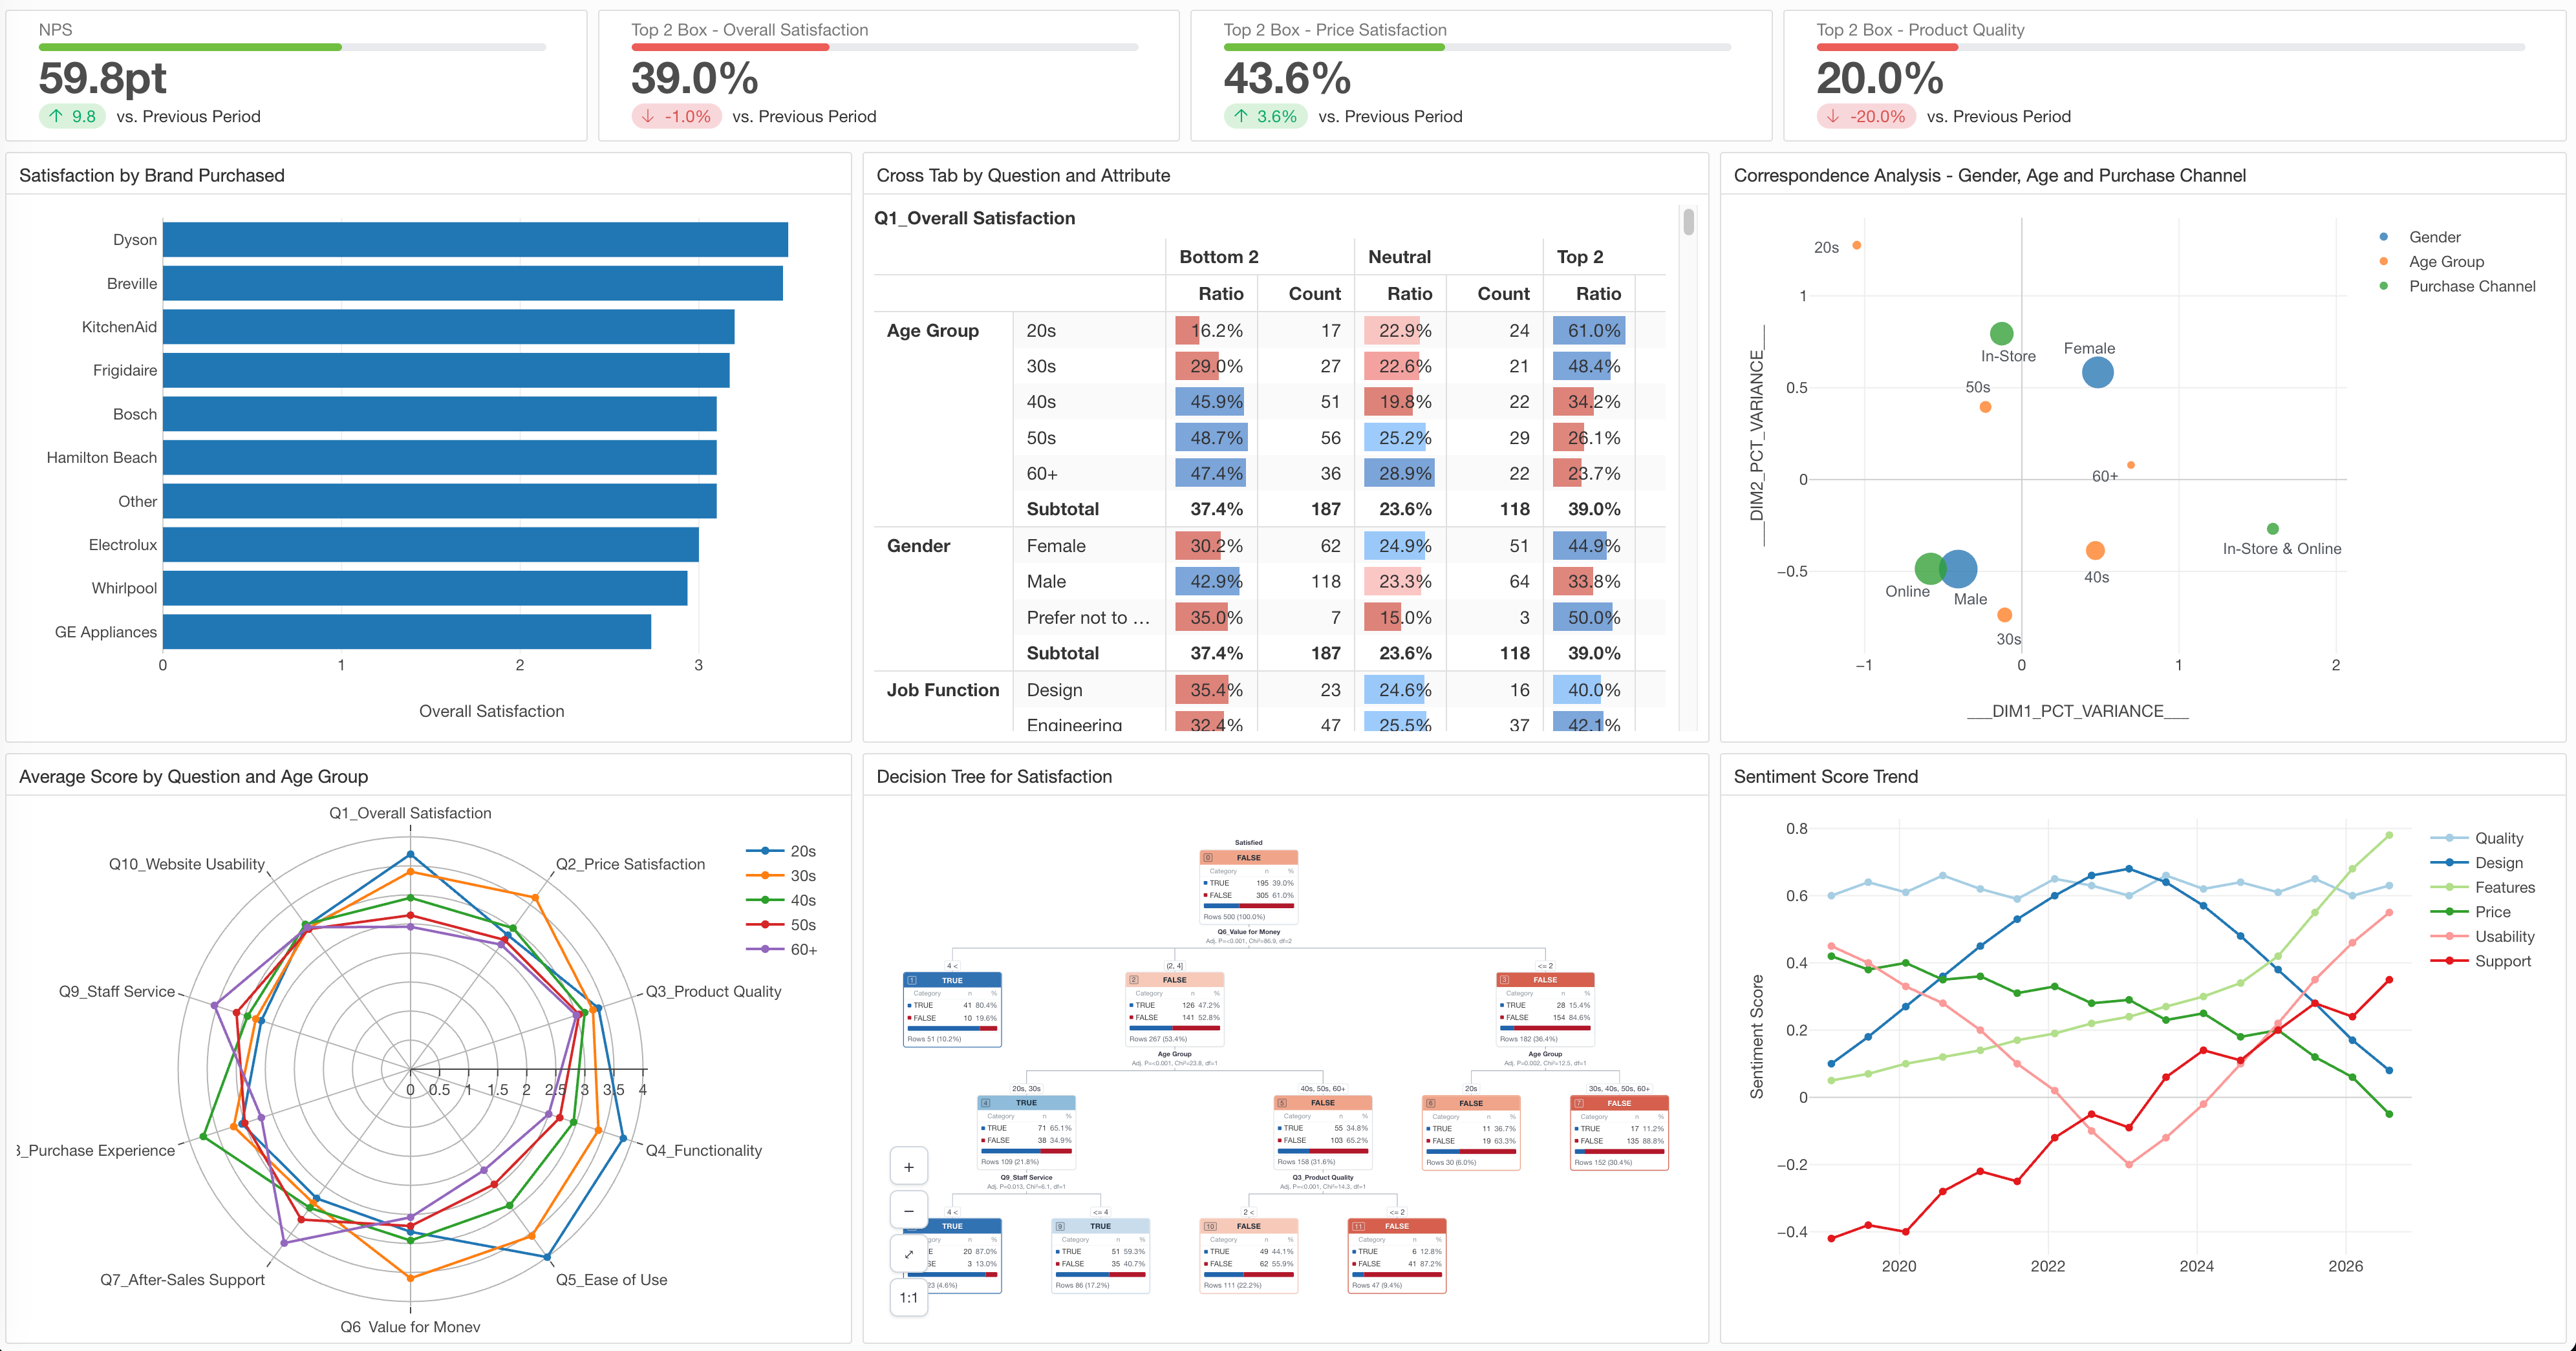
With Exploratory, you can manage the entire survey analysis process in one place - from importing and preparing the data to summarizing, visualizing, analyzing, and reporting the results.
Once you build the workflow, you can reuse it for the next wave of the survey or apply it to data exported from another survey platform.
Import Data
Bring together CSV and Excel exports from multiple survey tools so they’re ready to analyze.
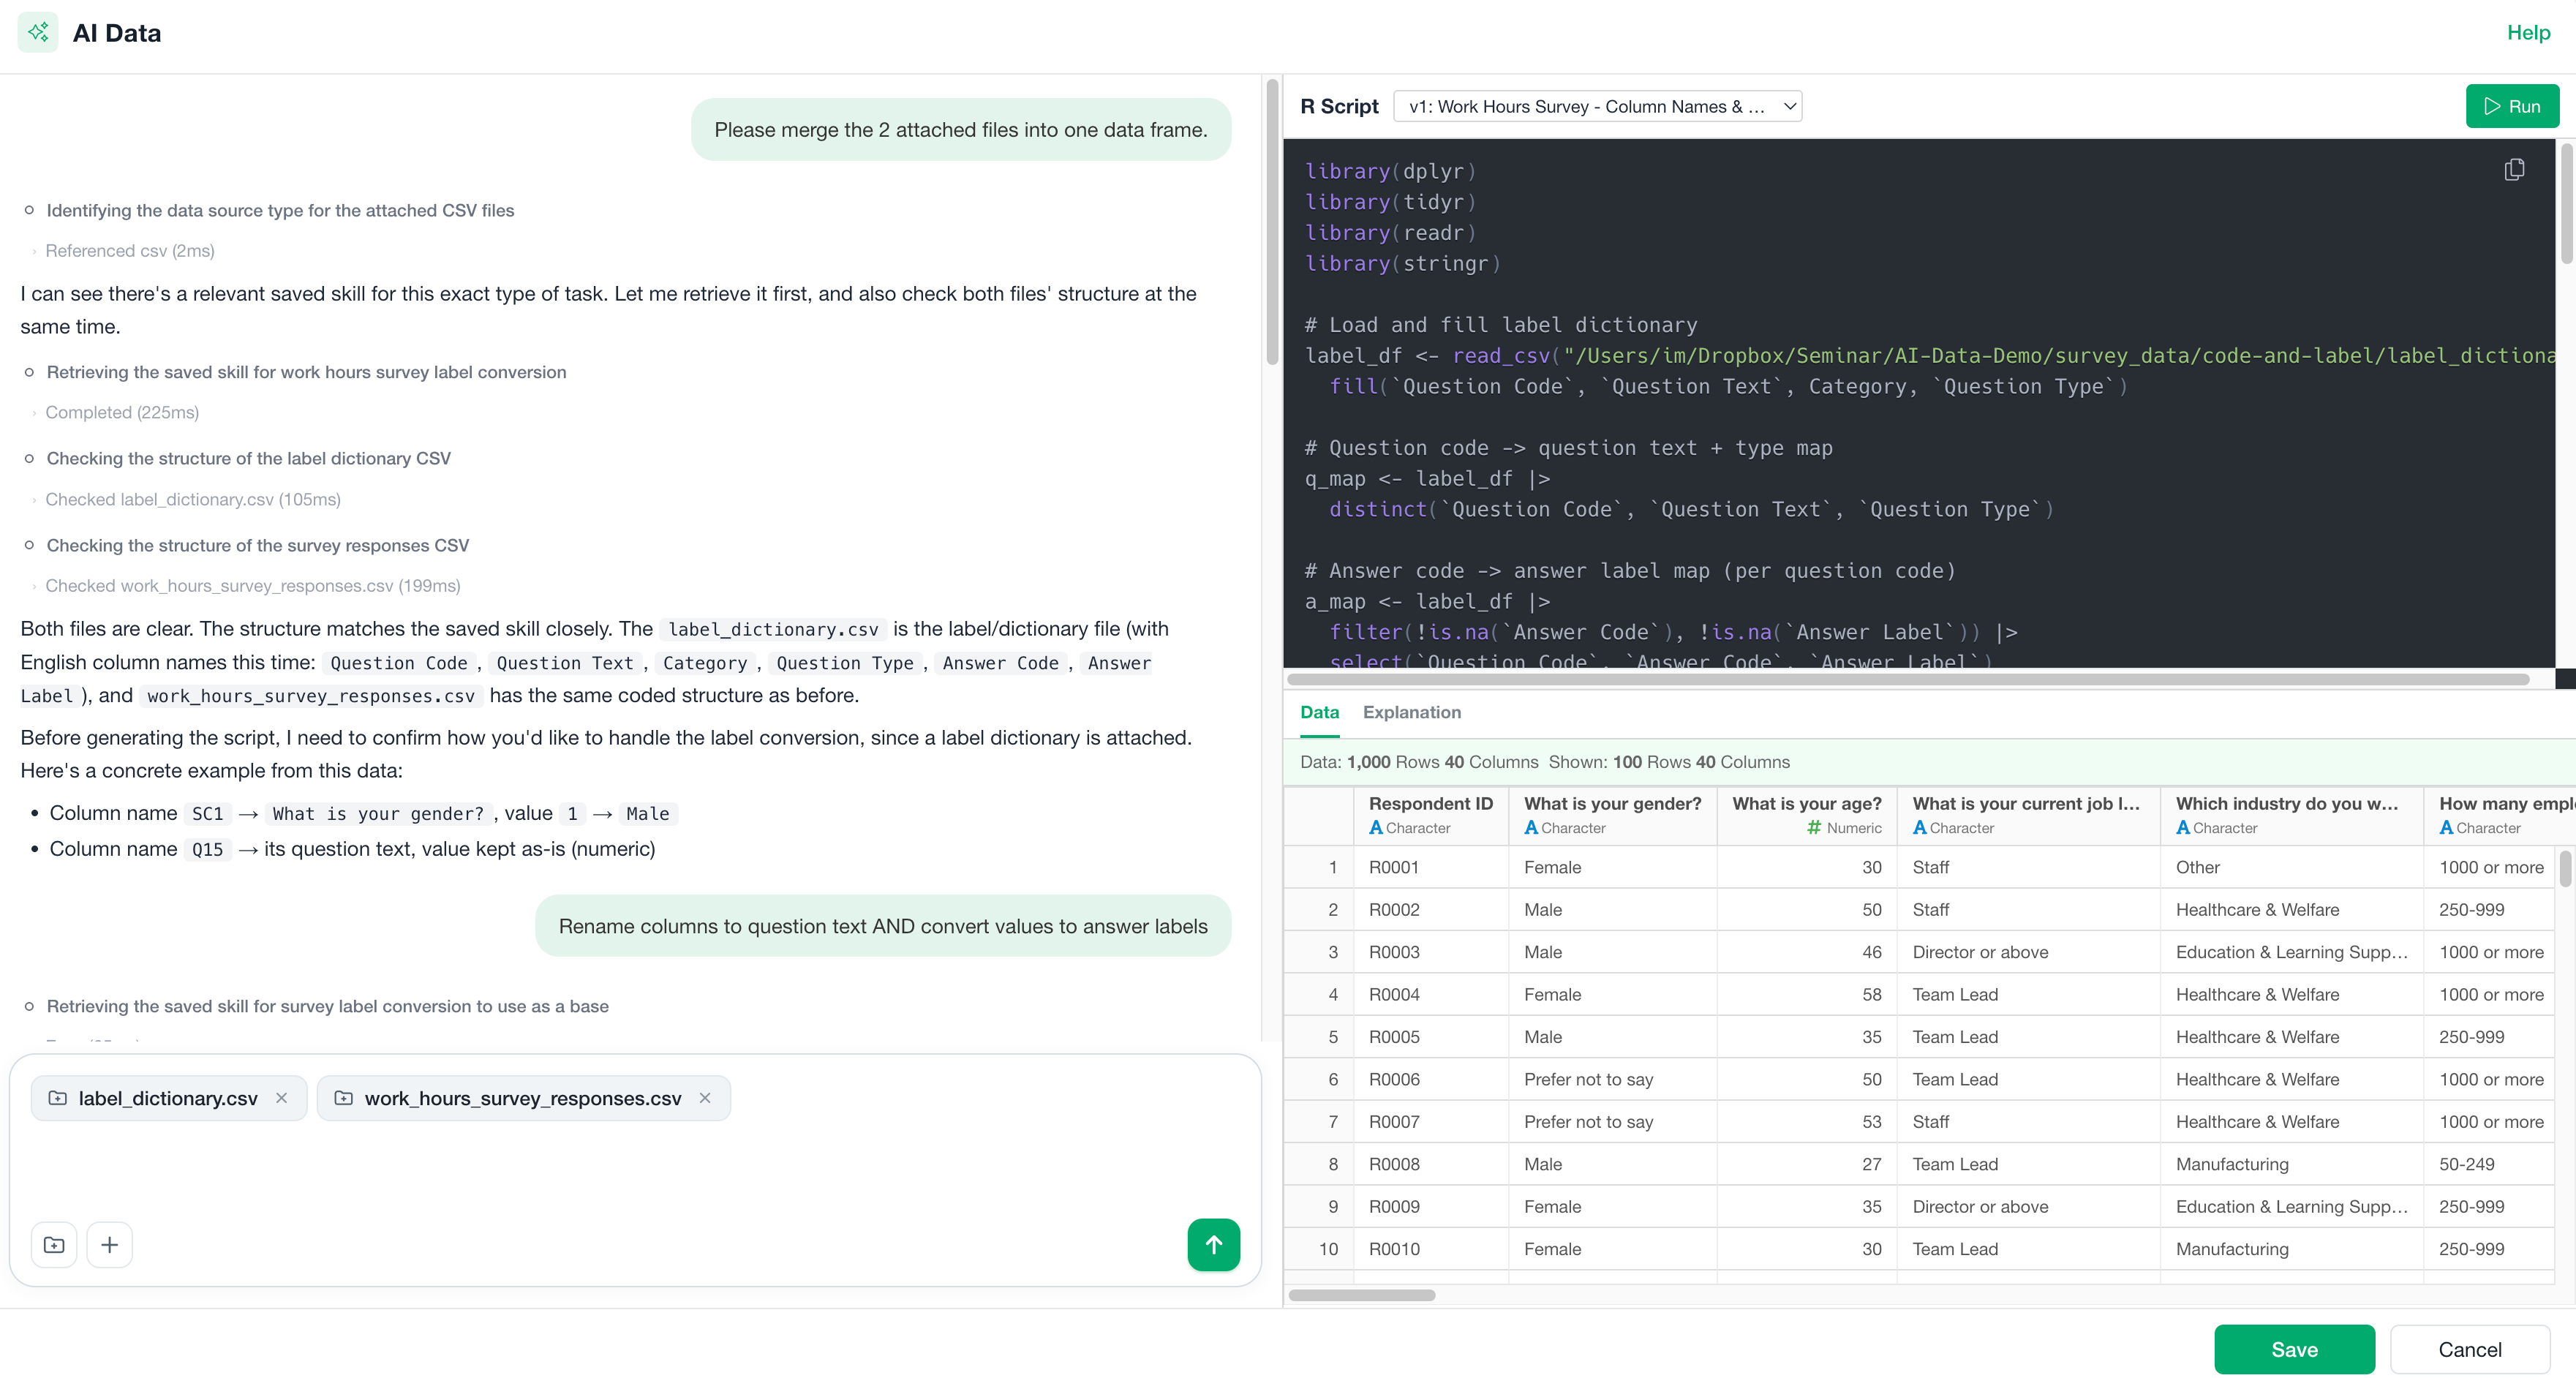
Prepare Data
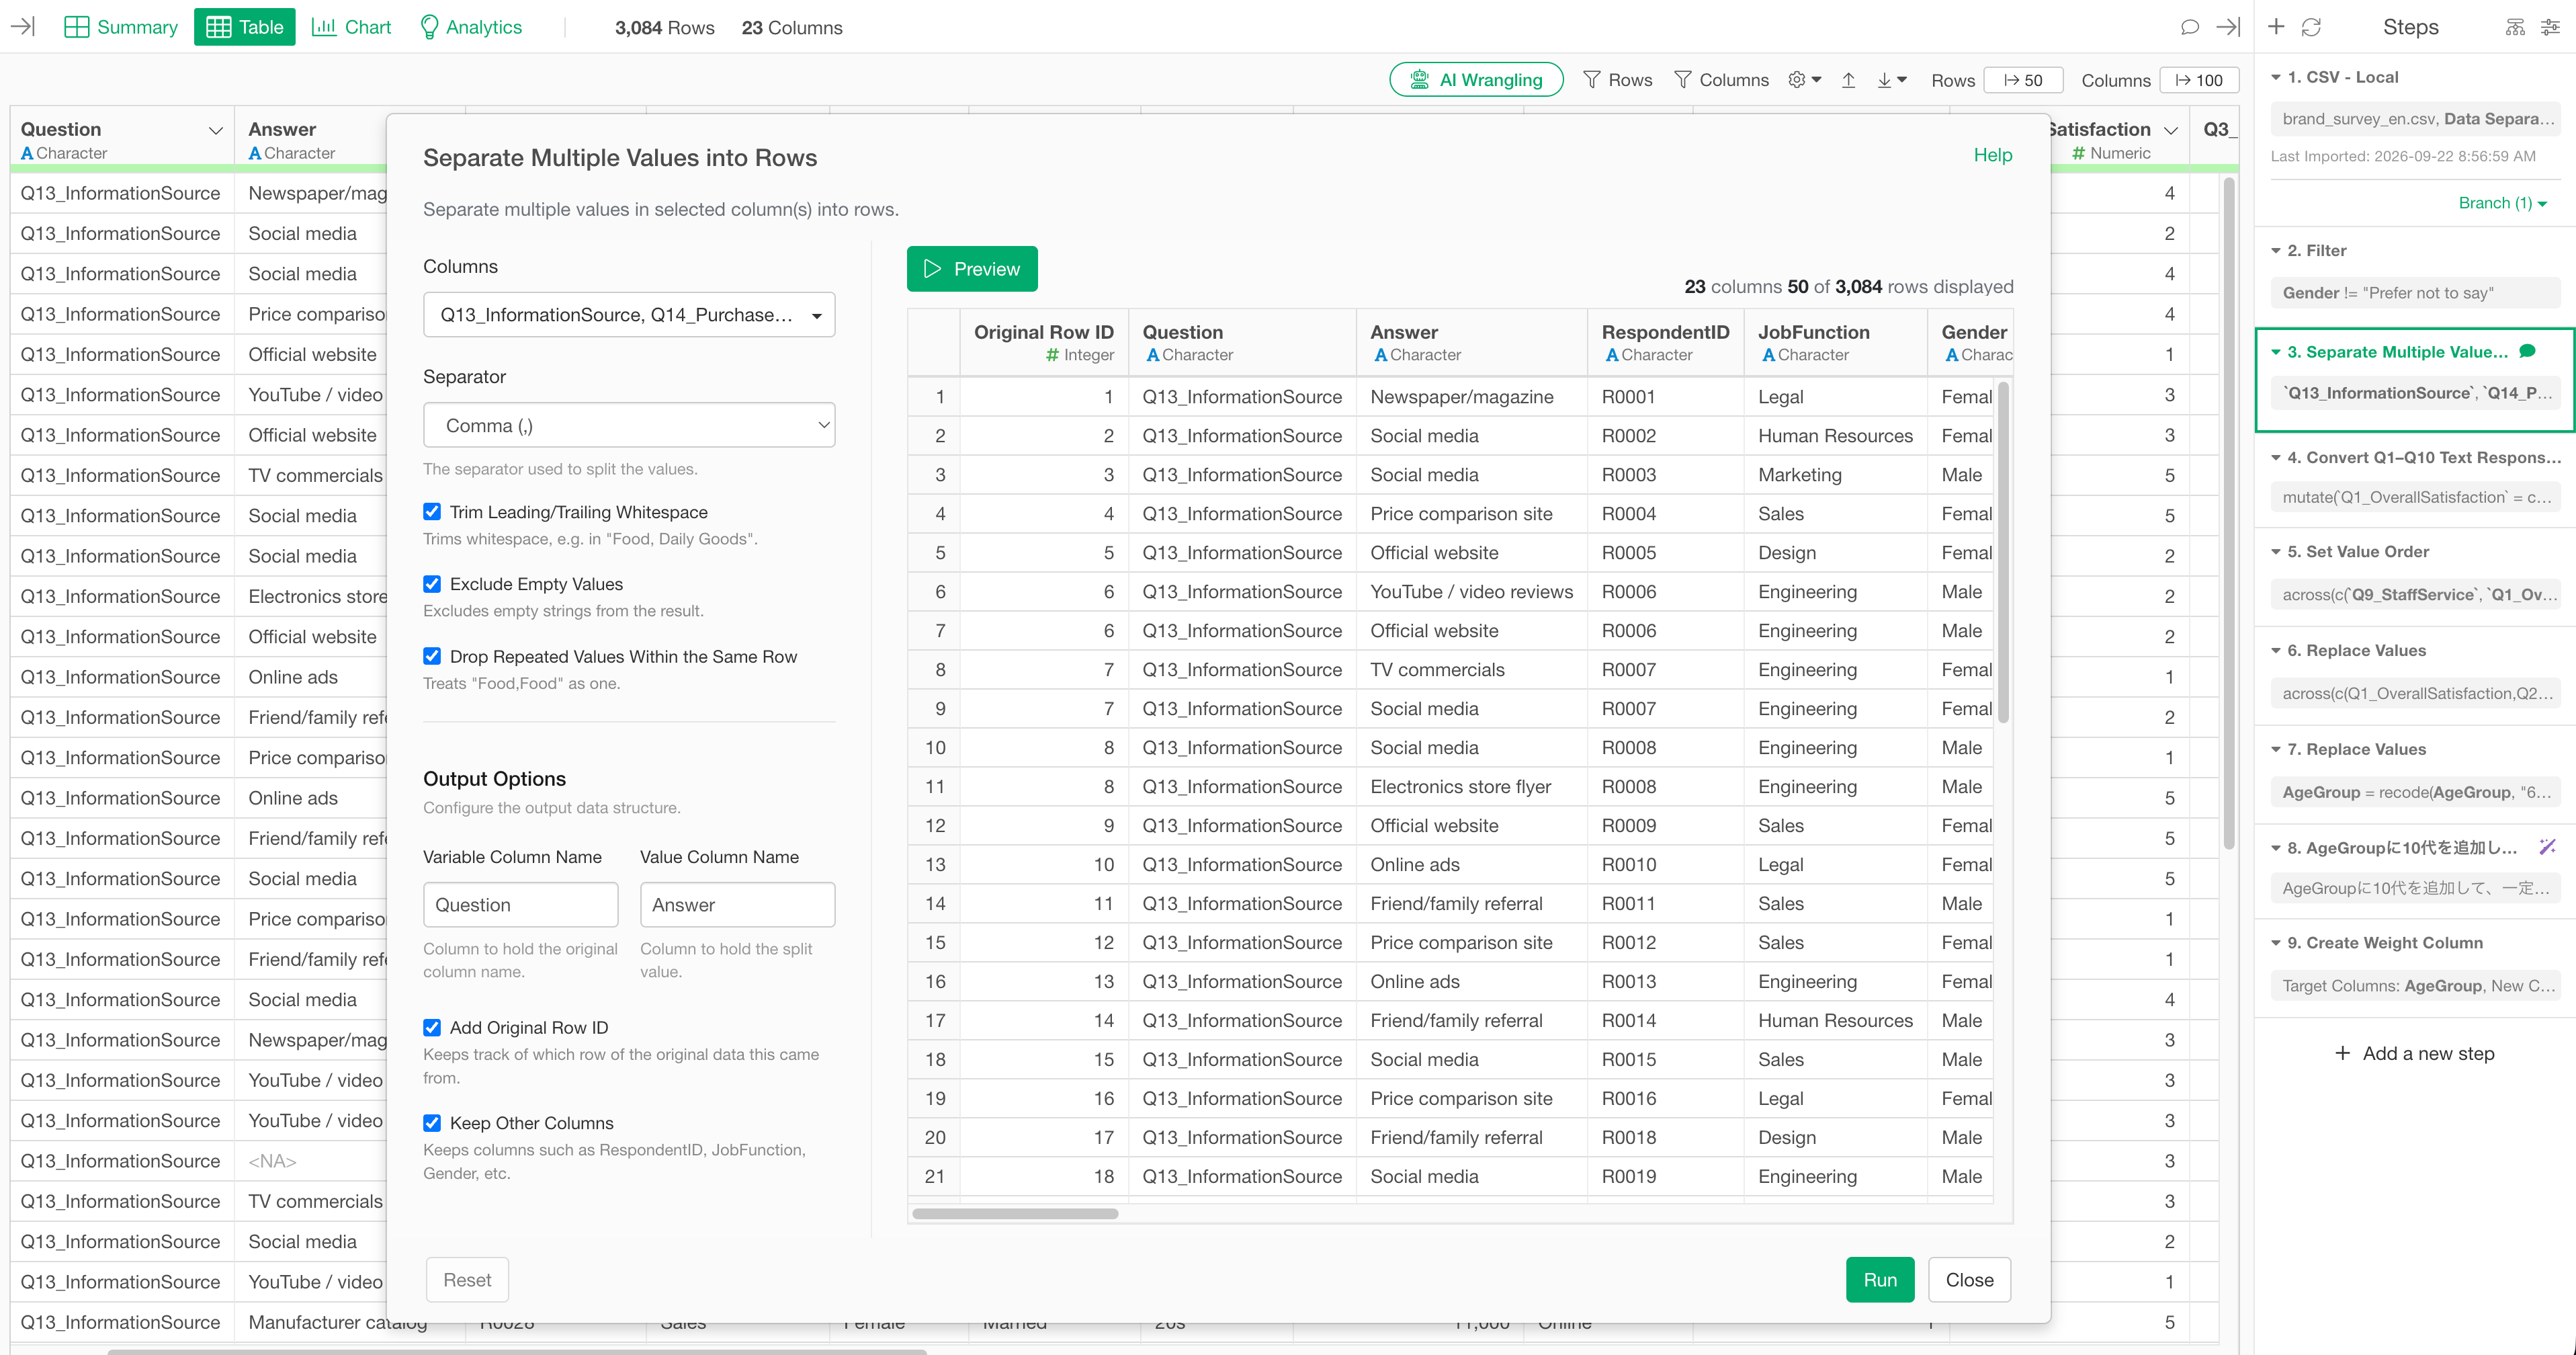
Standardize question names, response values, and survey structures, and transform multiple-response and demographic data into analysis-ready formats.
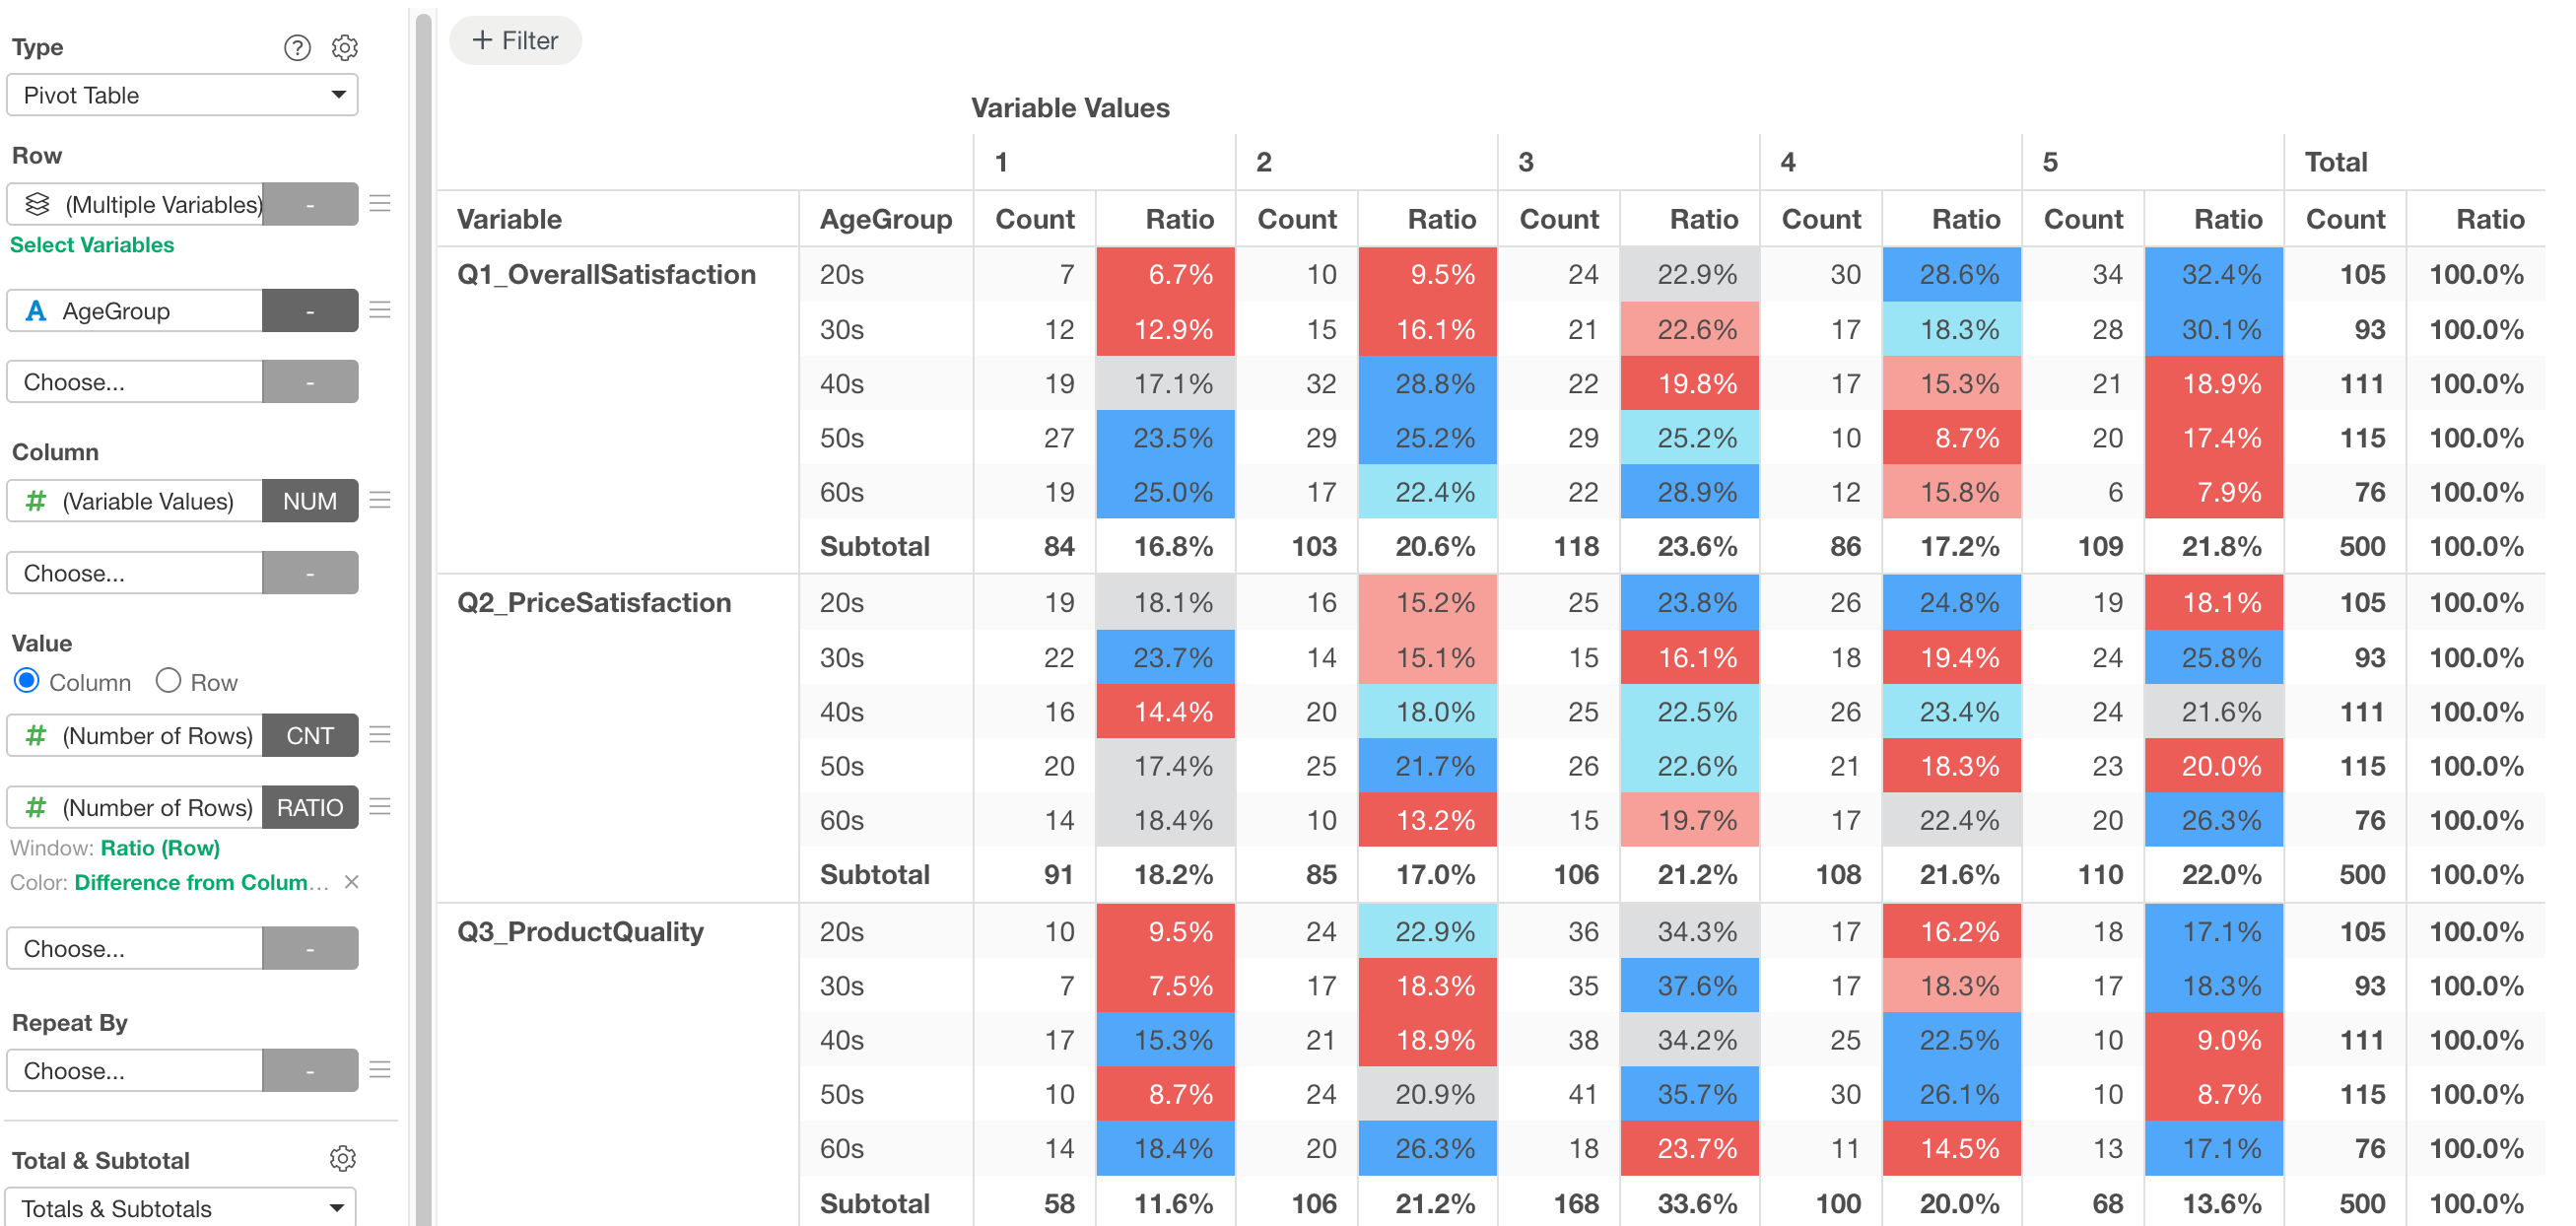
Build Summary Tables
Quickly create toplines and crosstabs while preserving them as reusable, refreshable analysis steps instead of one-time manual work.
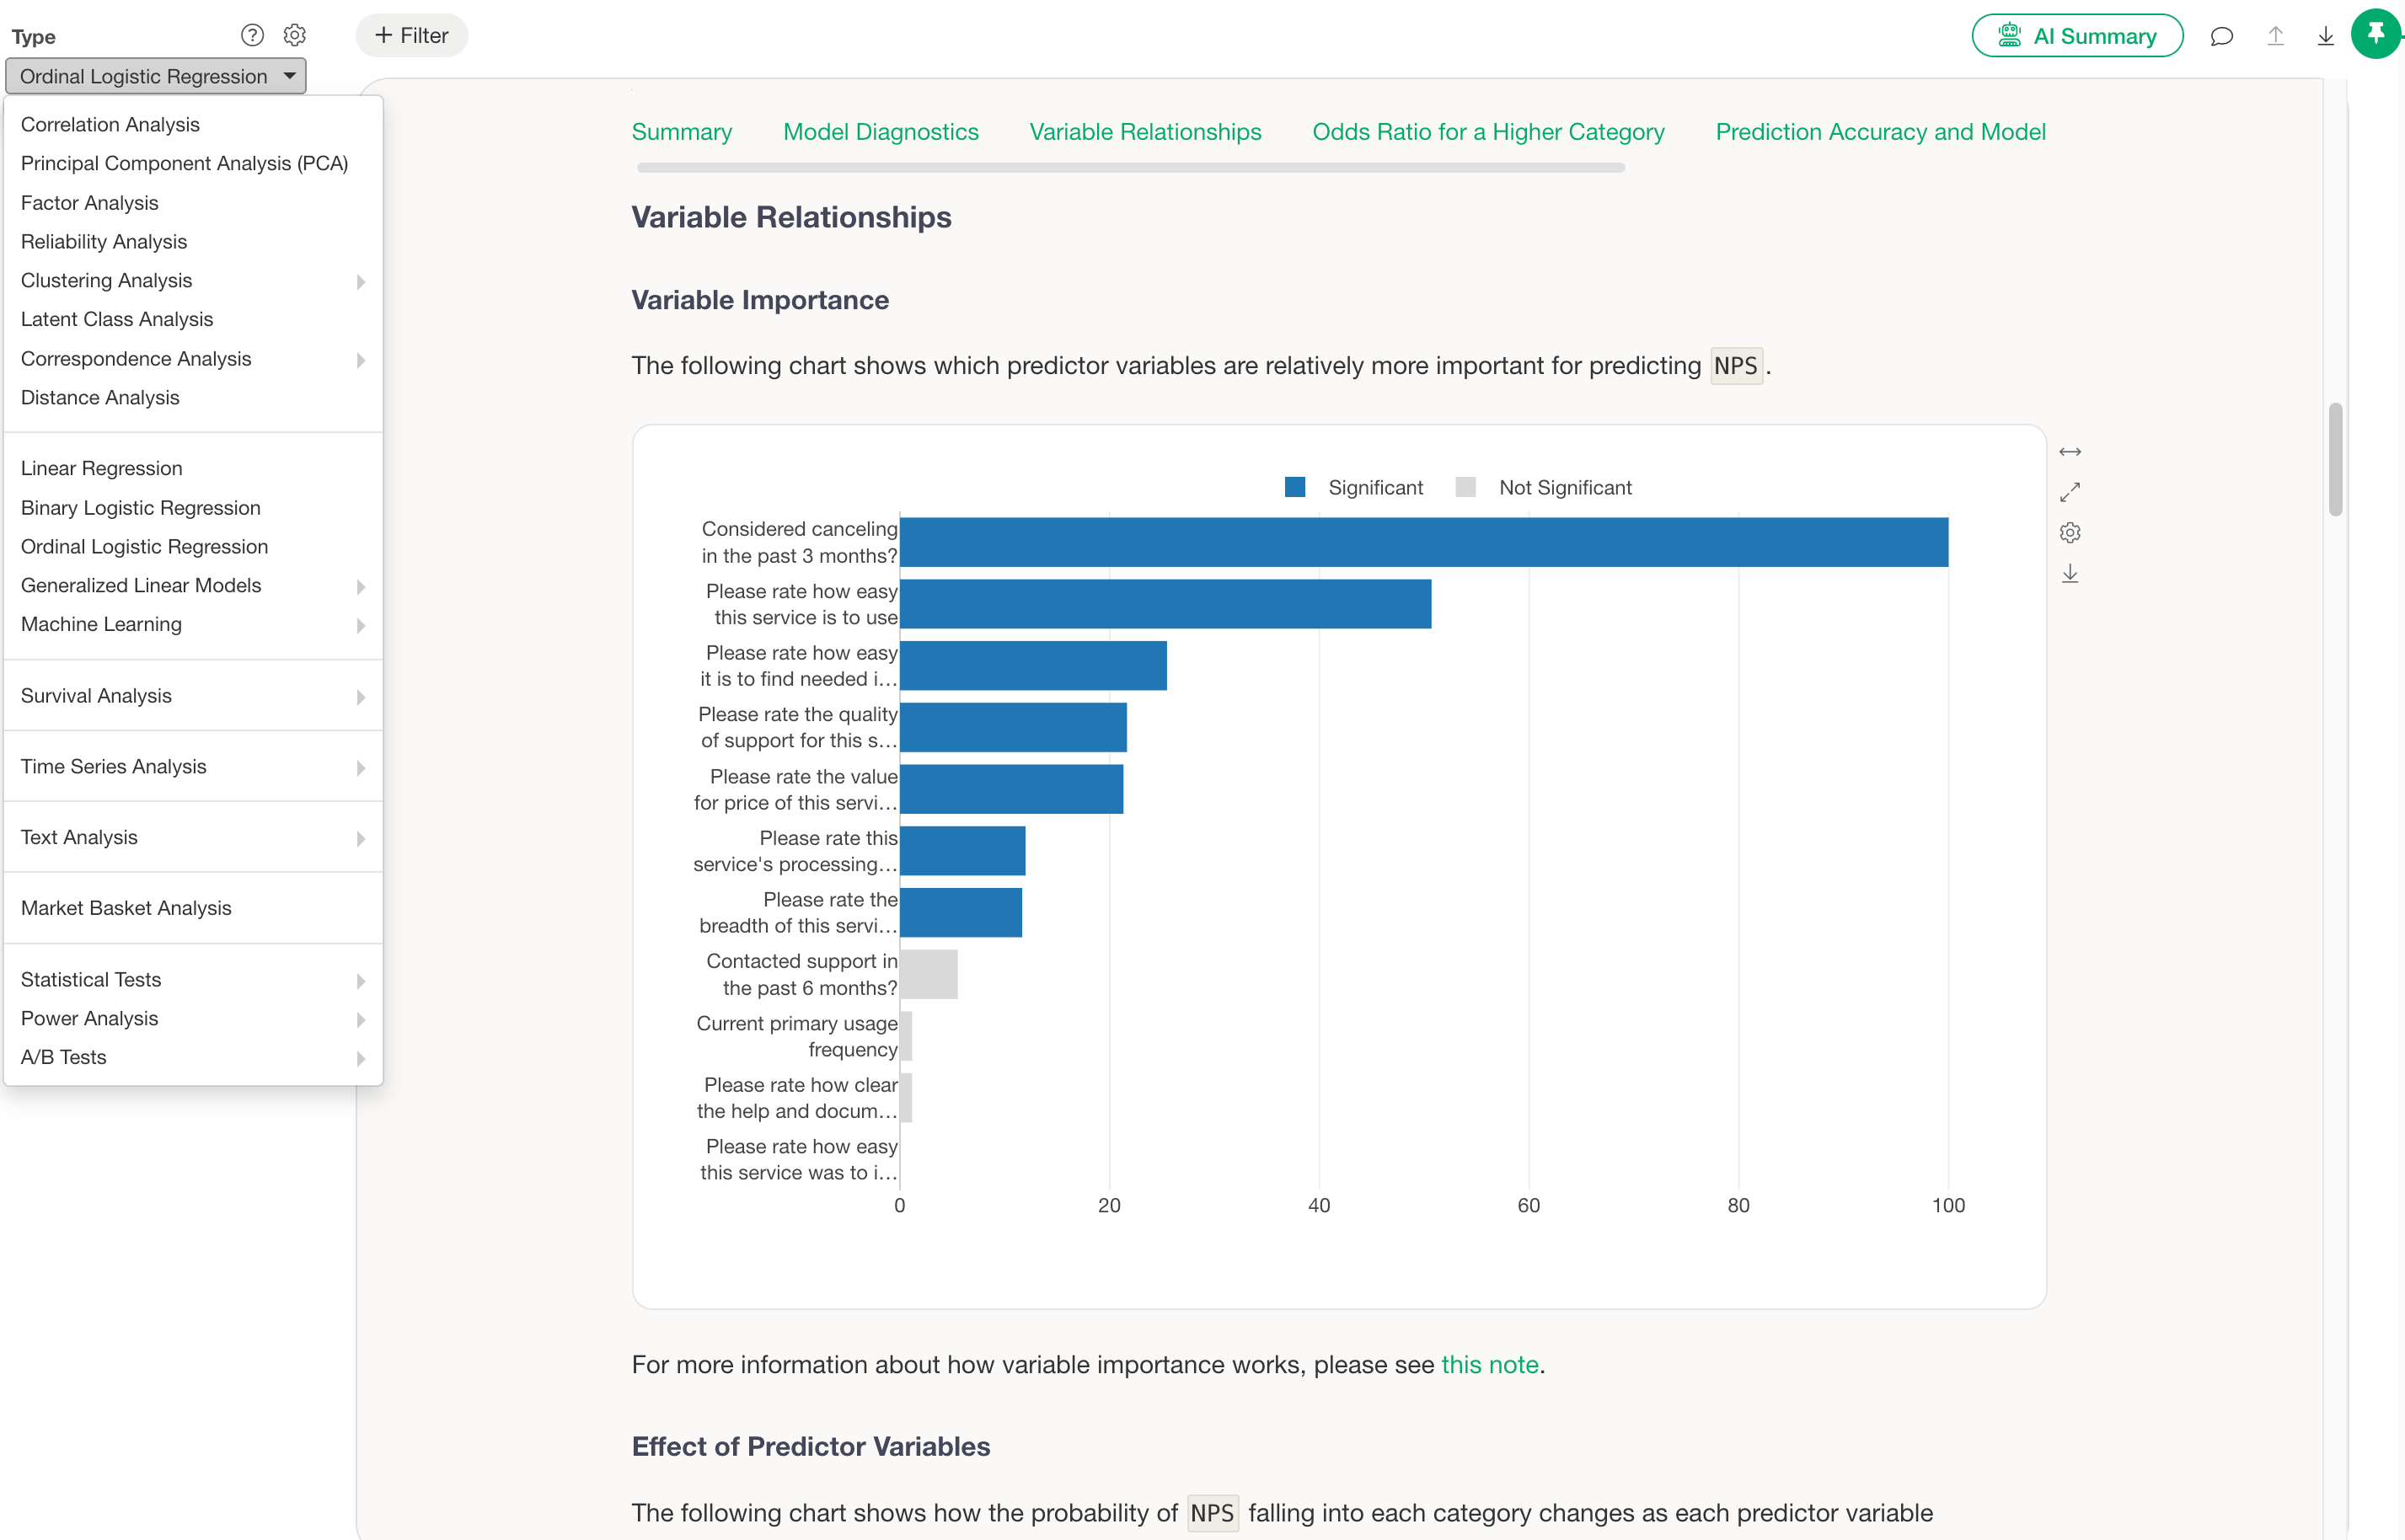
Analyze
Once you understand the overall response patterns, move directly into significance testing and deeper analysis to identify the factors behind those patterns.
Analyze Response Text with AI
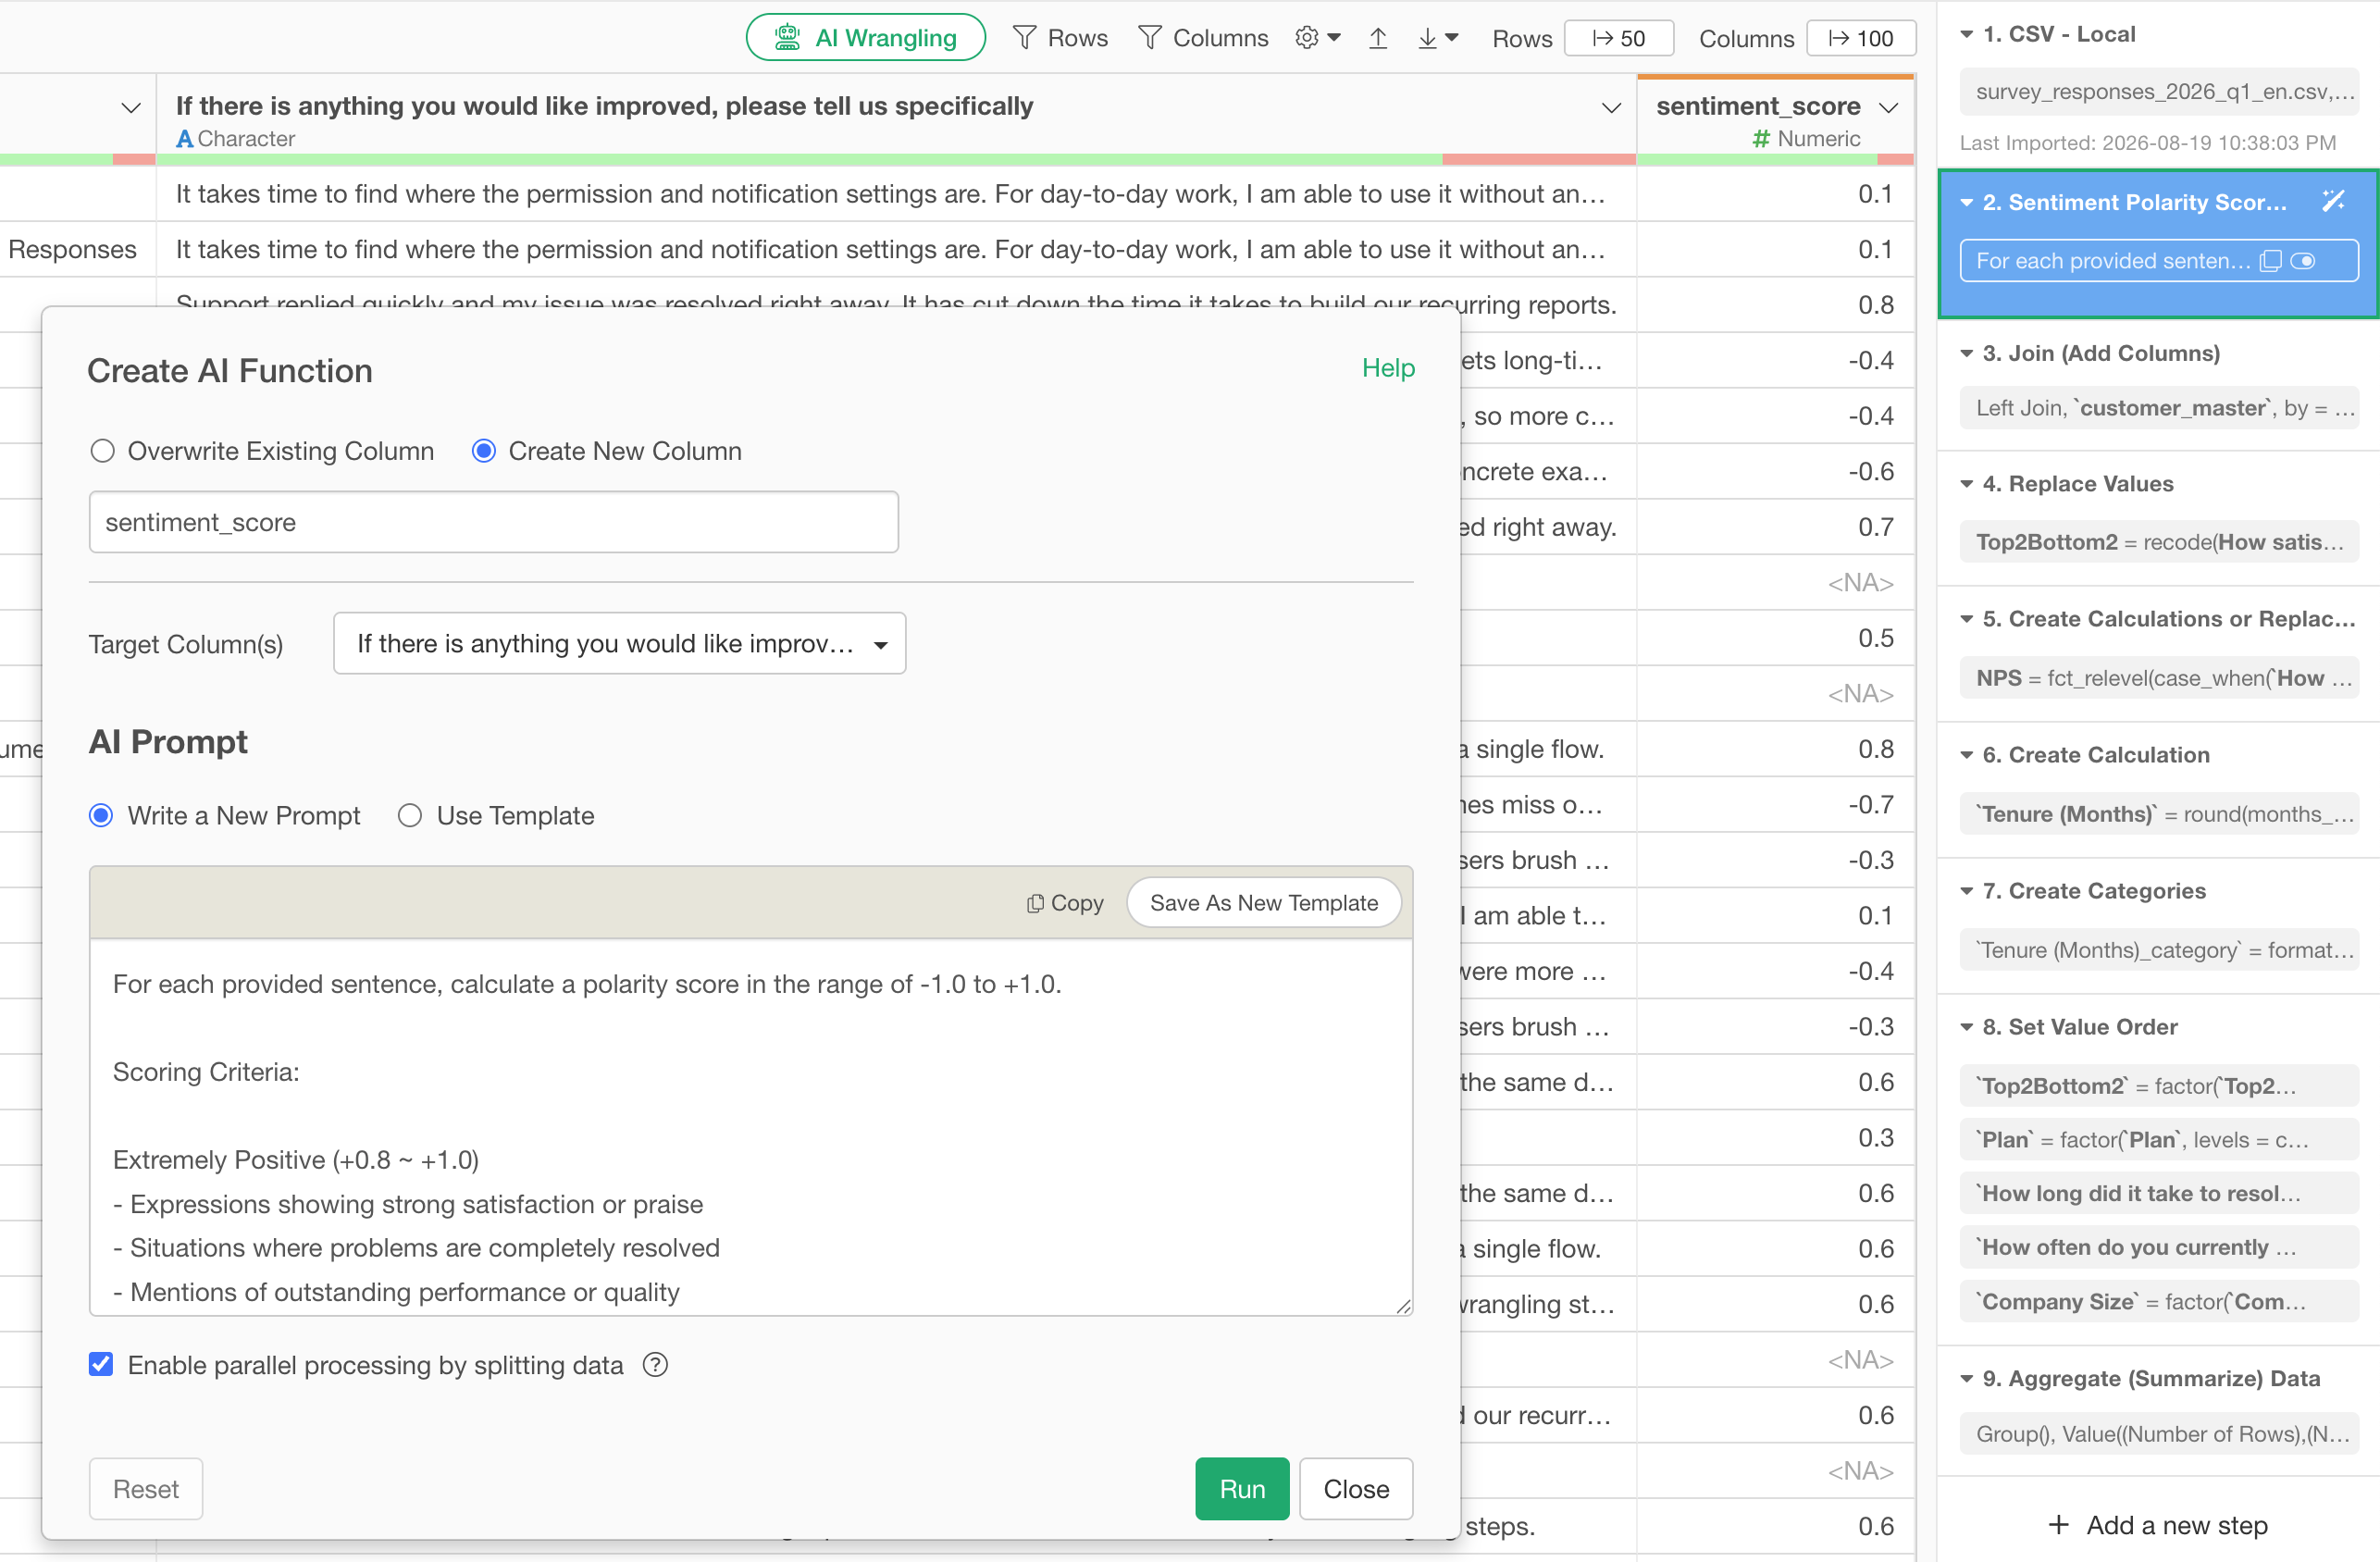
Instead of manually reading and coding every response, use AI to summarize comments, identify themes, classify responses, and analyze sentiment.
Create Reports
Bring your analysis together with charts, tables, and narrative, and share the results as reports, dashboards, or Excel outputs—all within the same project.
Build survey crosstabs faster and more flexibly.
Exploratory supports the summaries and tables commonly used in survey research, including topline tables, crosstabs, multiple-response analysis, Top 2 Box, survey weighting, and Excel output.
Because the data preparation steps and calculation logic are preserved as part of the workflow, you can rerun the same analysis when new data arrives—without rebuilding everything from scratch.
Topline Tables
Quickly review response distributions and overall patterns across survey questions, including counts and percentages.
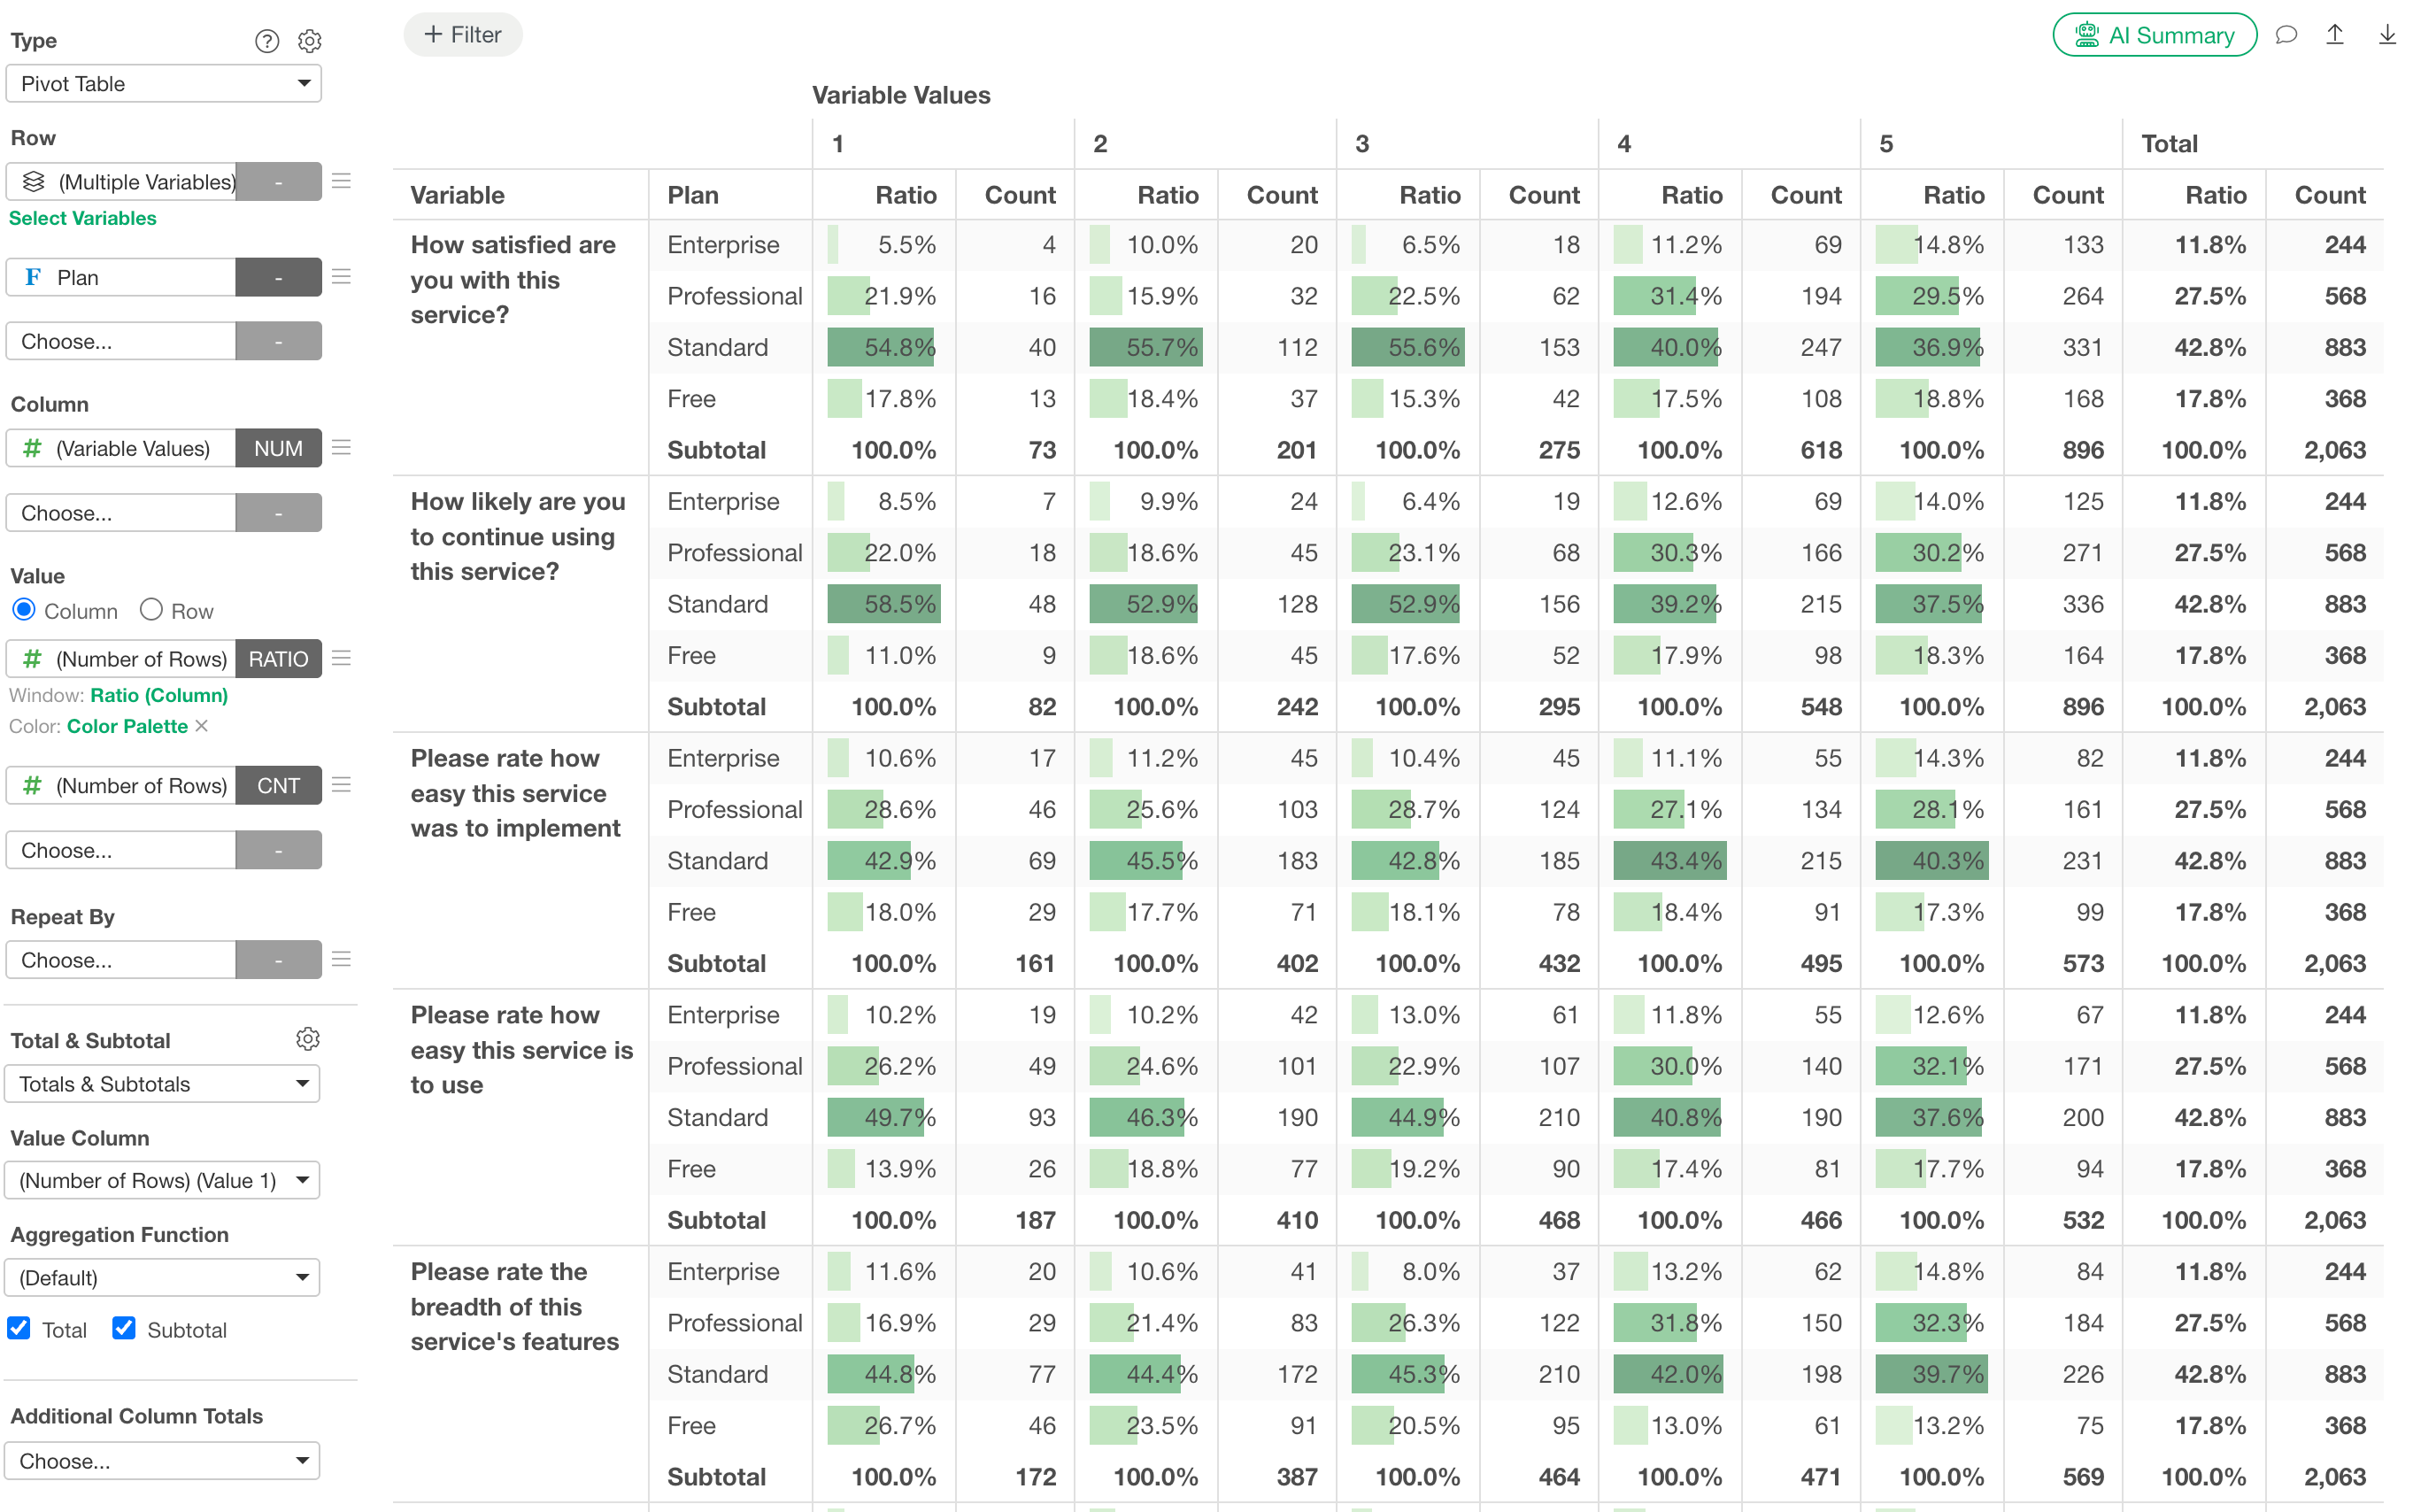
Crosstabs
Compare responses across demographics, customer segments, or other groups to quickly identify where meaningful differences appear.
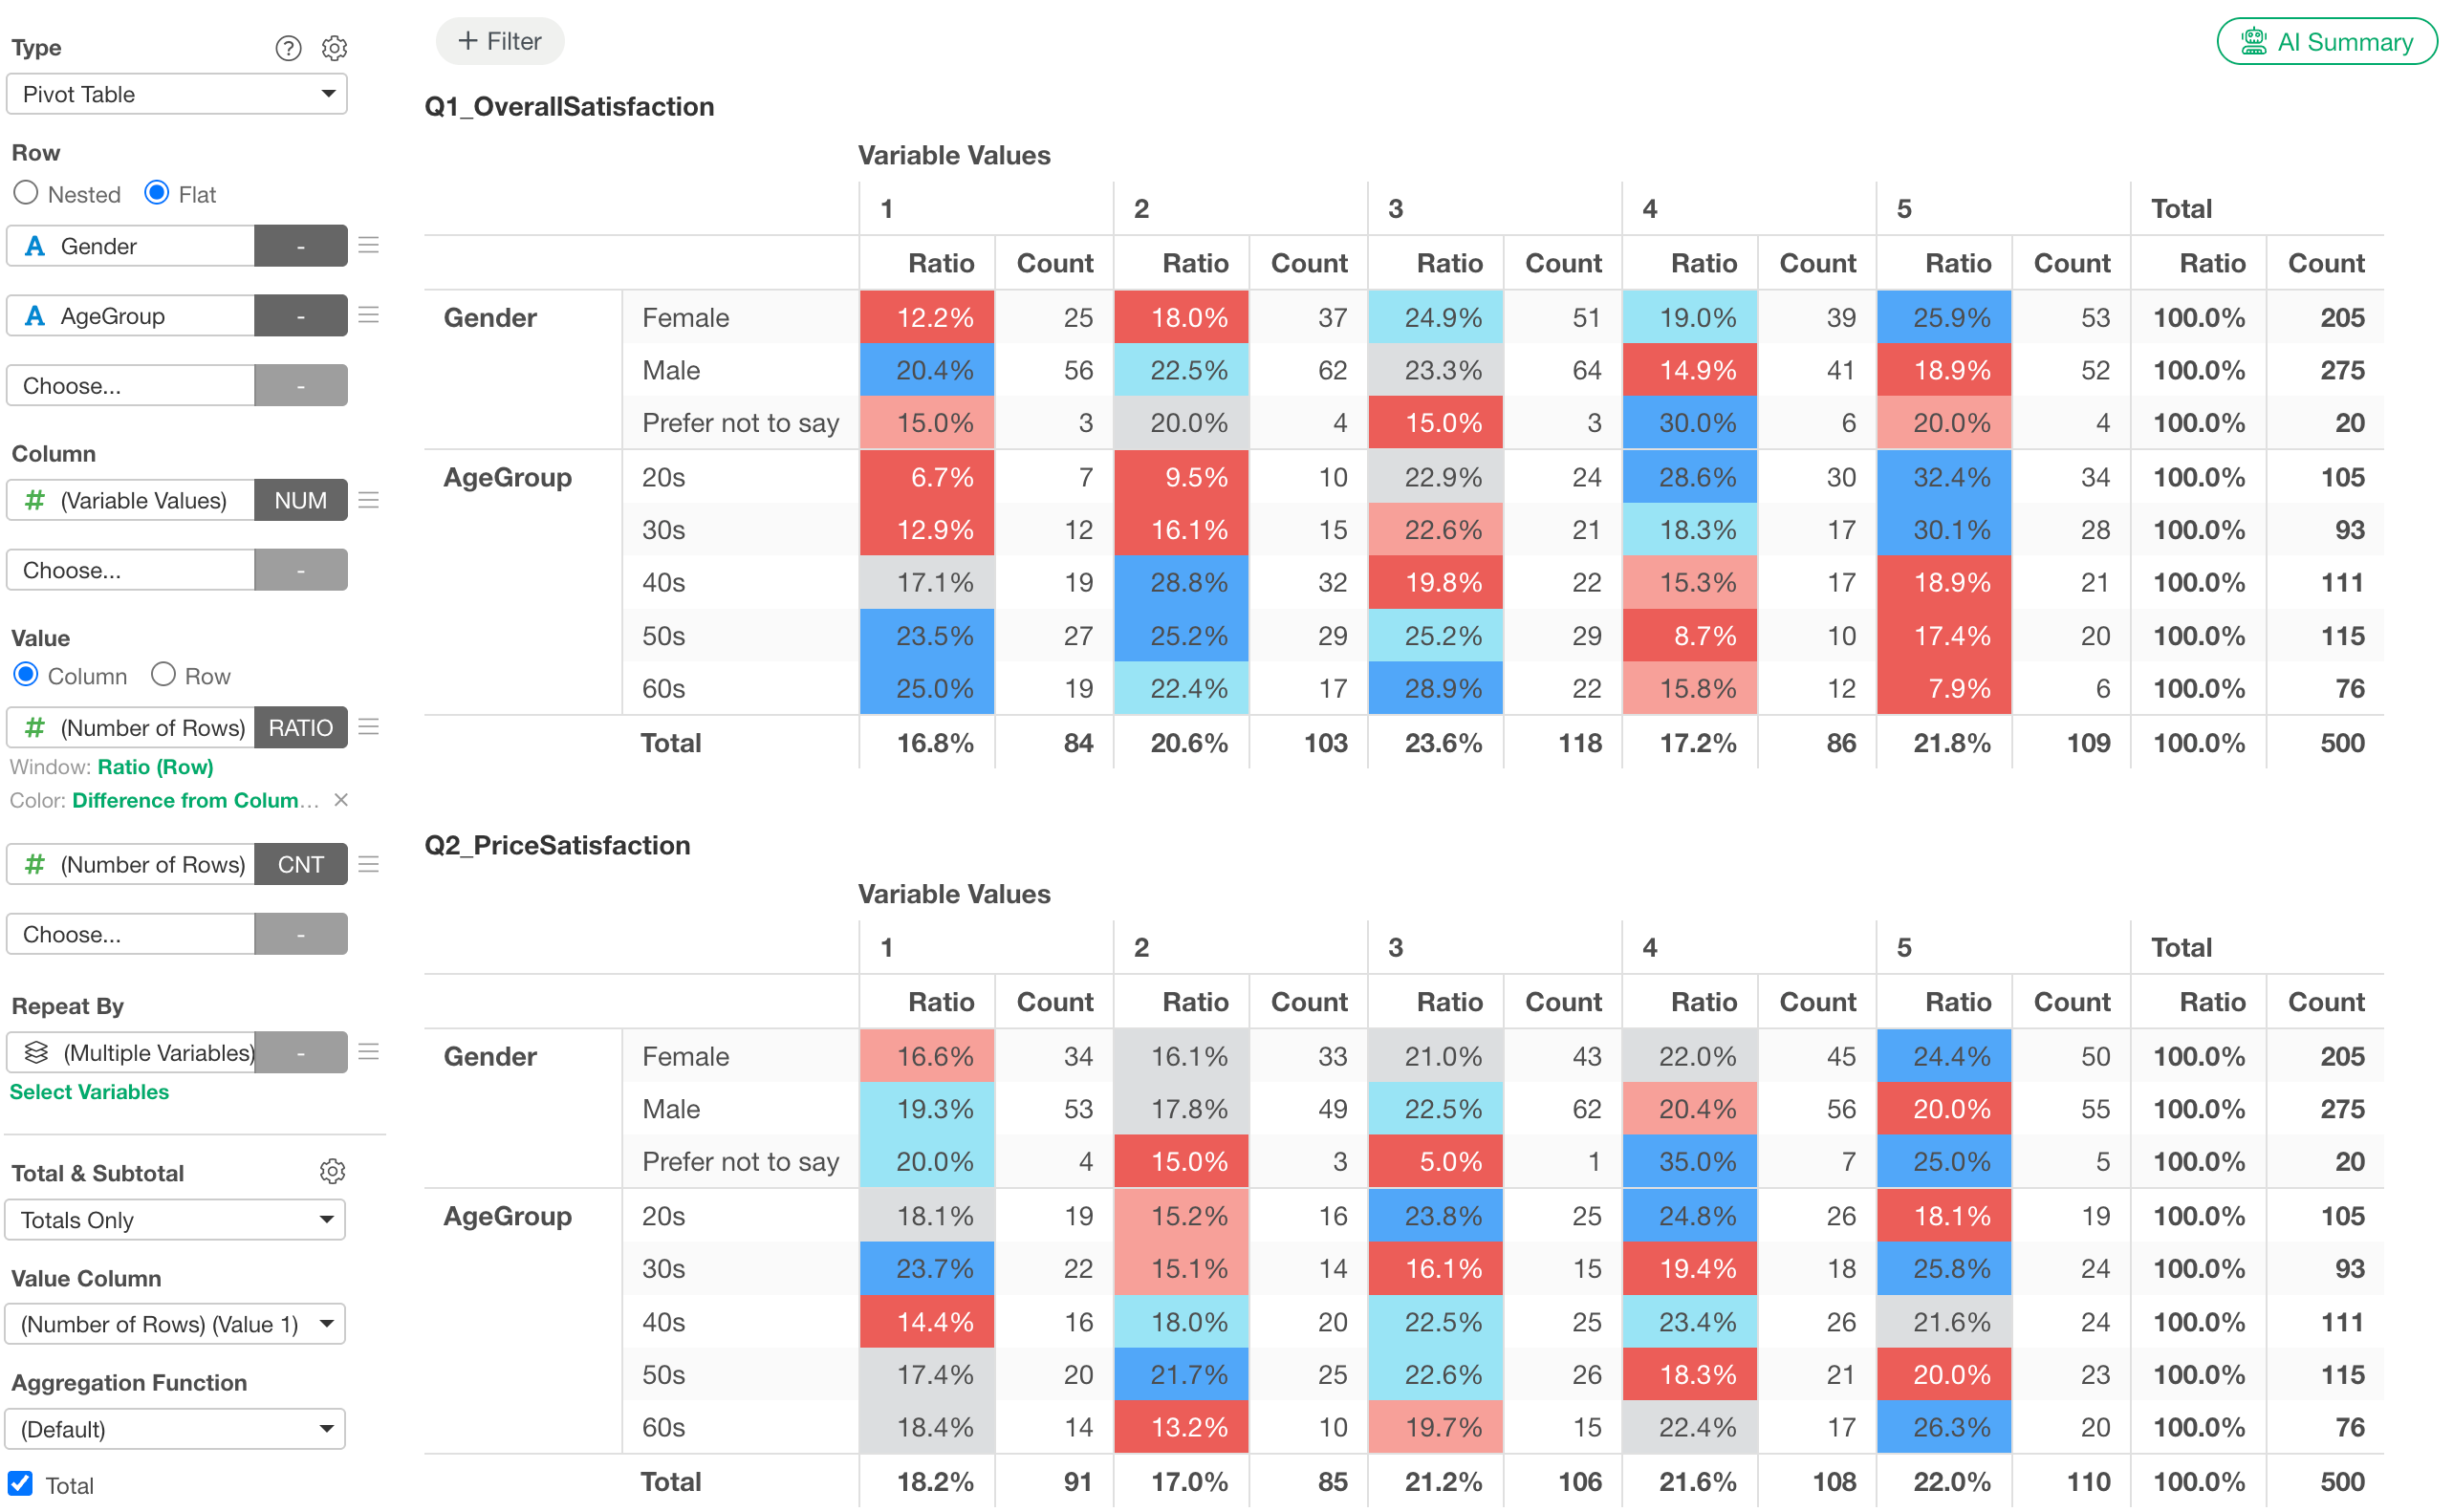
Multiple-Response Analysis
Analyze “select all that apply” and other multiple-response questions using consistent respondent-based or response-based calculations.
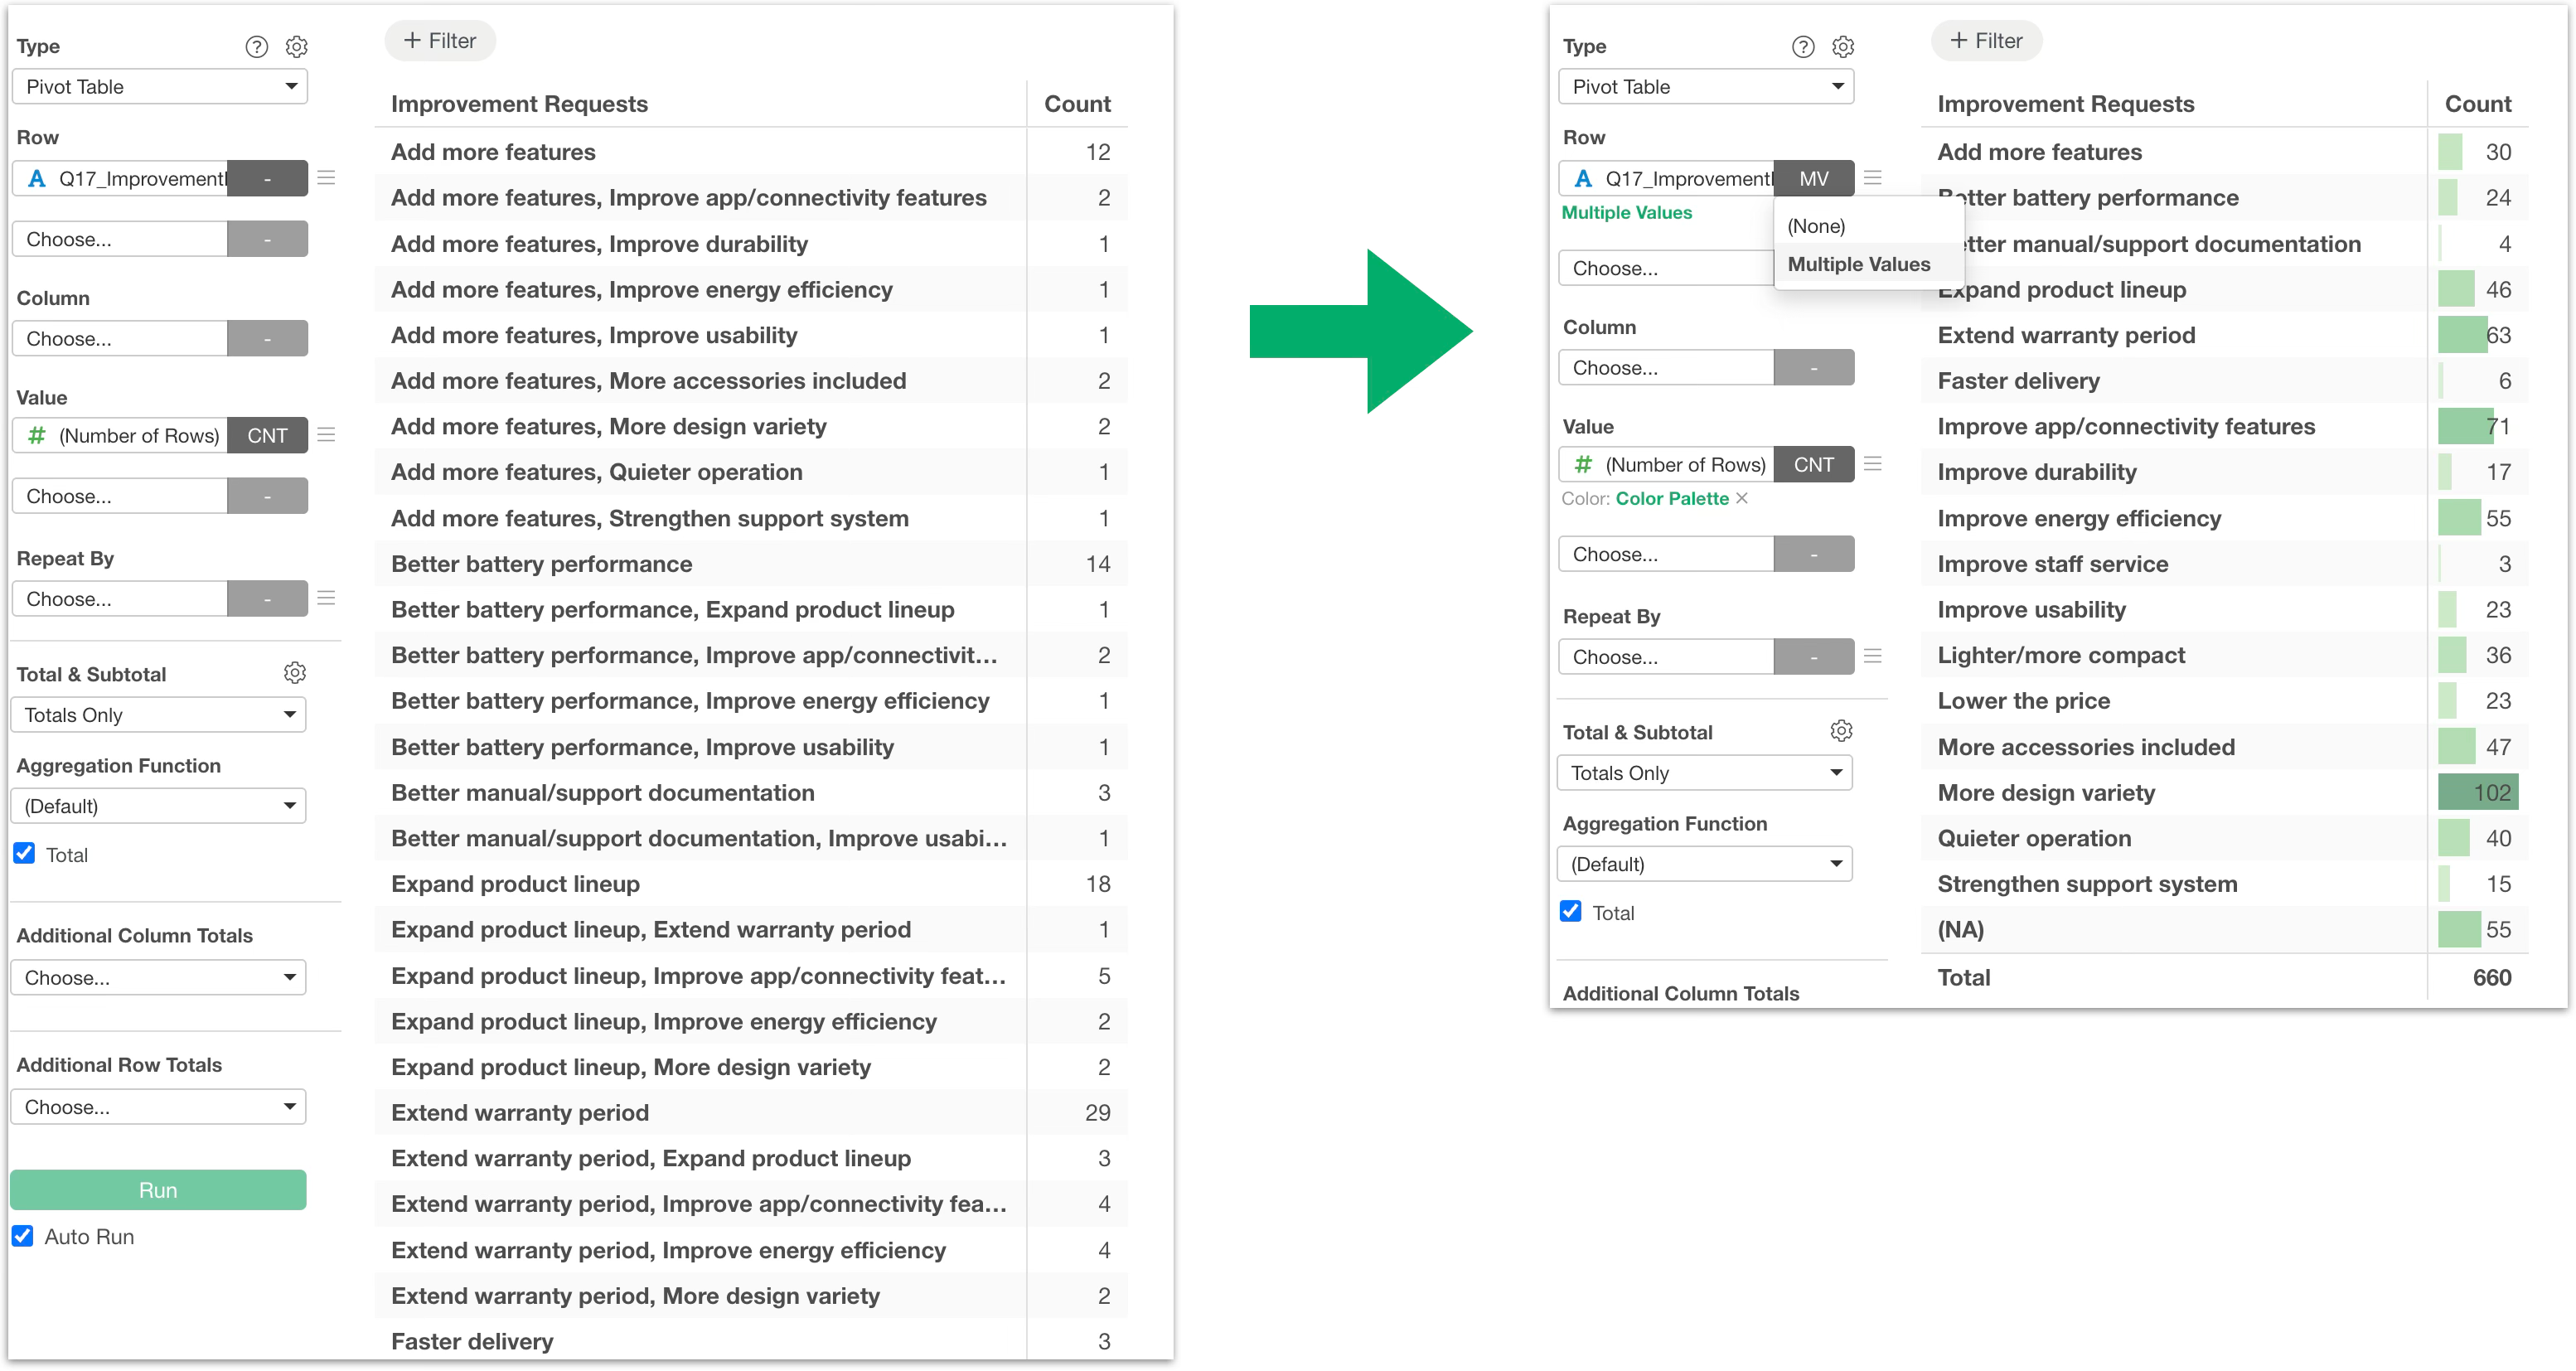
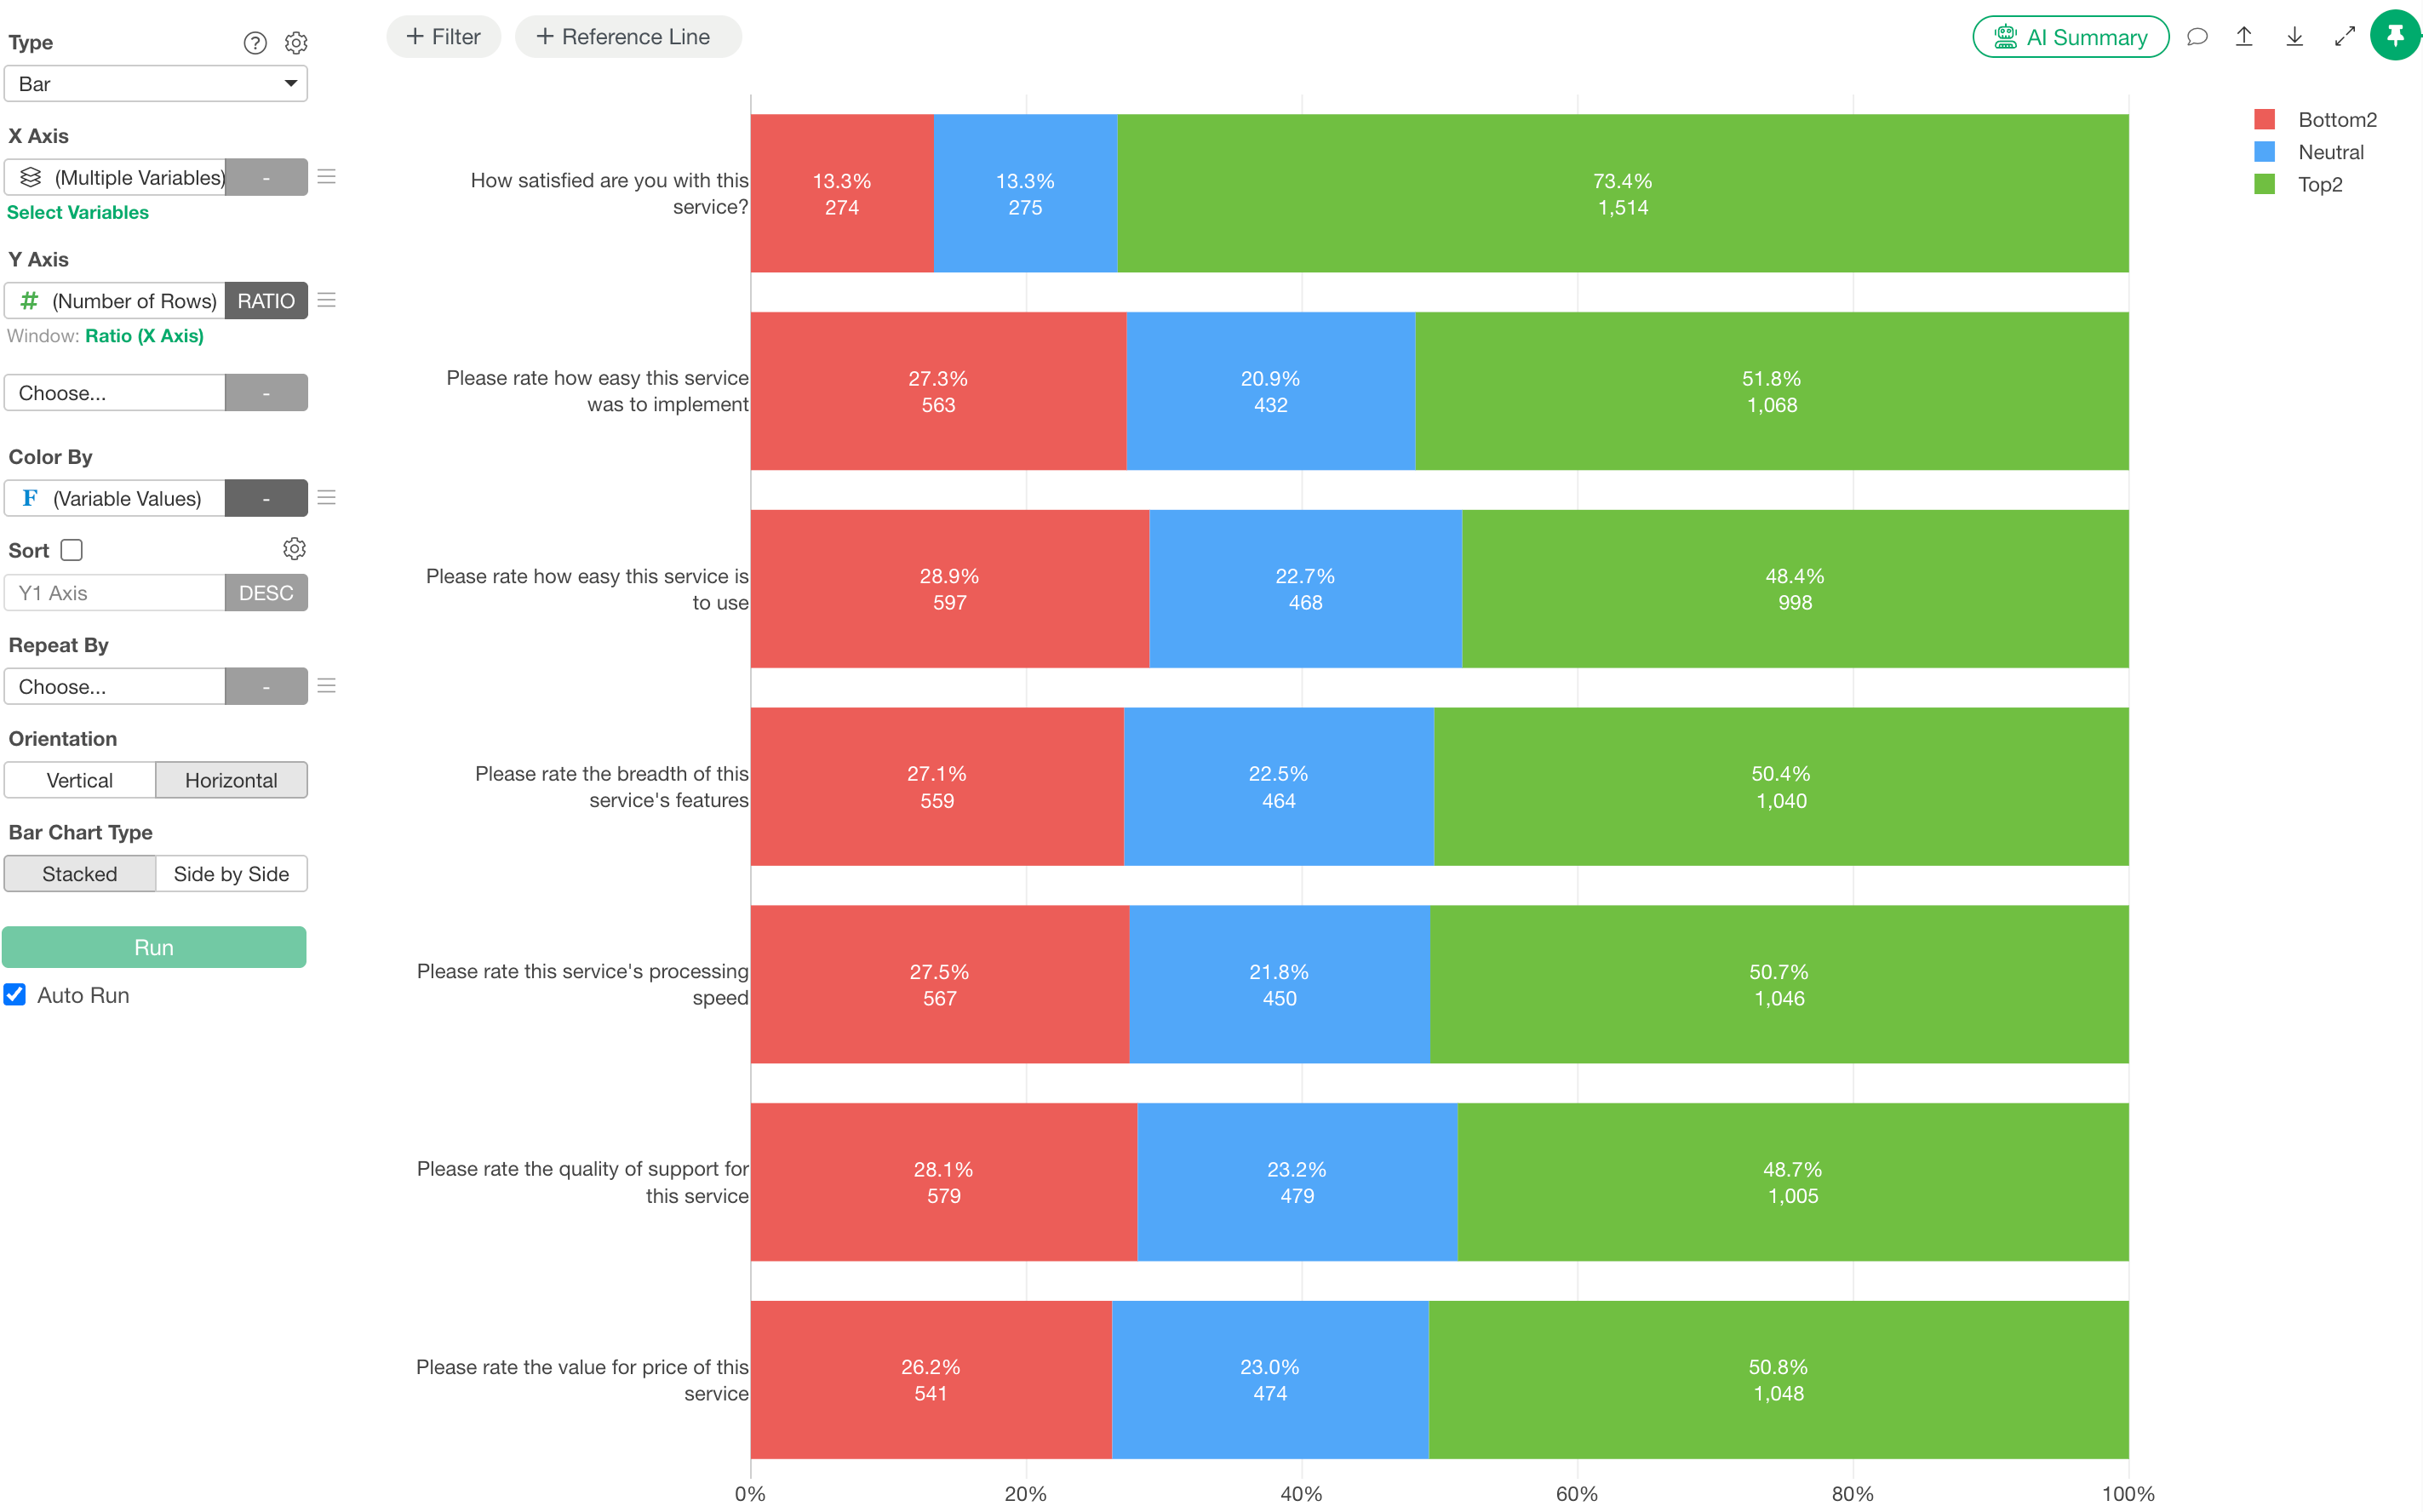
Top 2 Box / Bottom 2 Box
Go beyond individual rating categories by combining the highest or lowest responses into metrics such as Top 2 Box, Bottom 2 Box, and Net scores.
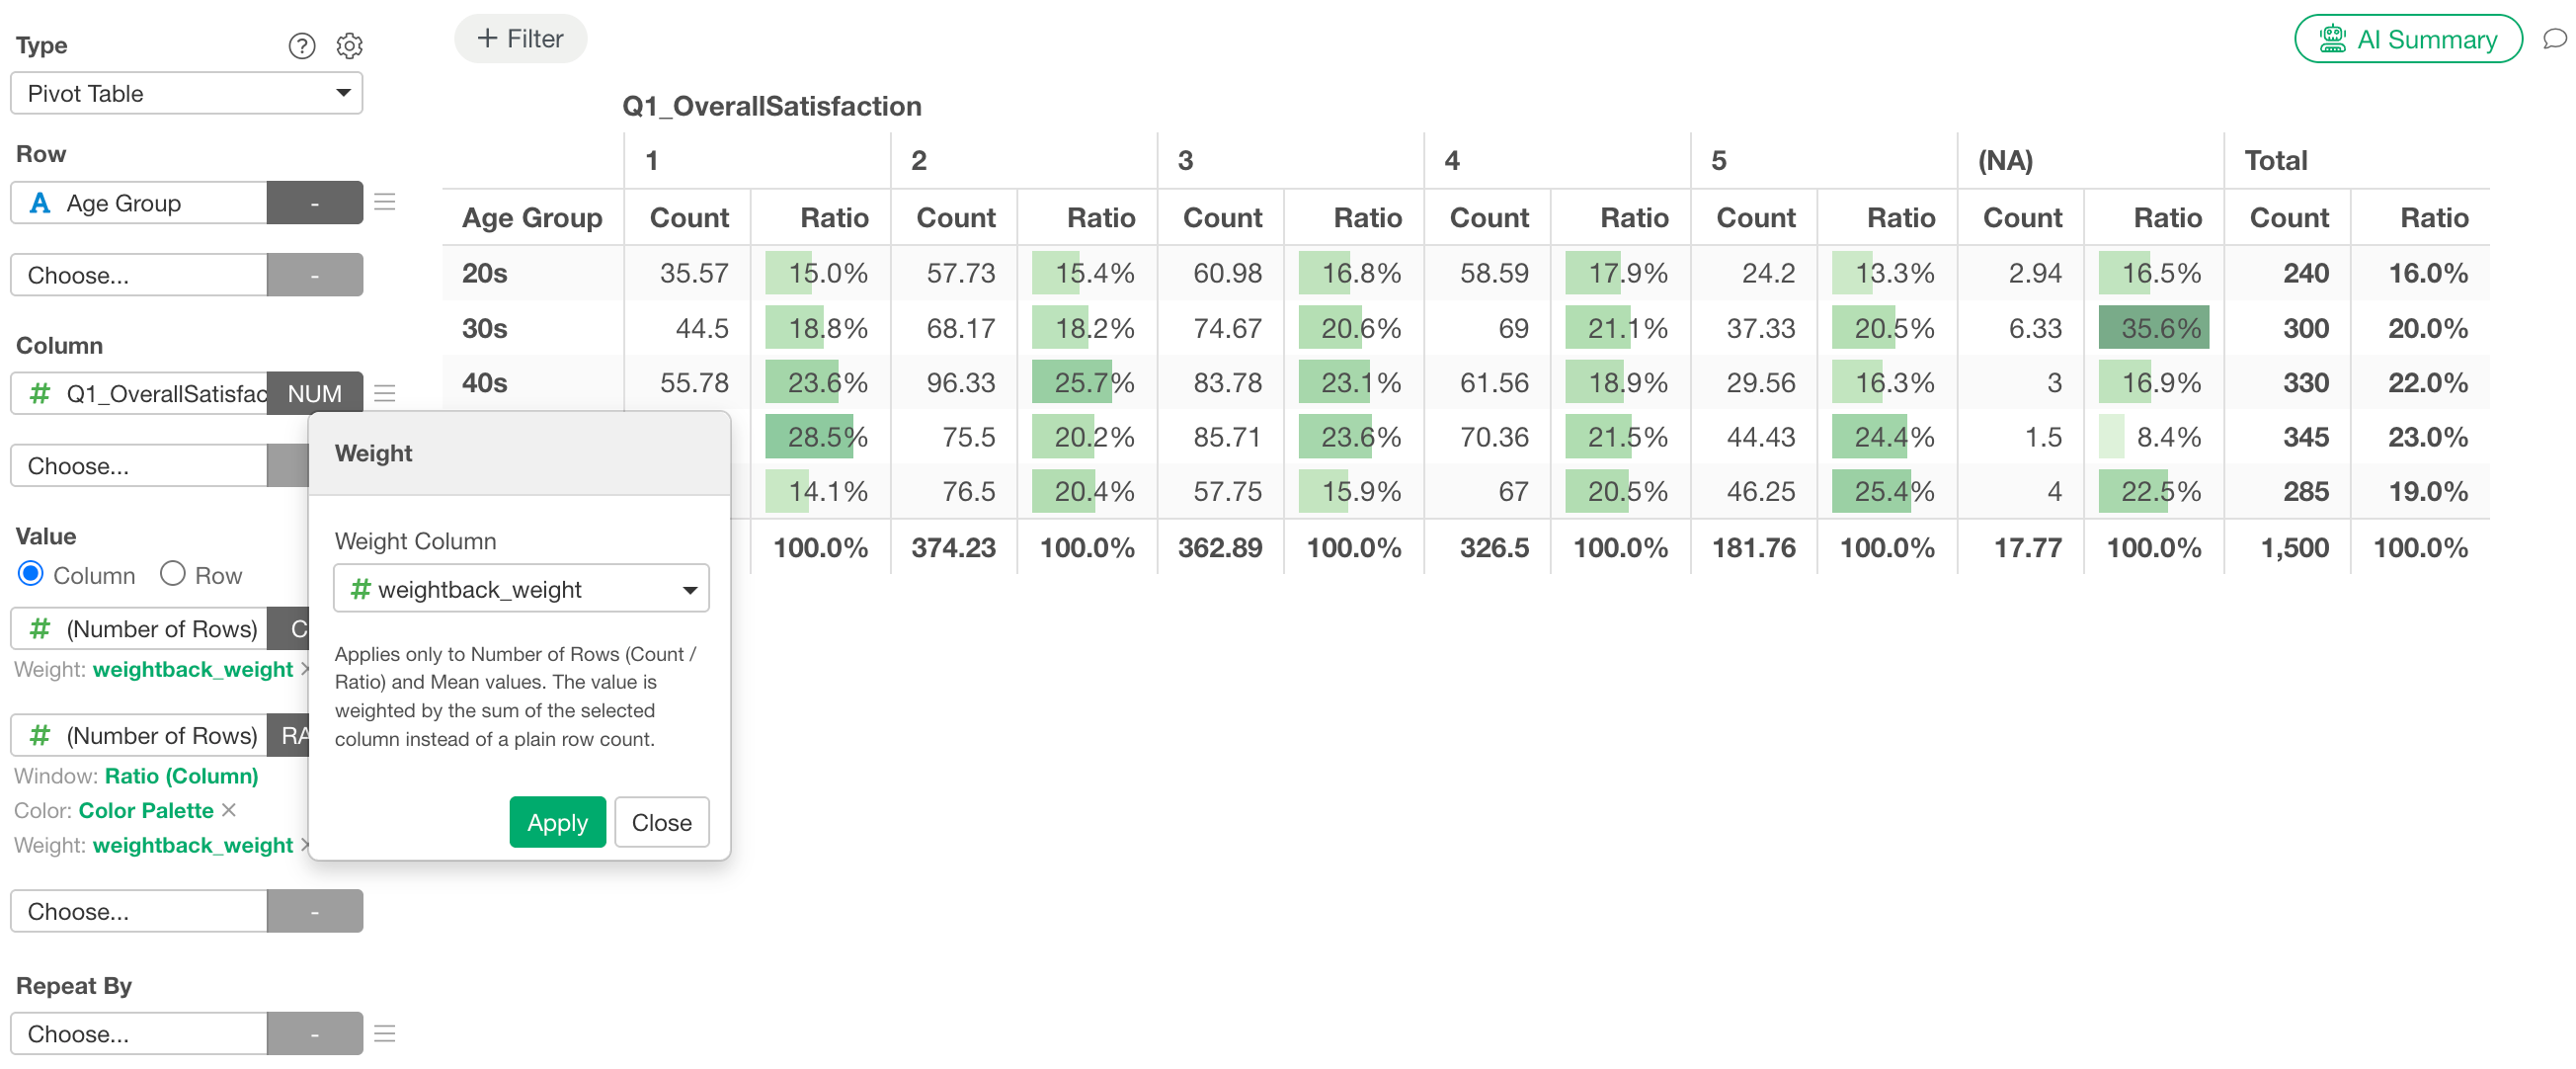
Survey Weighting
Adjust for differences between your sample and the target population to produce more representative survey estimates.
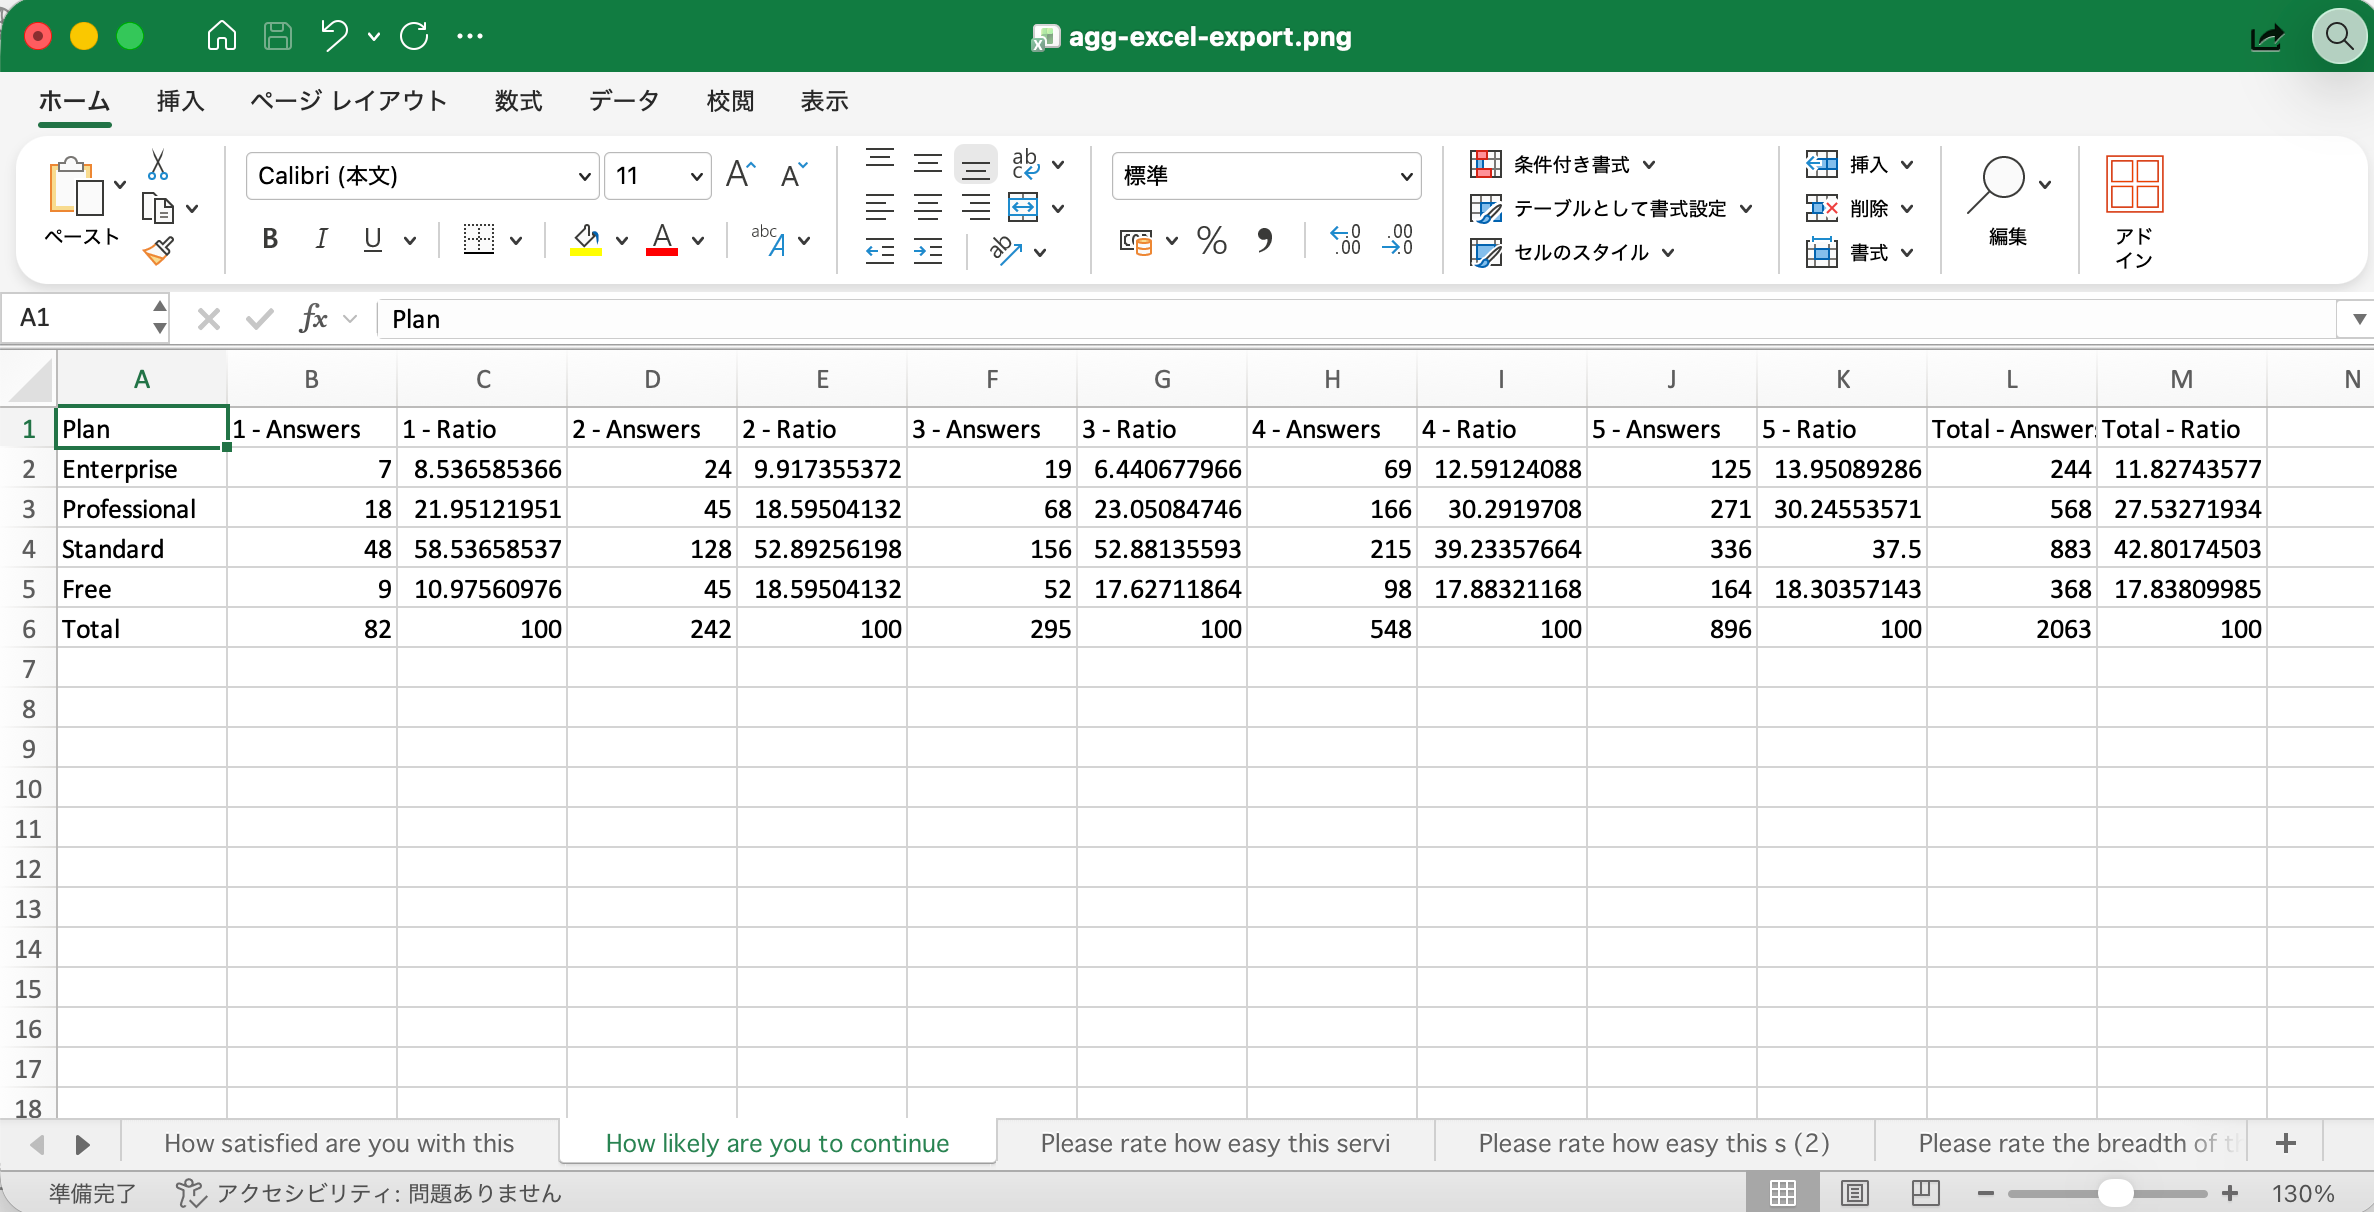
Excel Output
Export survey tables to Excel when your team or clients still rely on Excel-based reporting and delivery workflows.
Turn survey-specific data preparation into reusable steps.
Survey data often requires significant preparation before analysis. Multiple-response questions, matrix questions, Likert scales, open-ended responses, skipped questions, demographic variables, and inconsistent labels all create additional work before analysis can begin.
With Exploratory, you can perform these tasks through the UI or with AI—and preserve every transformation as a reusable step in your workflow.
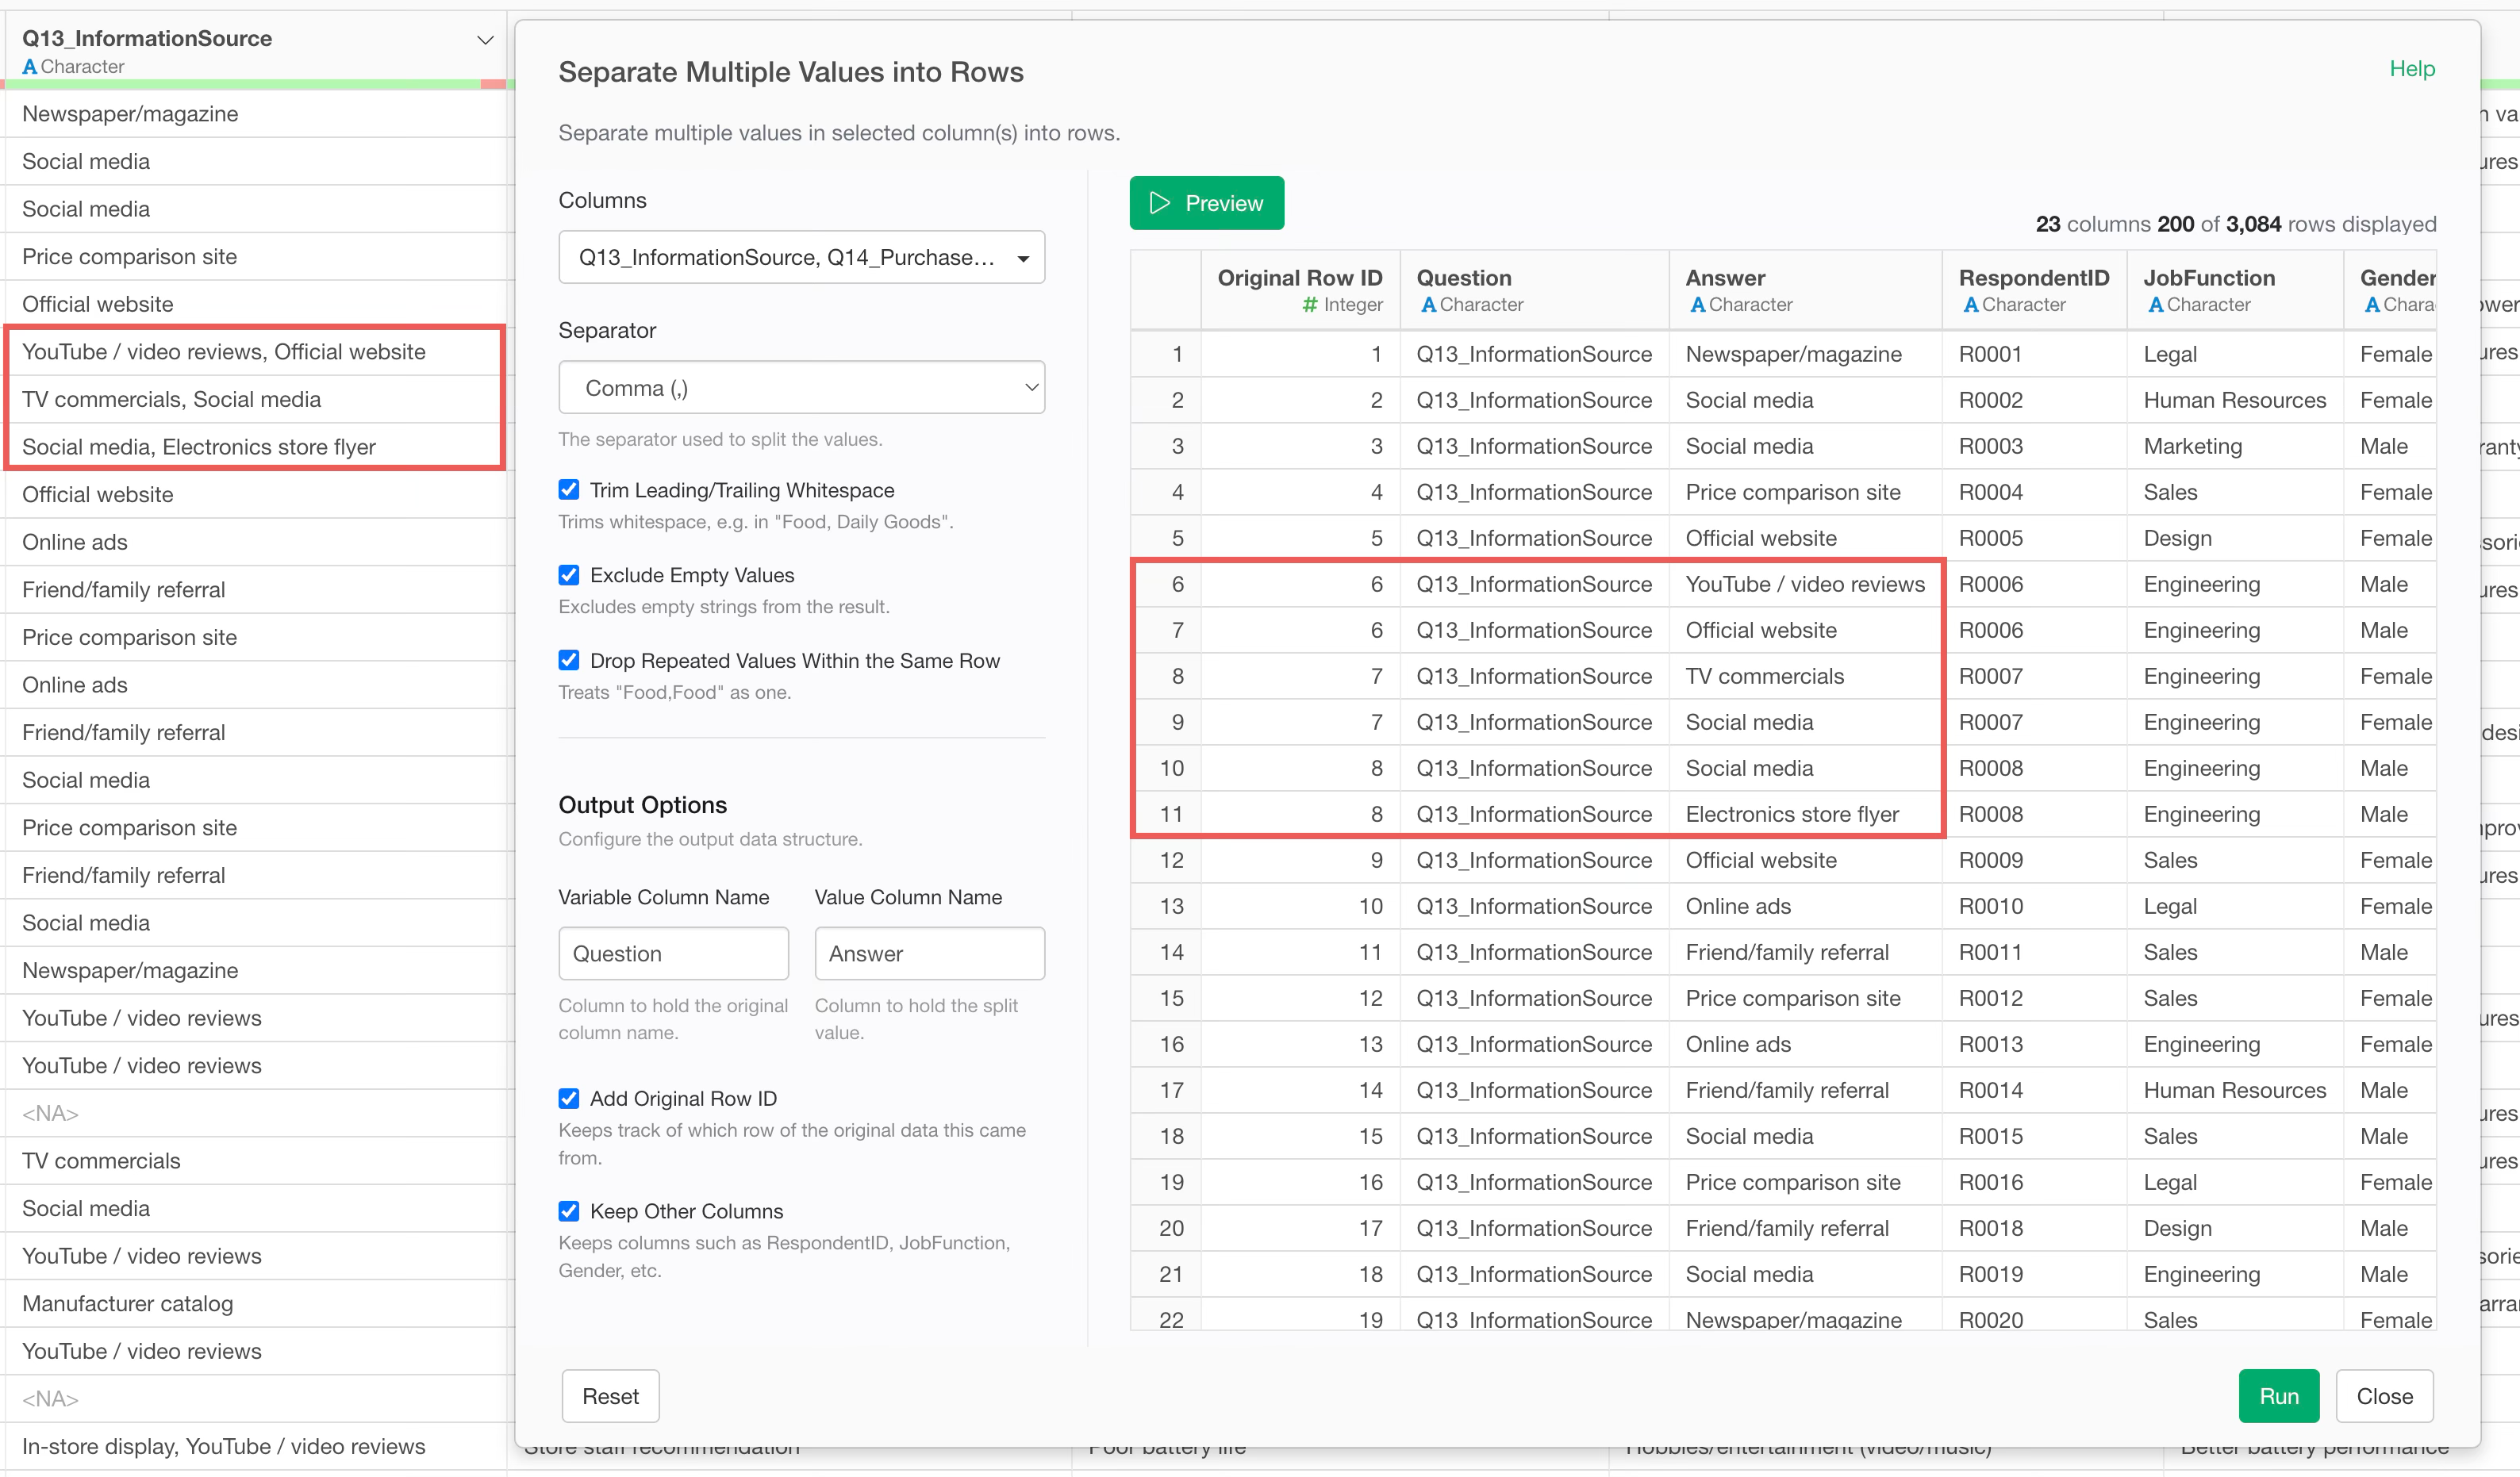
Prepare Multiple-Response Questions
Transform multiple-response questions into a structure that is easier to summarize, cross-tabulate, and analyze.
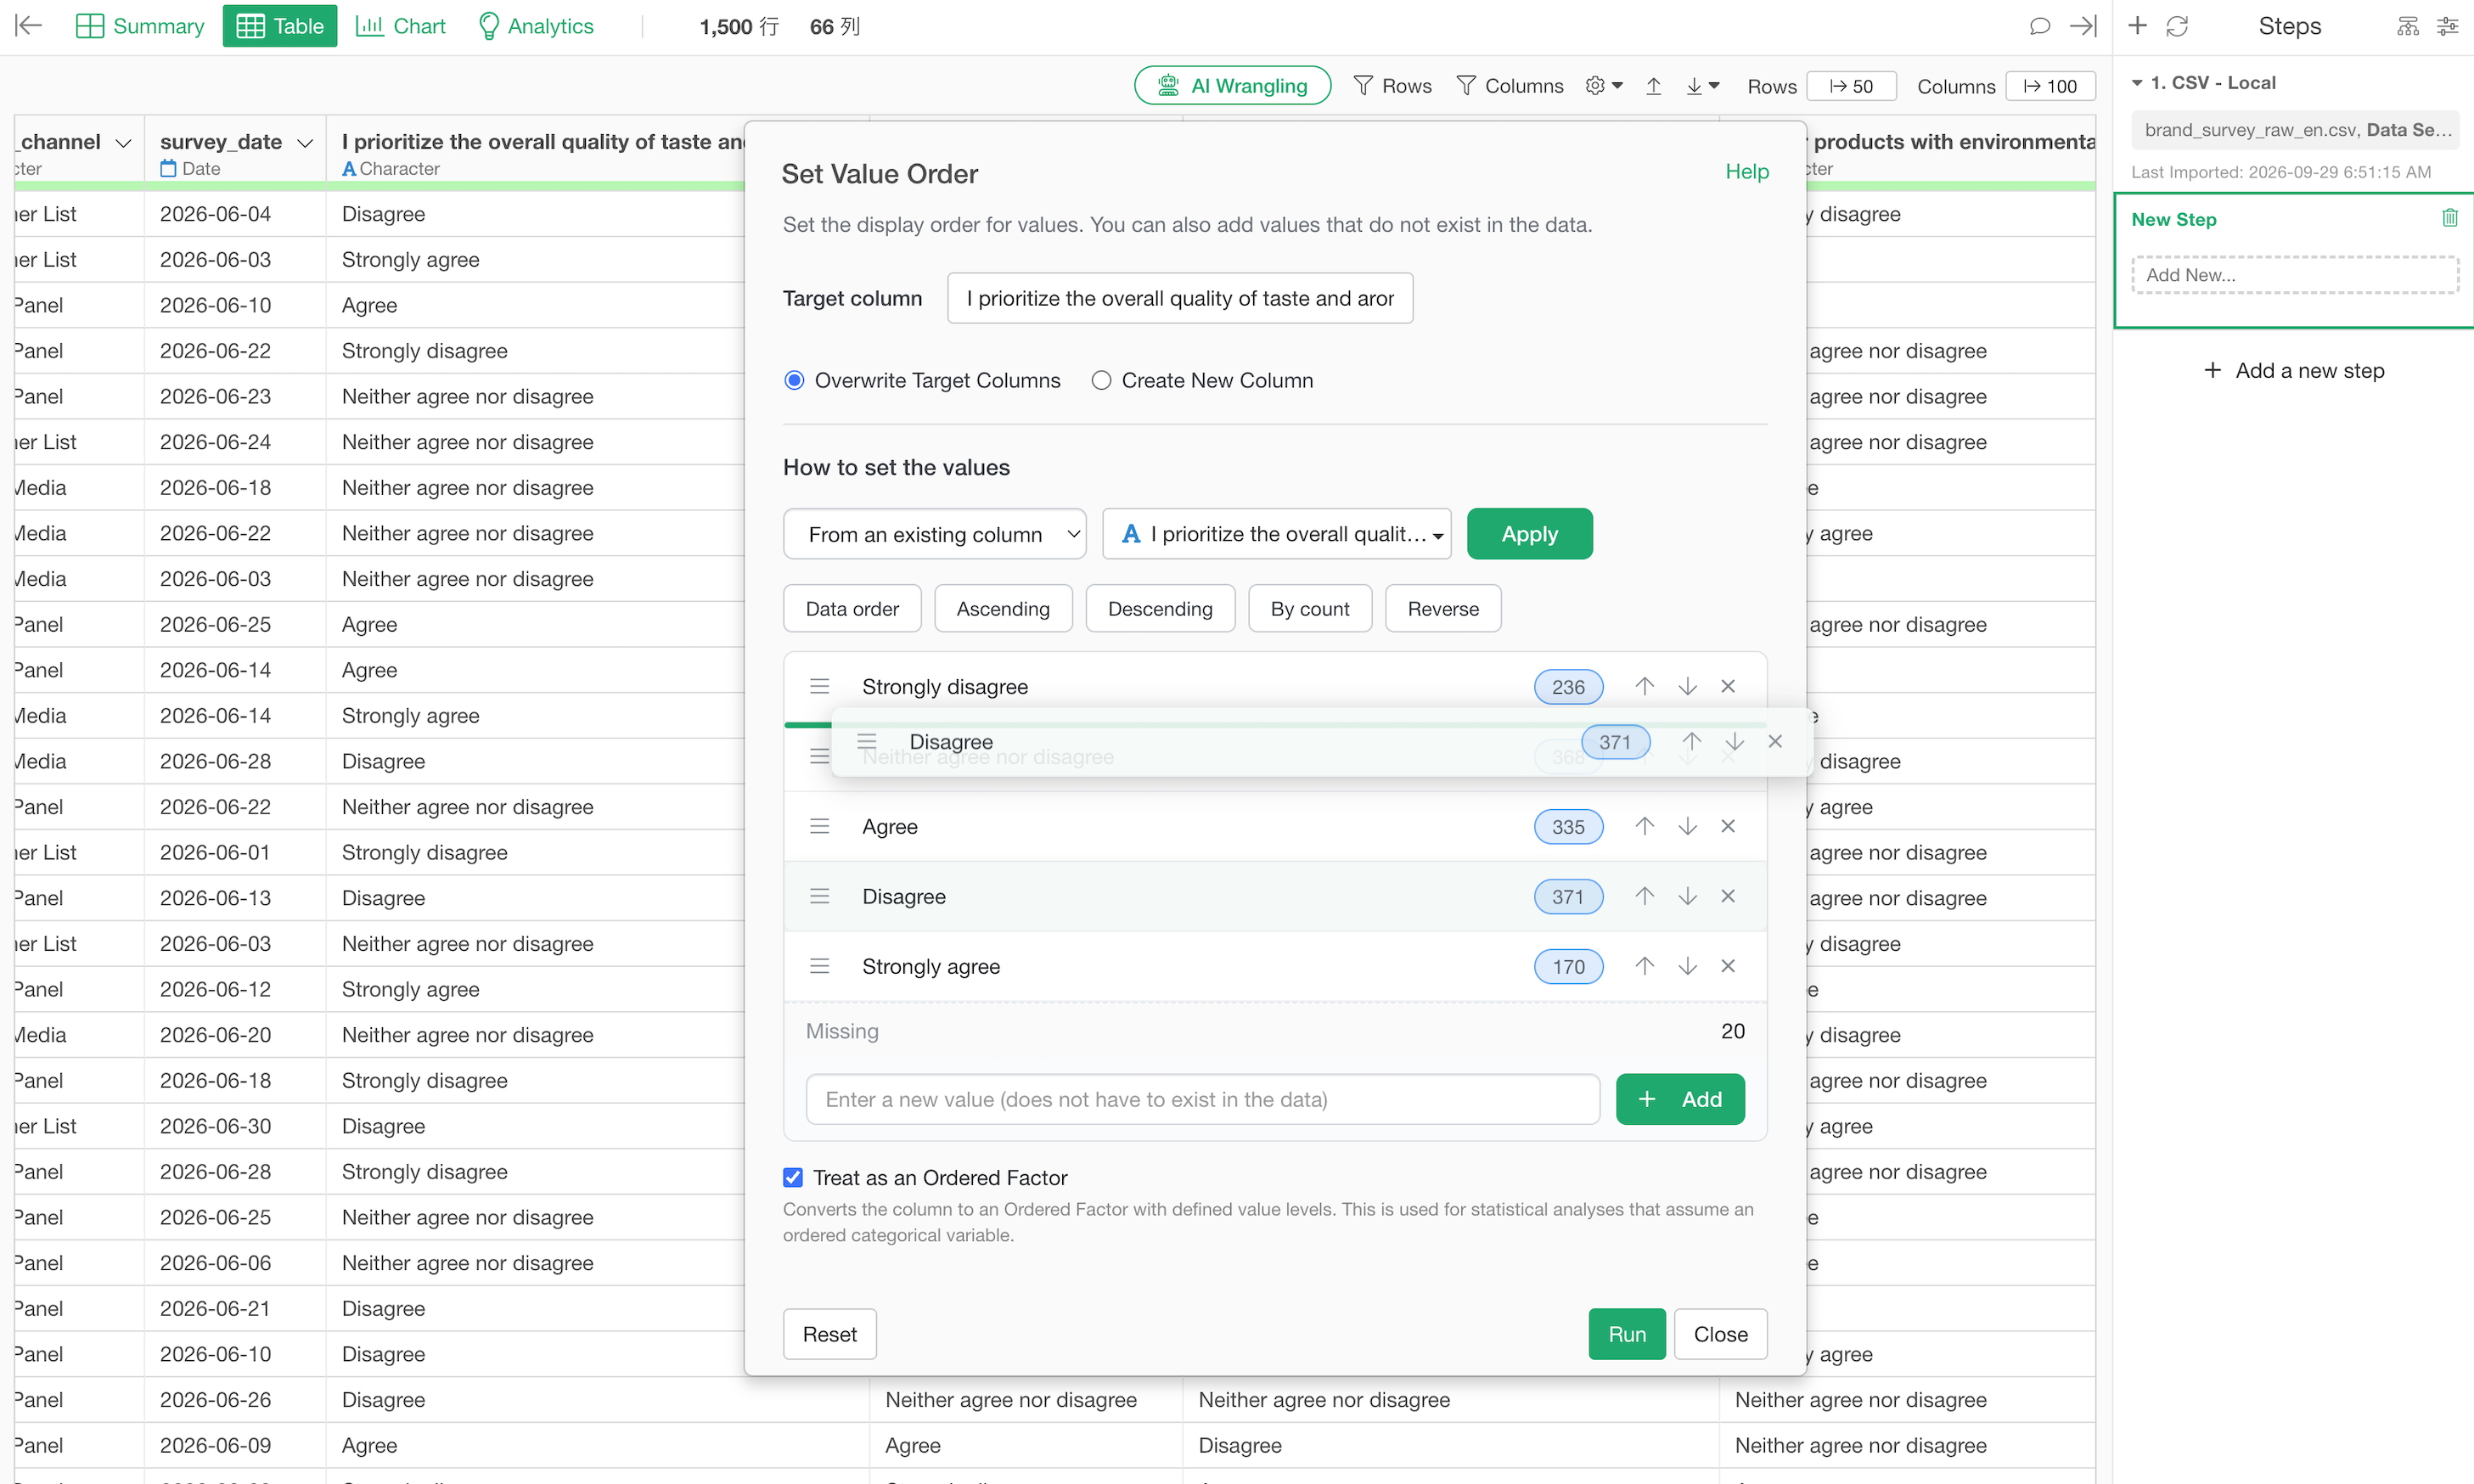
Set Meaningful Category Orders
Arrange categorical responses such as 5-point scales, age groups, usage frequency, satisfaction, and purchase intent in the order that makes sense for analysis and visualization.
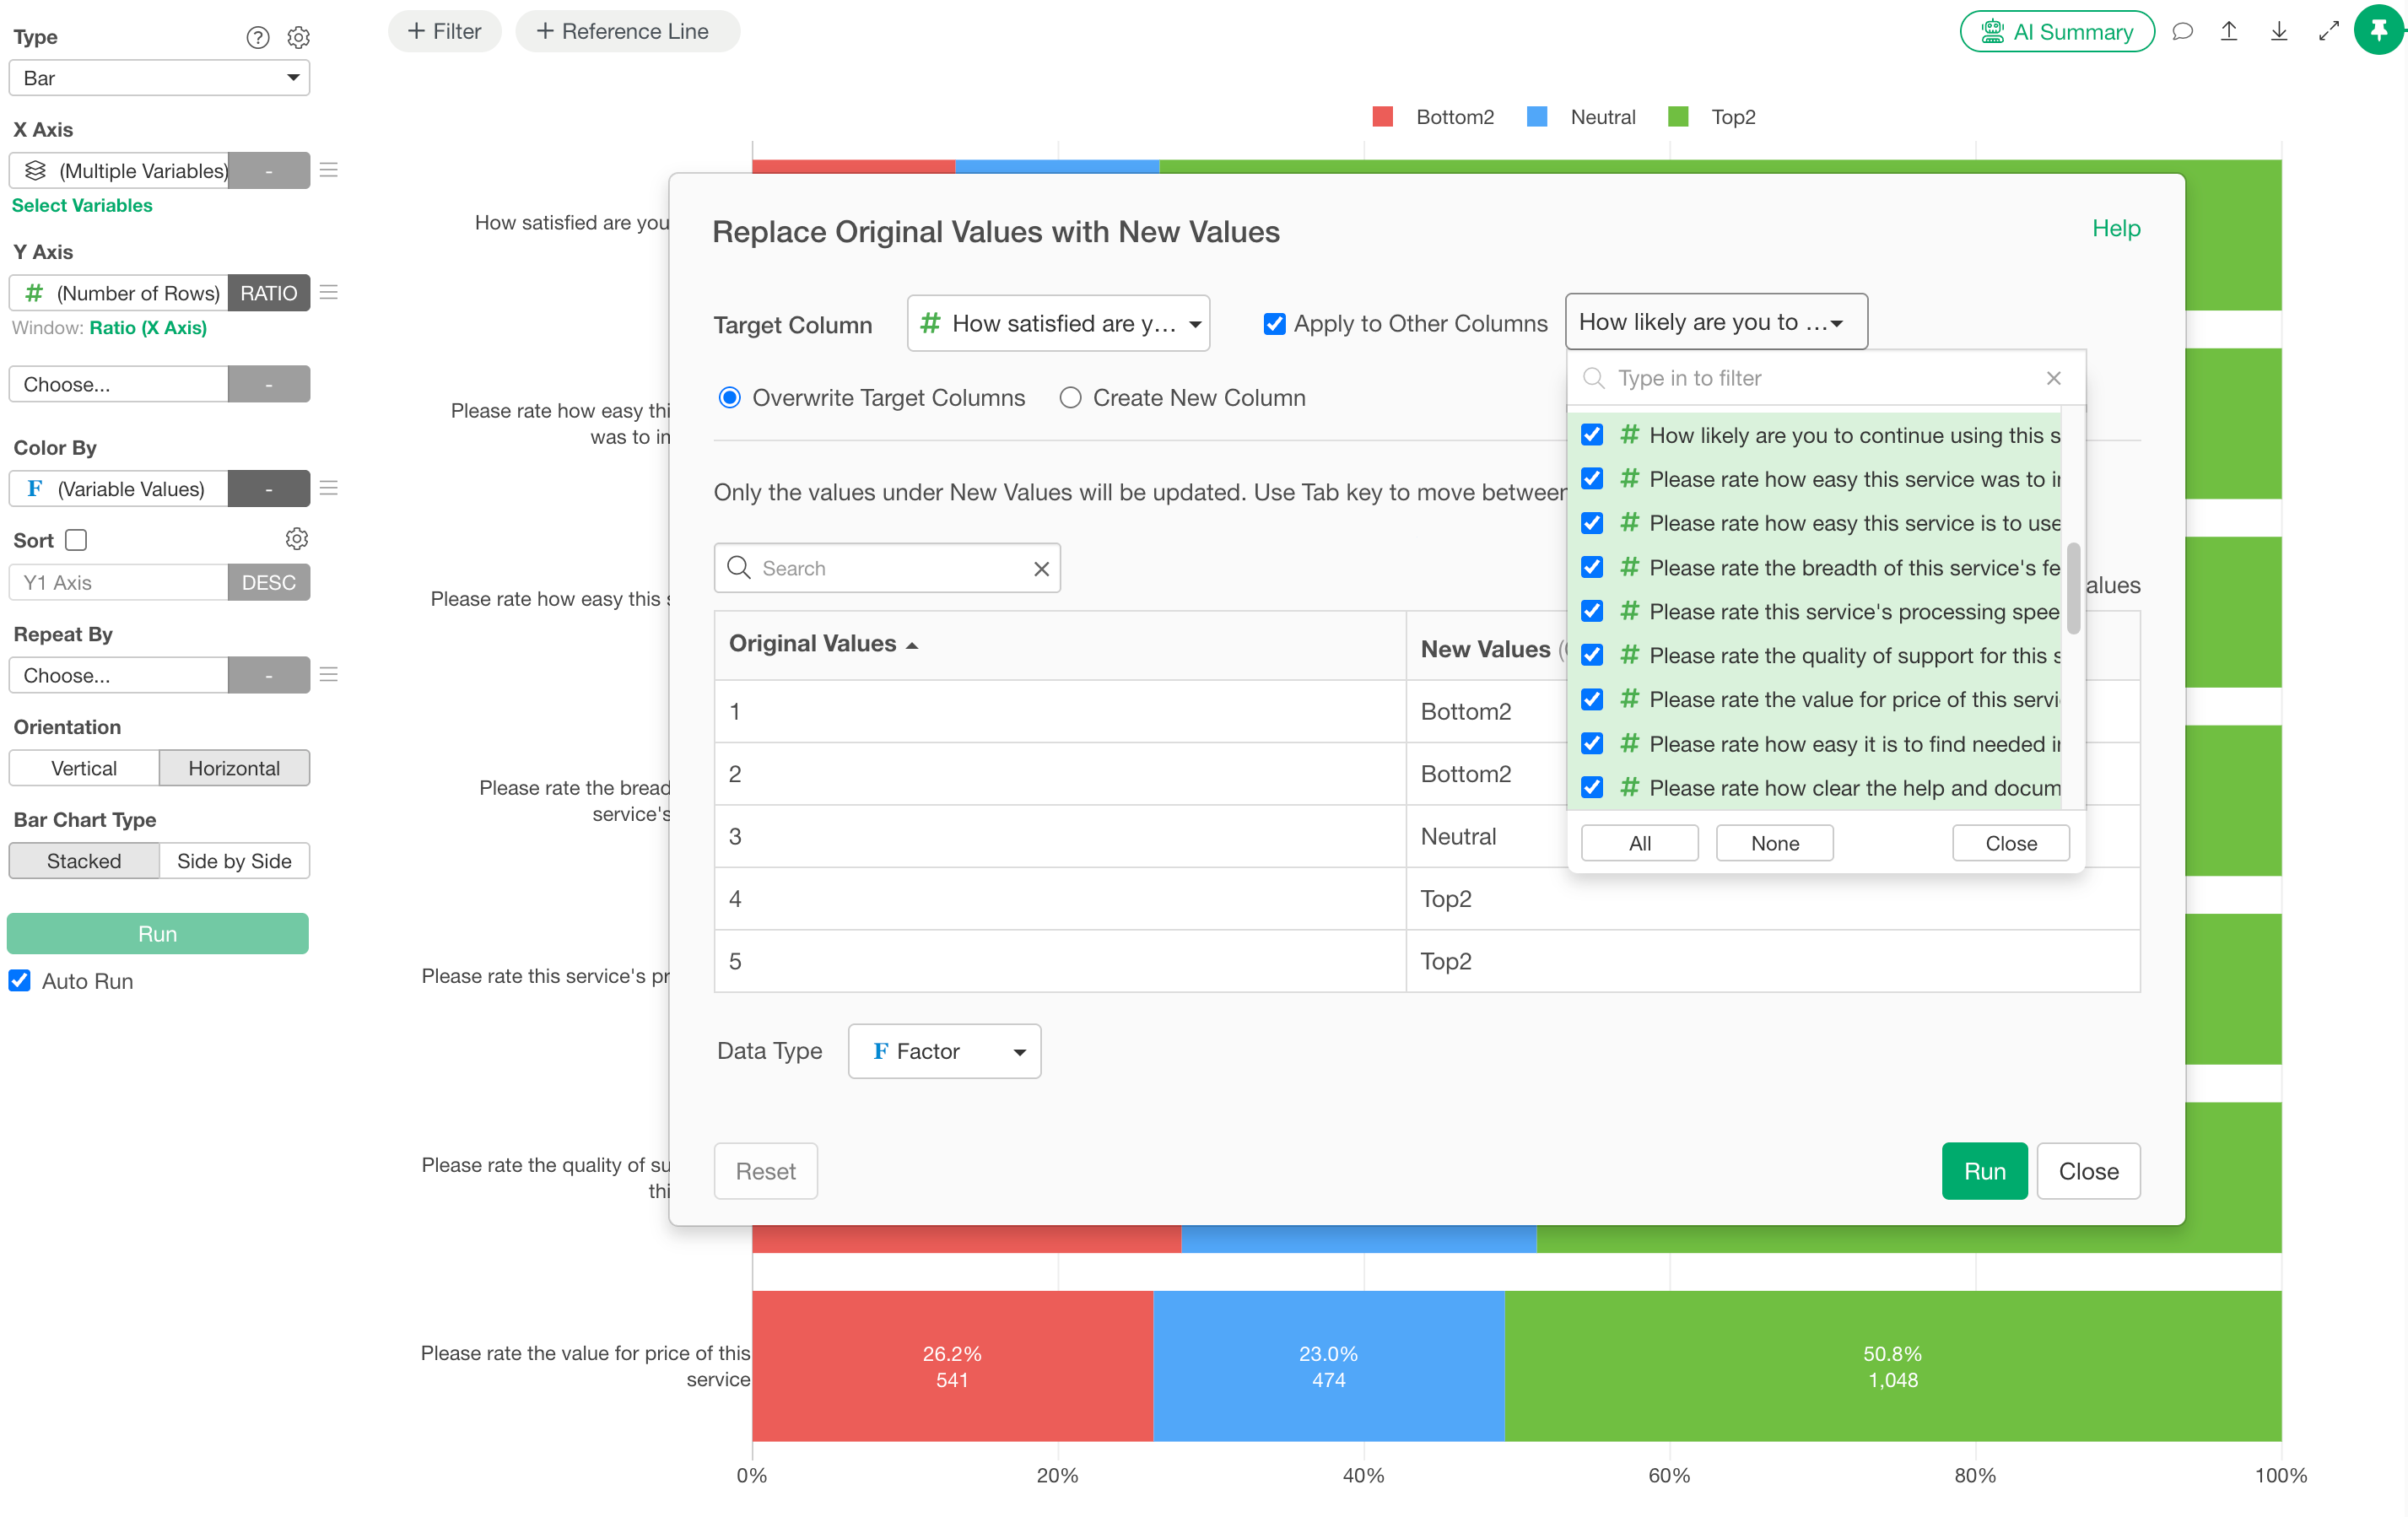
Create Top 2 / Bottom 2 Box
Create Top 2 Box, Bottom 2 Box, and Net metrics from 5-point or 7-point rating scales and save the calculations as reusable logic.
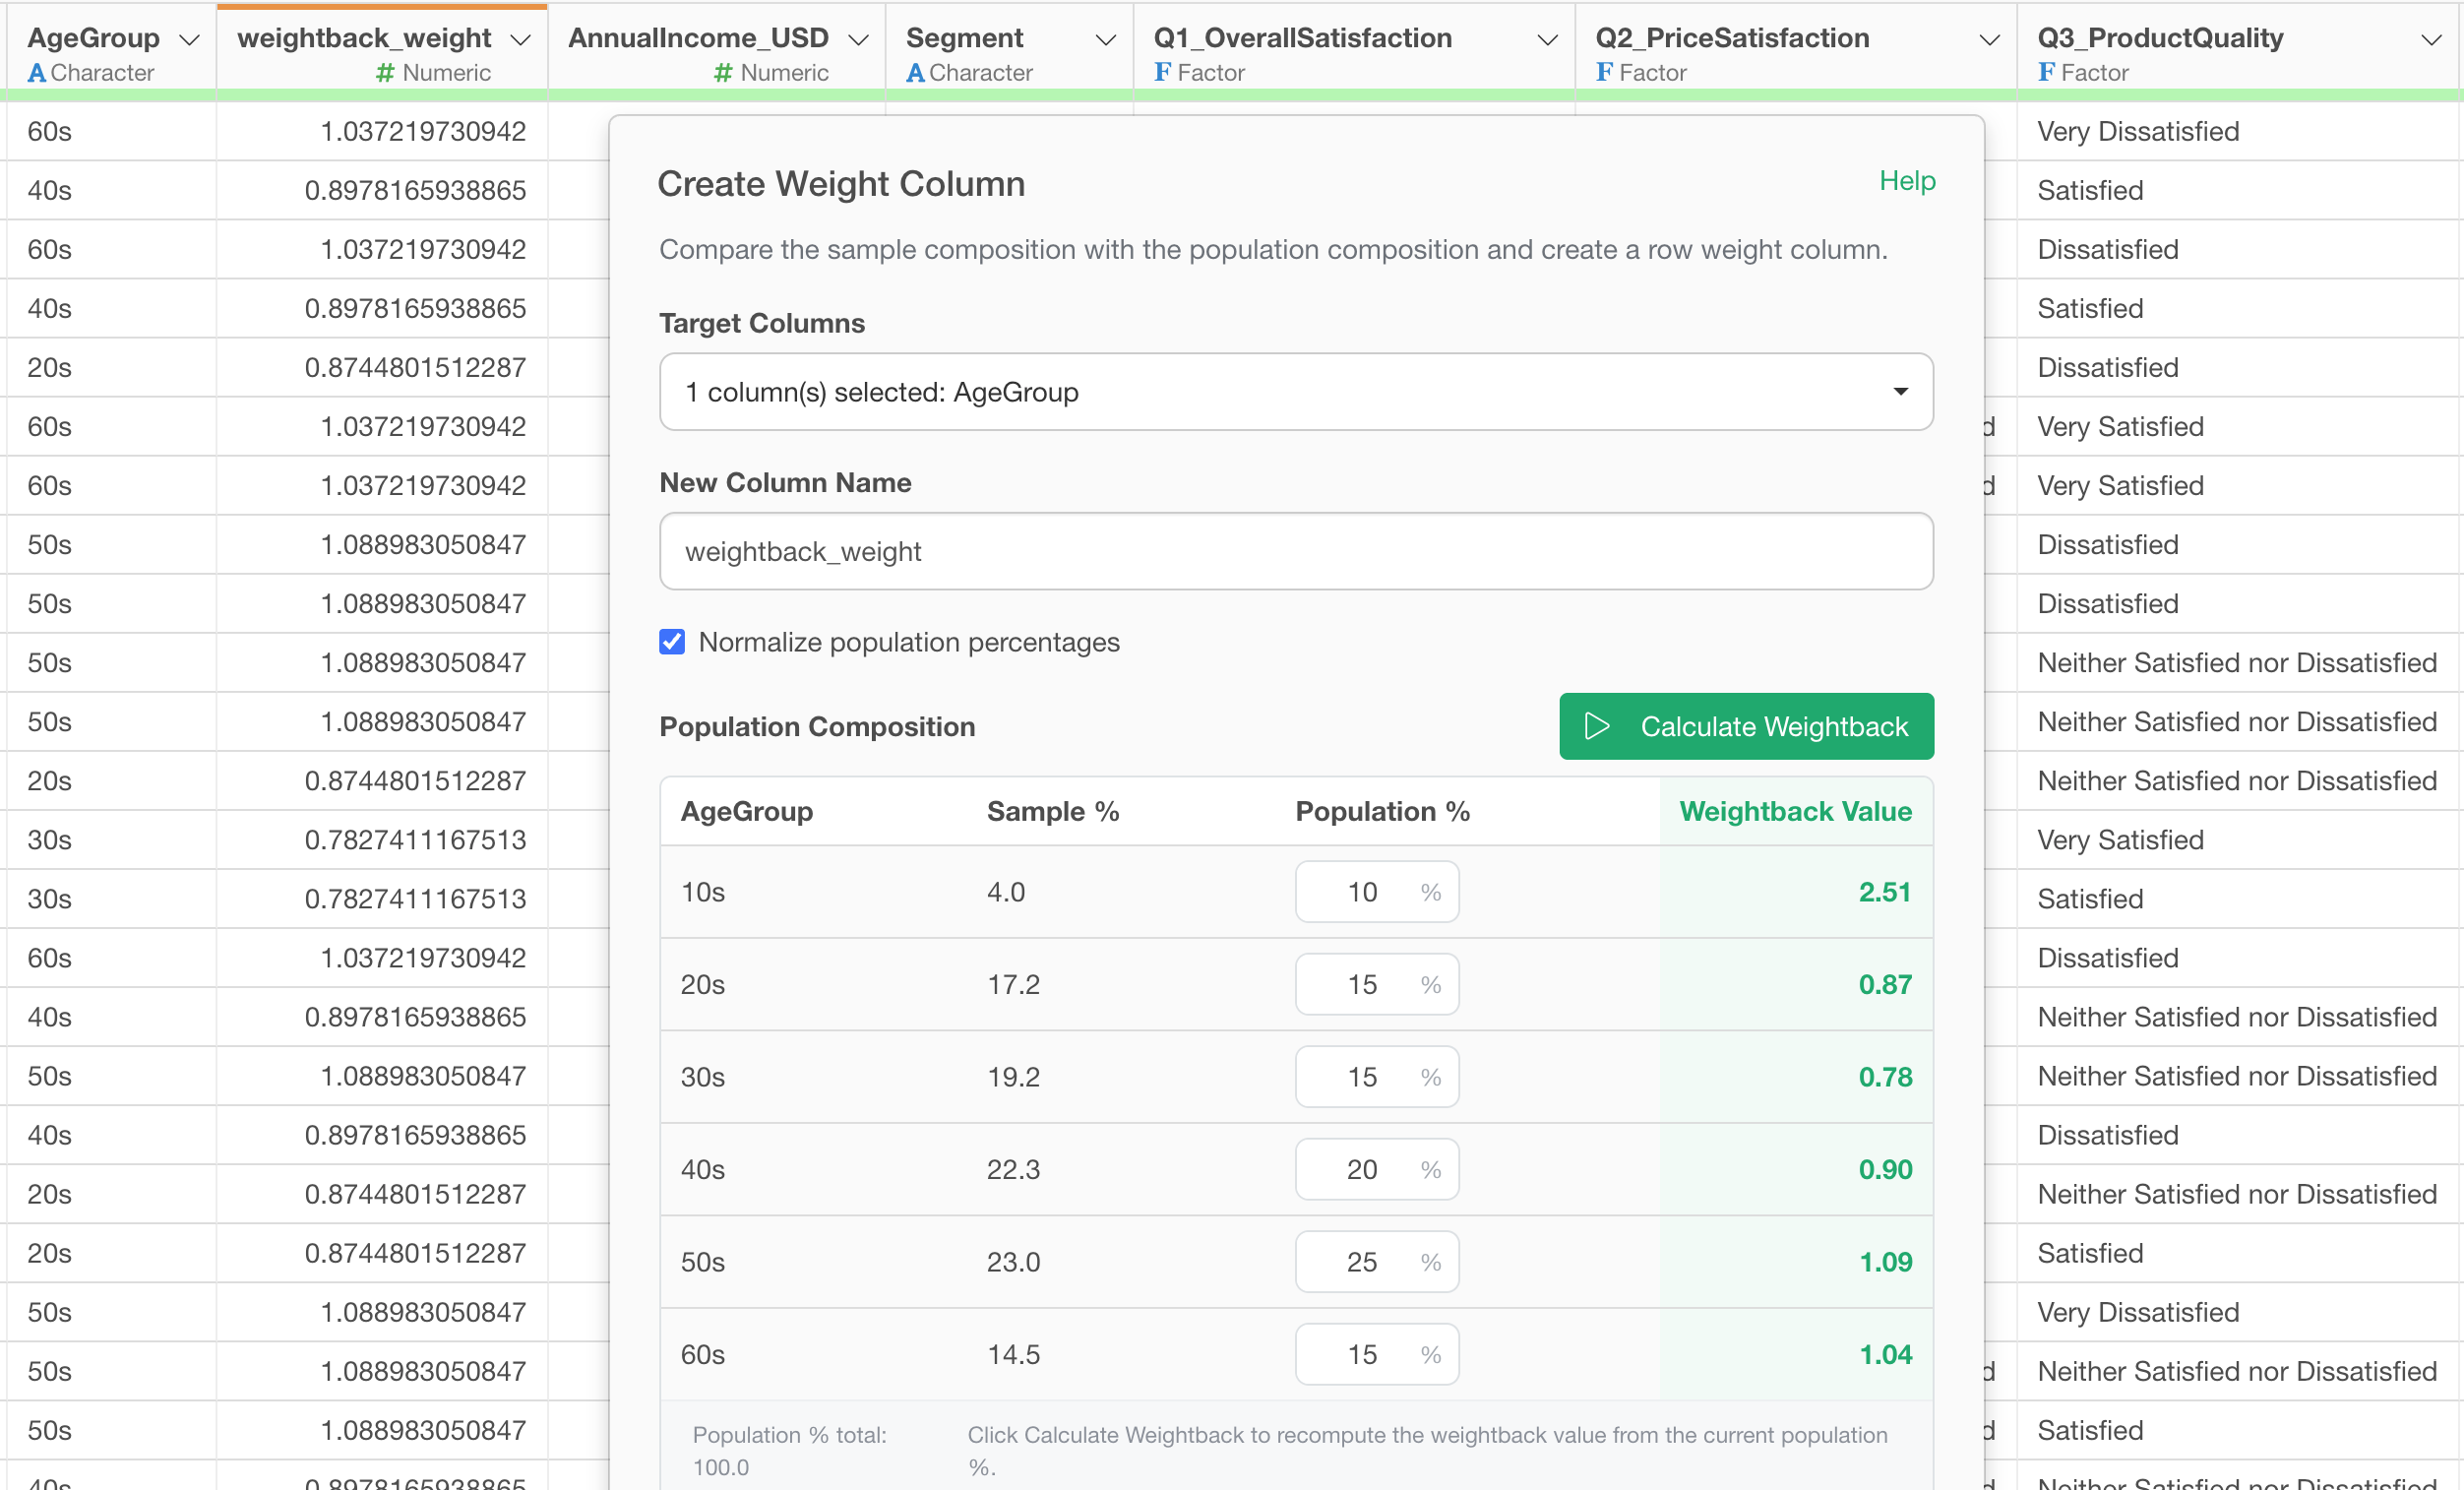
Calculate Survey Weights
Calculate weights based on target population distributions and apply them directly to survey summaries and analysis.
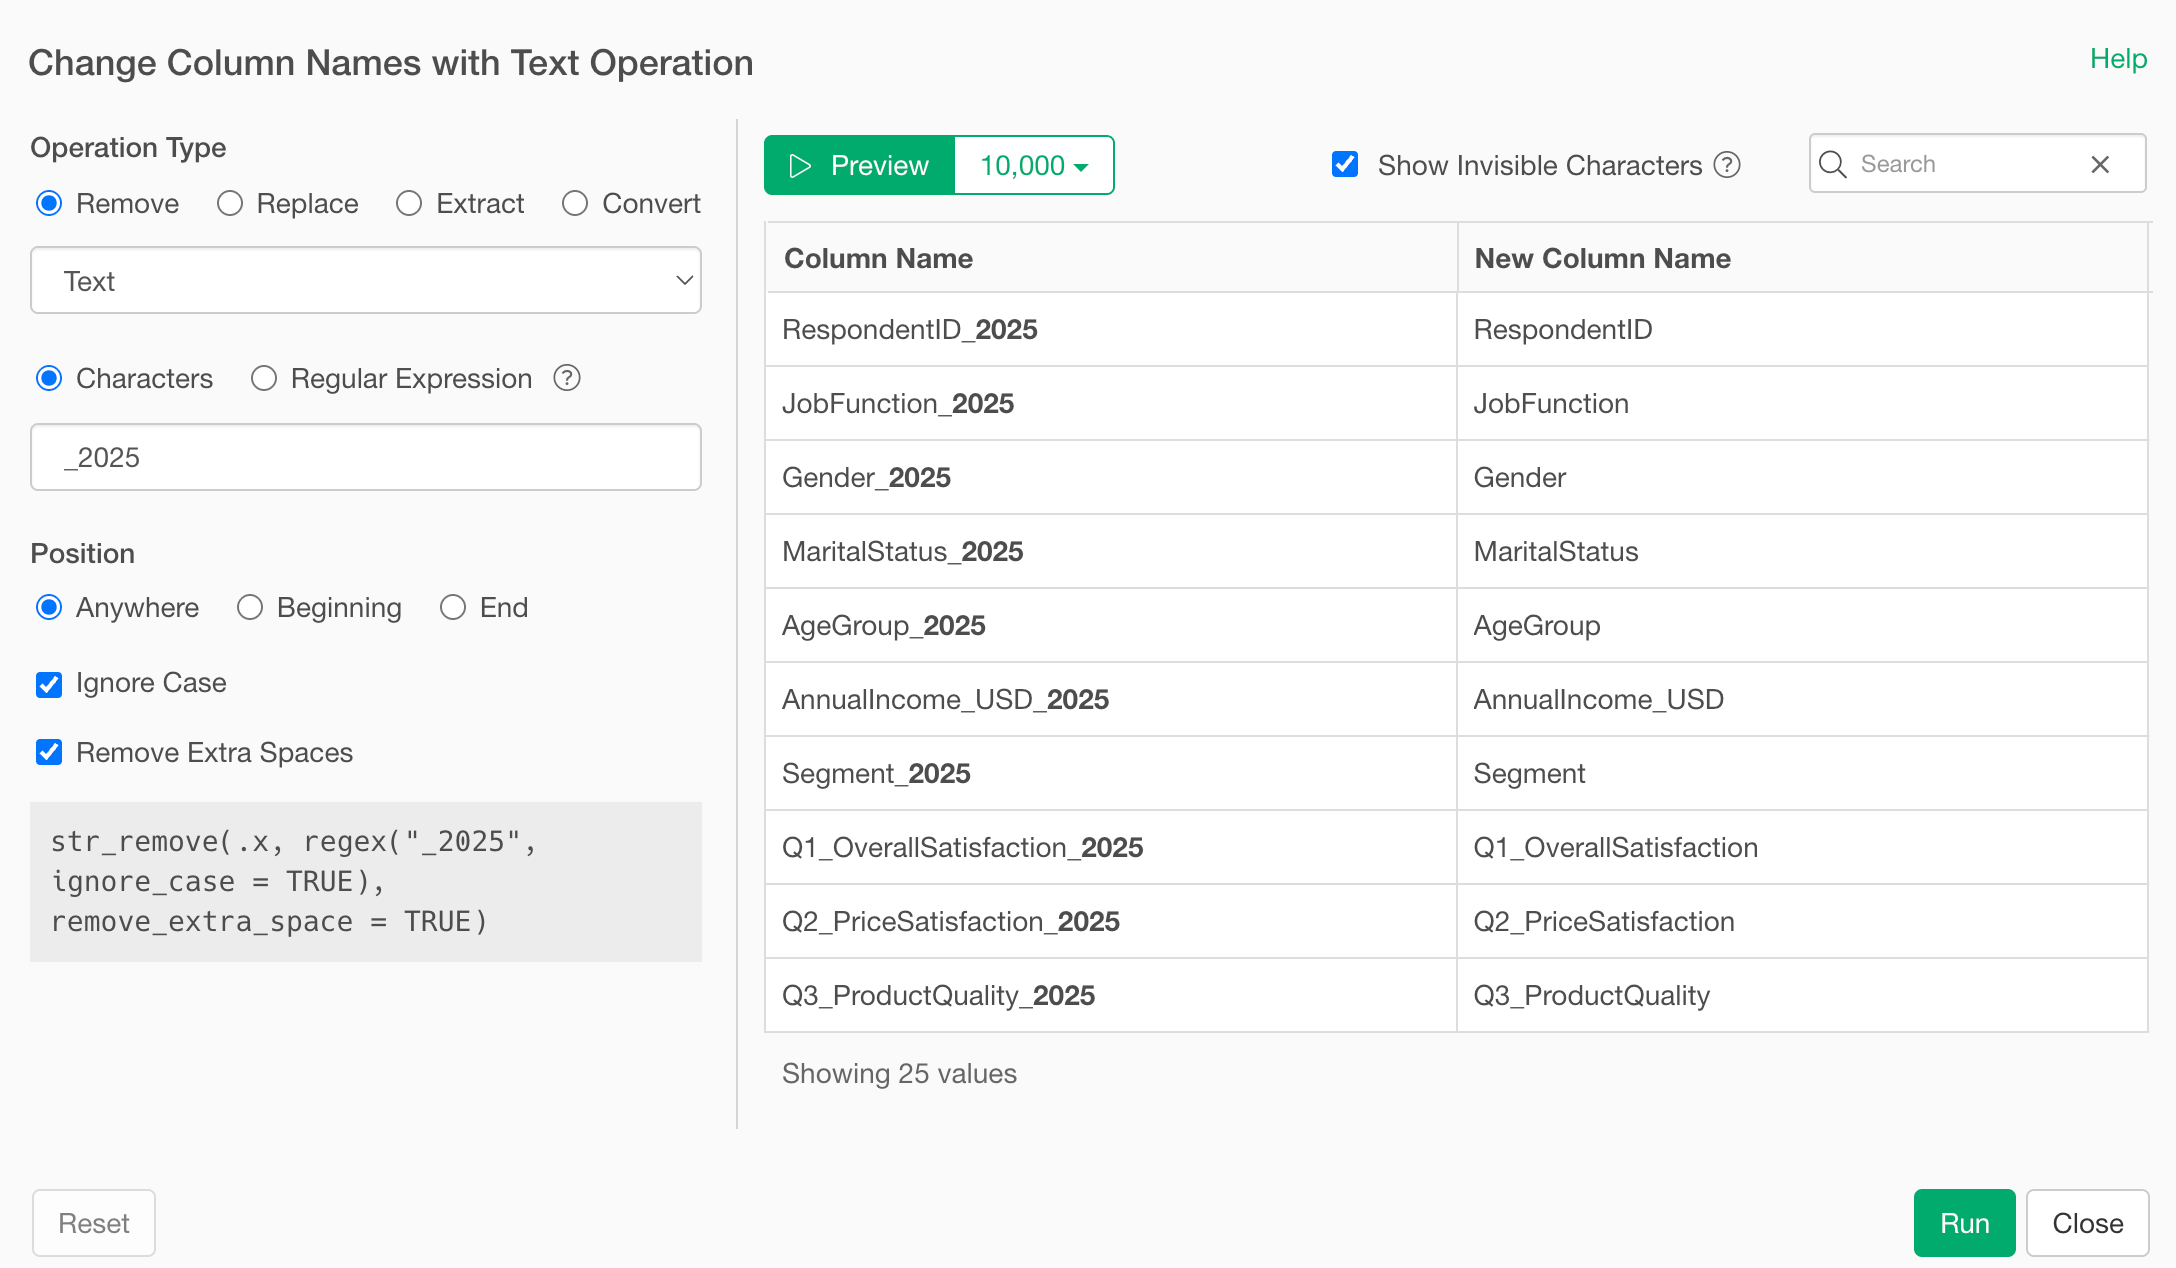
Standardize Inconsistent Labels
Clean up inconsistent product names, brand names, company names, store names, locations, or other text values so that equivalent responses are analyzed together.
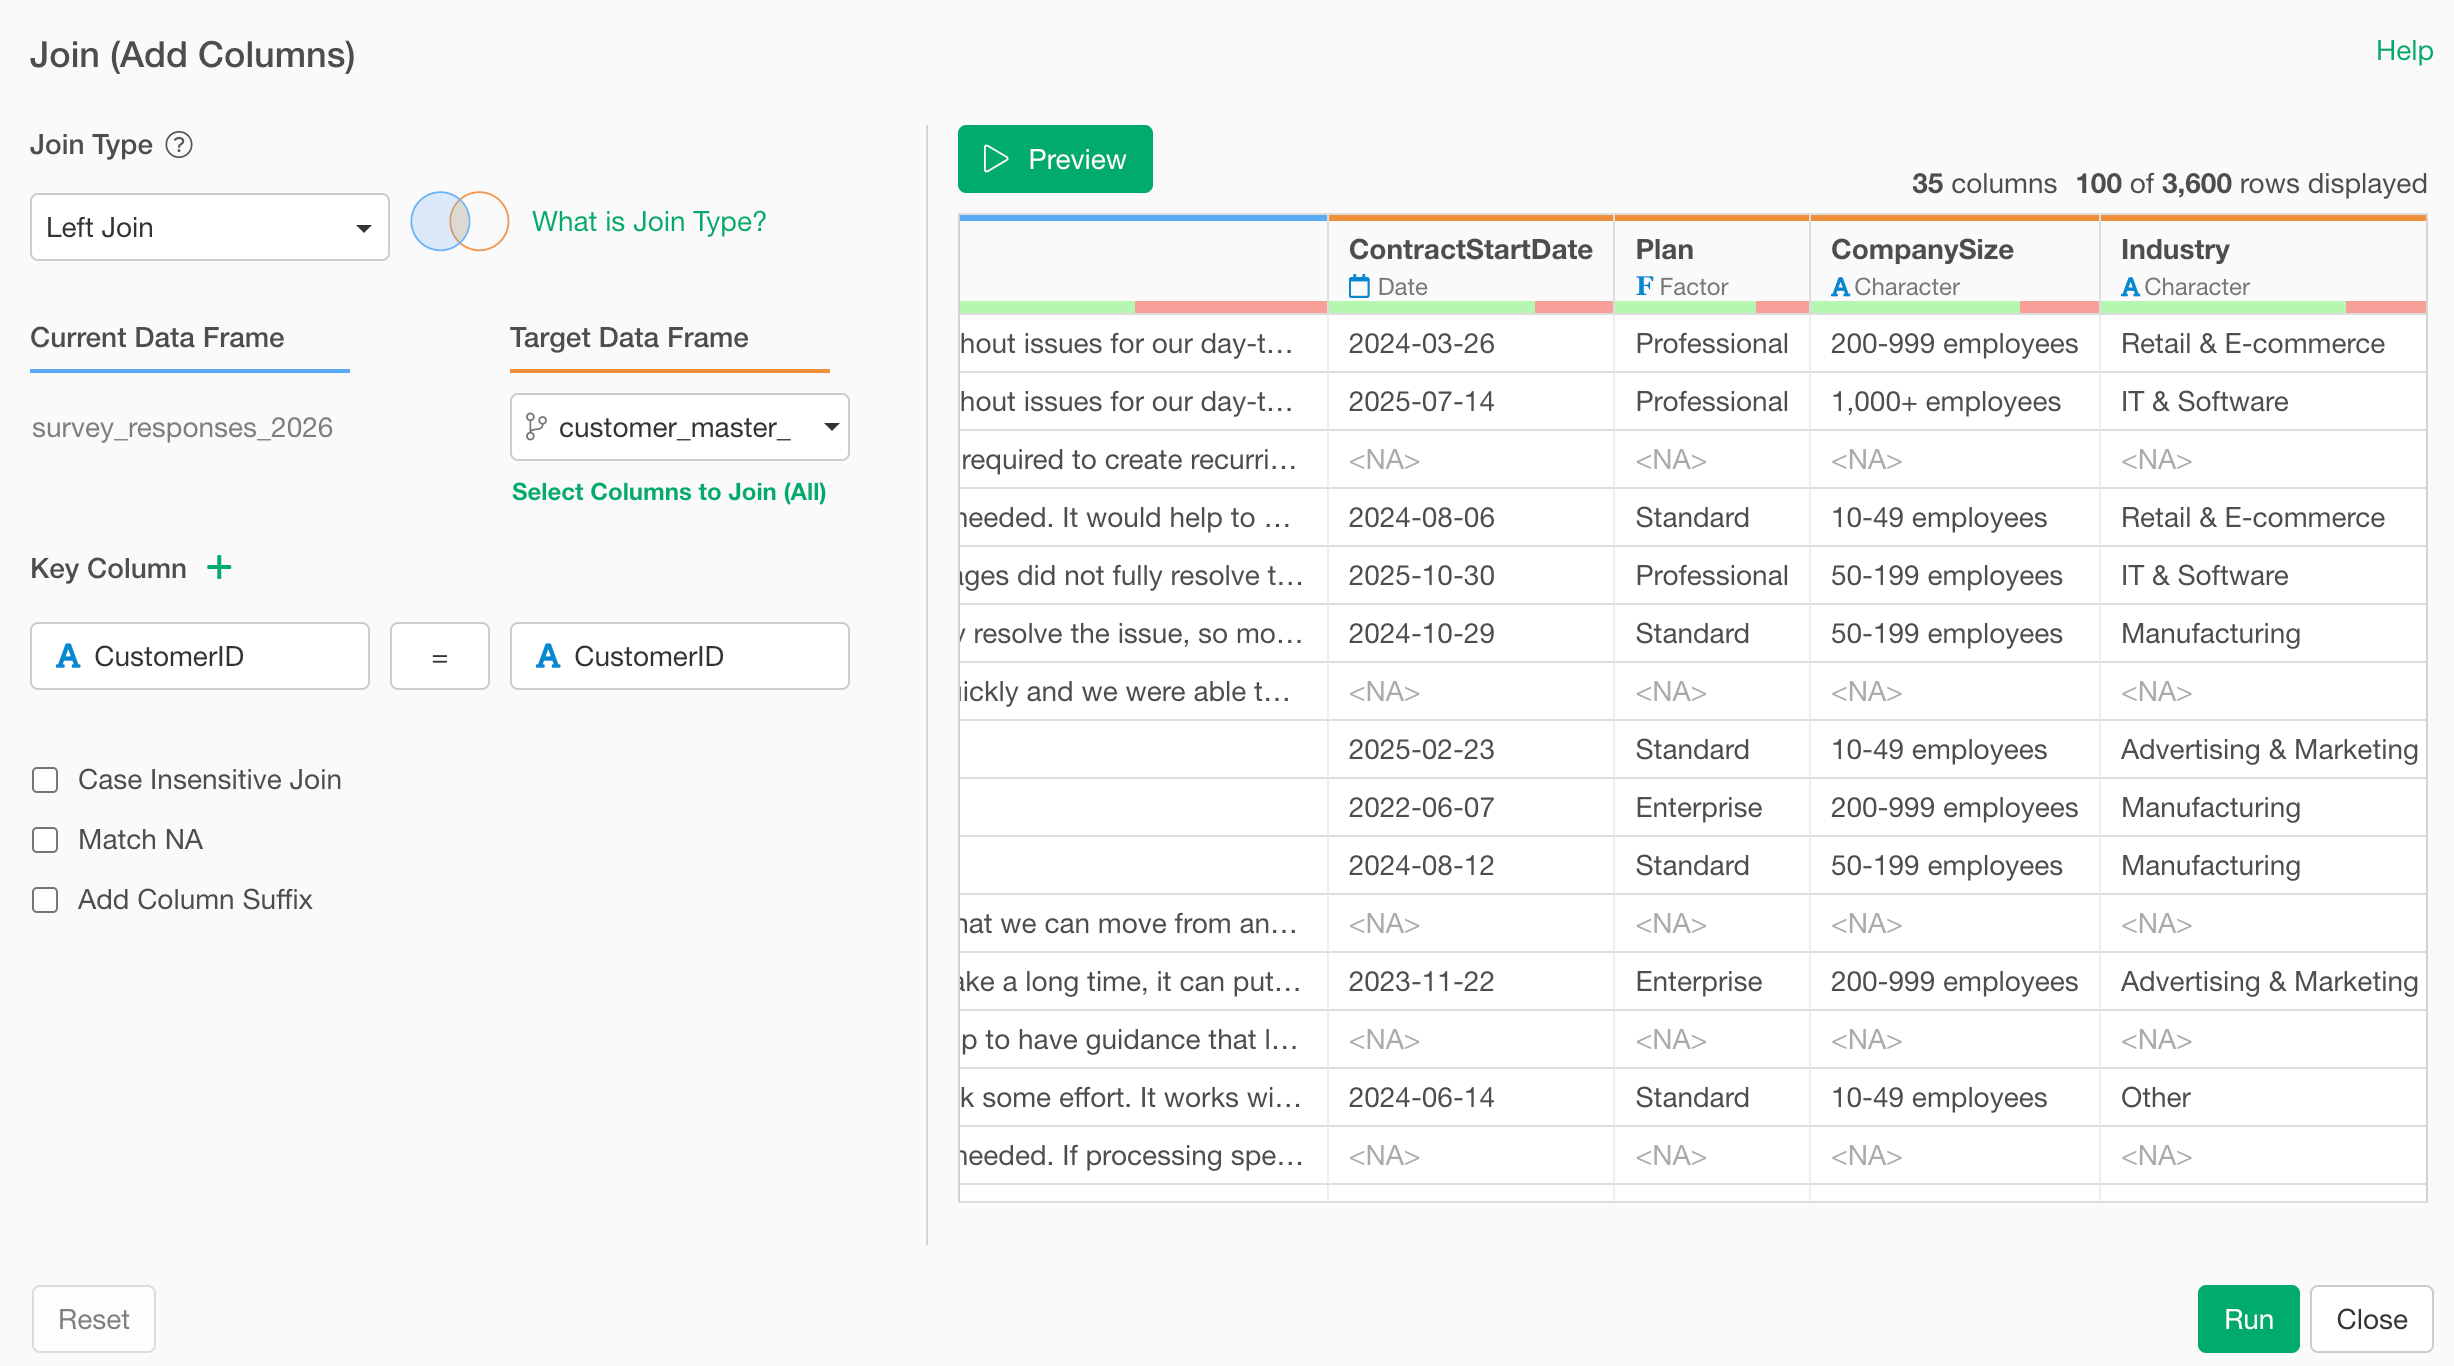
Combine Tracking Survey Waves
Combine monthly or quarterly survey waves into a format that’s ready for trend comparisons and wave-over-wave analysis.
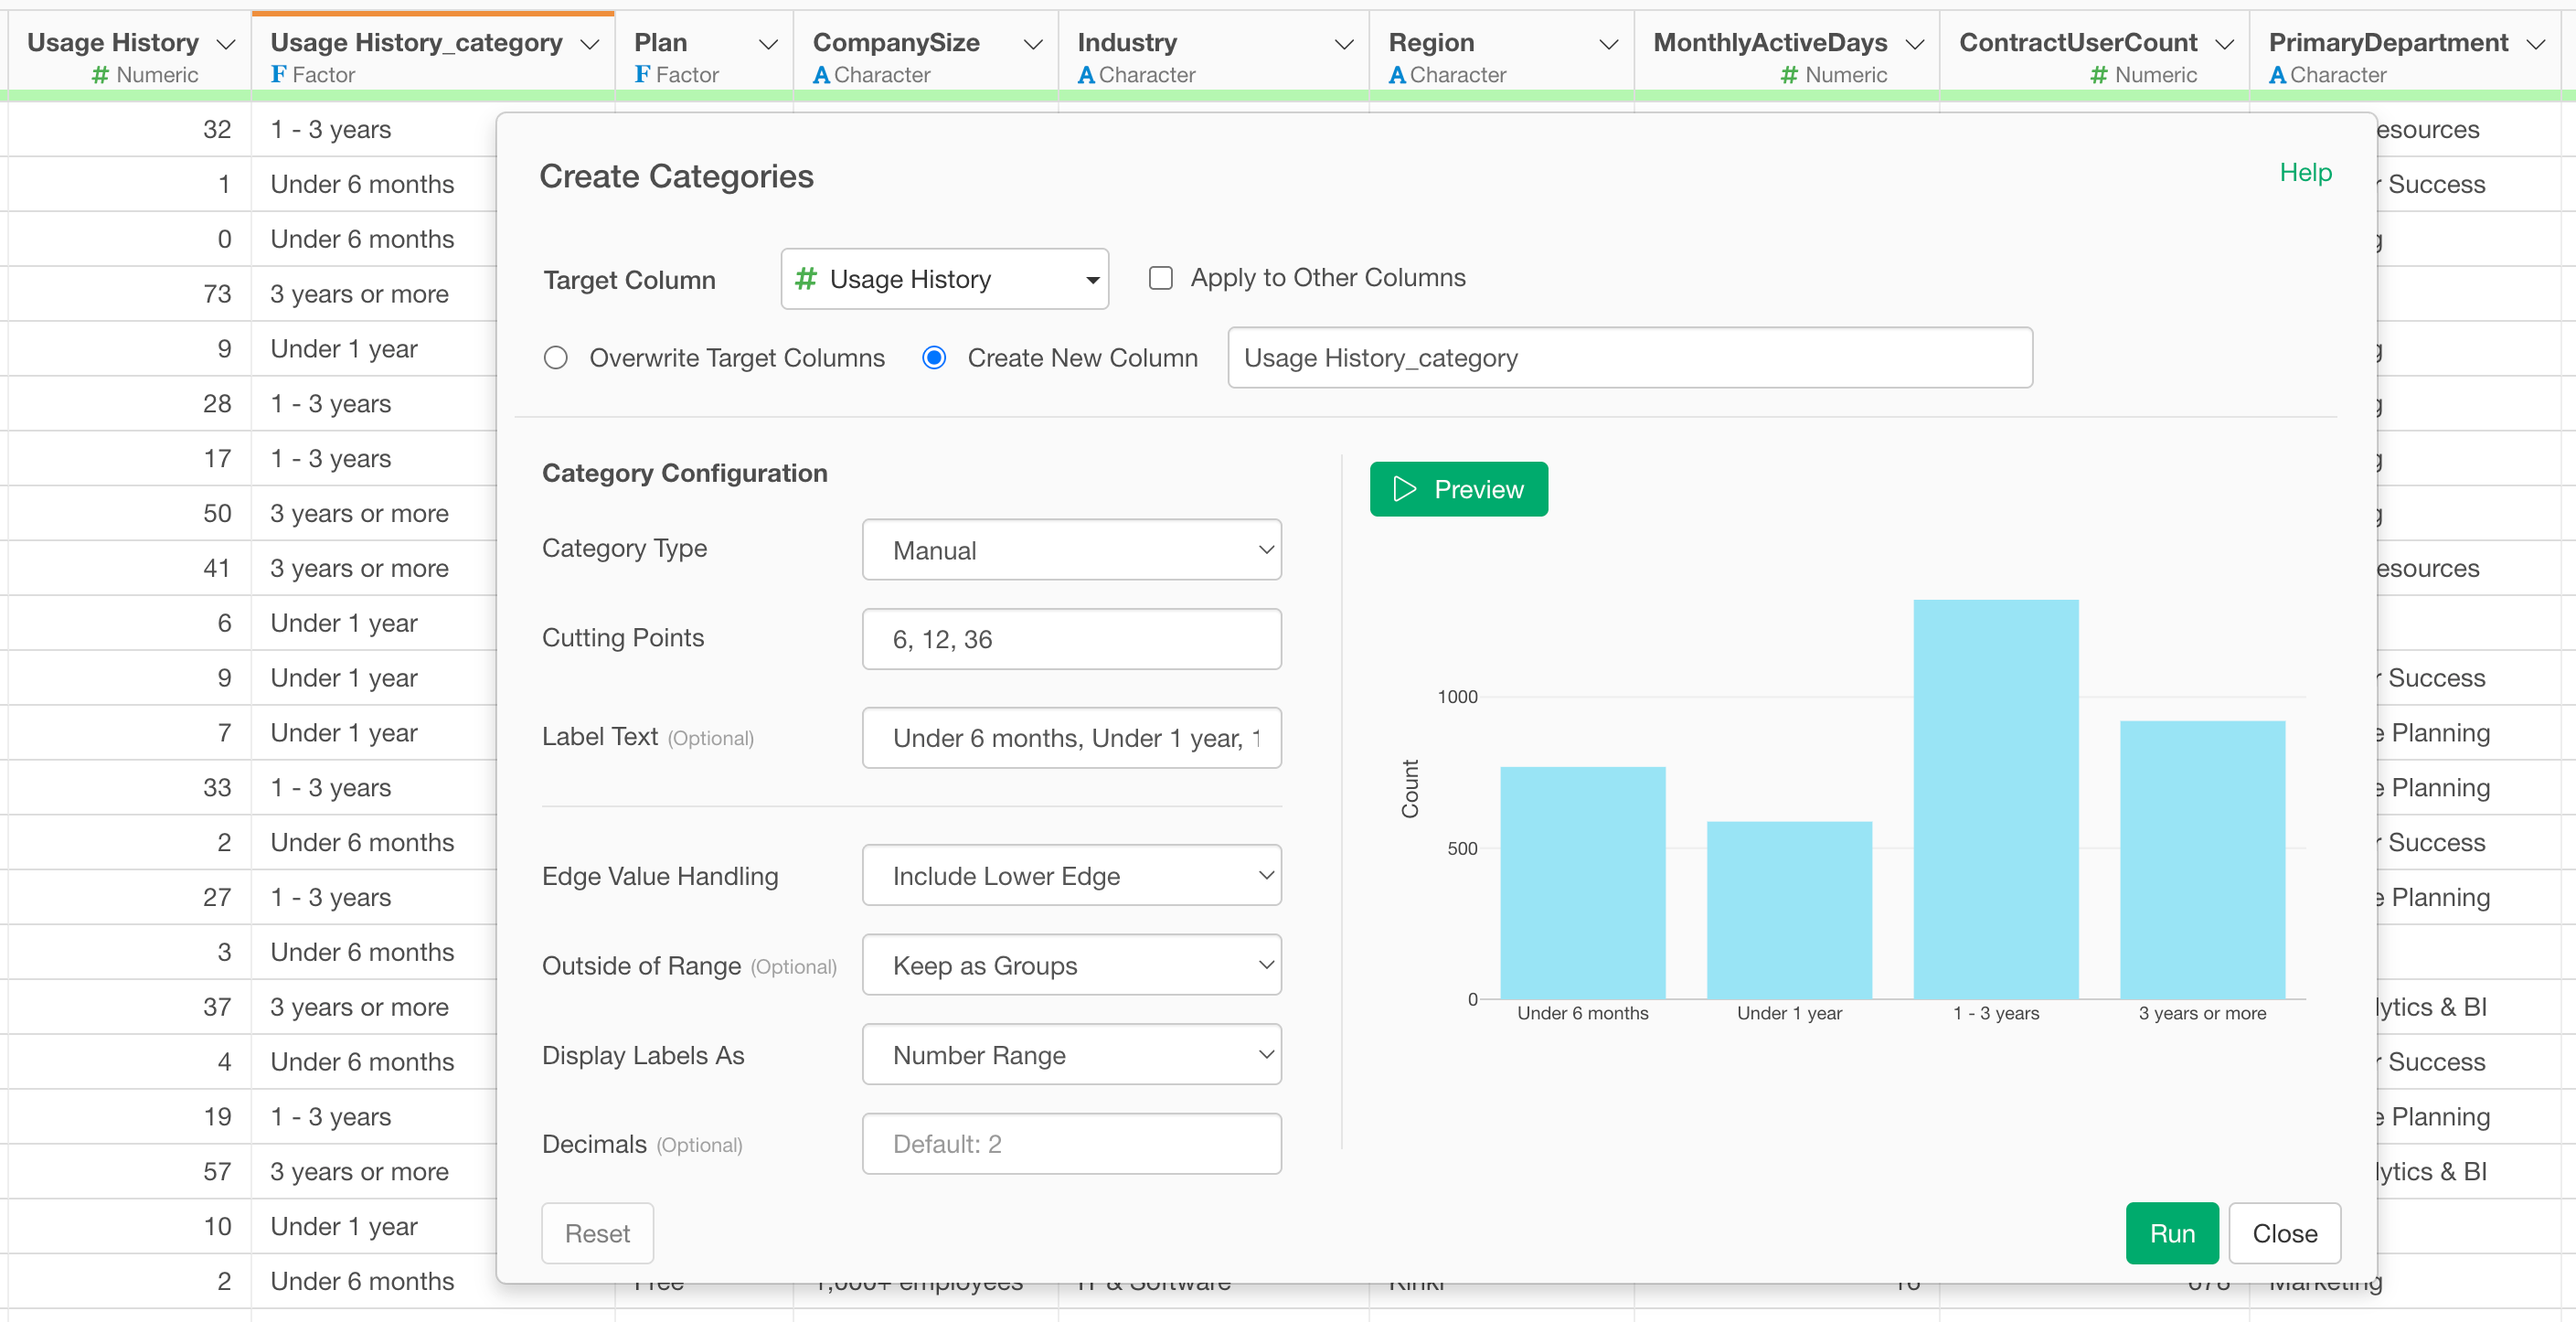
Regroup Attributes
Regroup attributes into units that are easier to analyze, like turning ages into age groups, states into regions, or usage frequency into segments.
Move from manual tabulation in Excel to a reproducible analysis process.
Instead of relying on repeated copy-and-paste, formulas, and manual adjustments, Exploratory lets you build an analysis workflow that preserves how every result was created and can be rerun when the data changes.
Analyze open-ended responses faster with AI.
Open-ended responses often contain some of the most valuable customer insights—but manually reading, coding, and summarizing hundreds or thousands of comments takes time. With Exploratory, you can use AI to summarize, classify, and analyze sentiment in open-ended responses, then combine those results with the rest of your quantitative survey data.
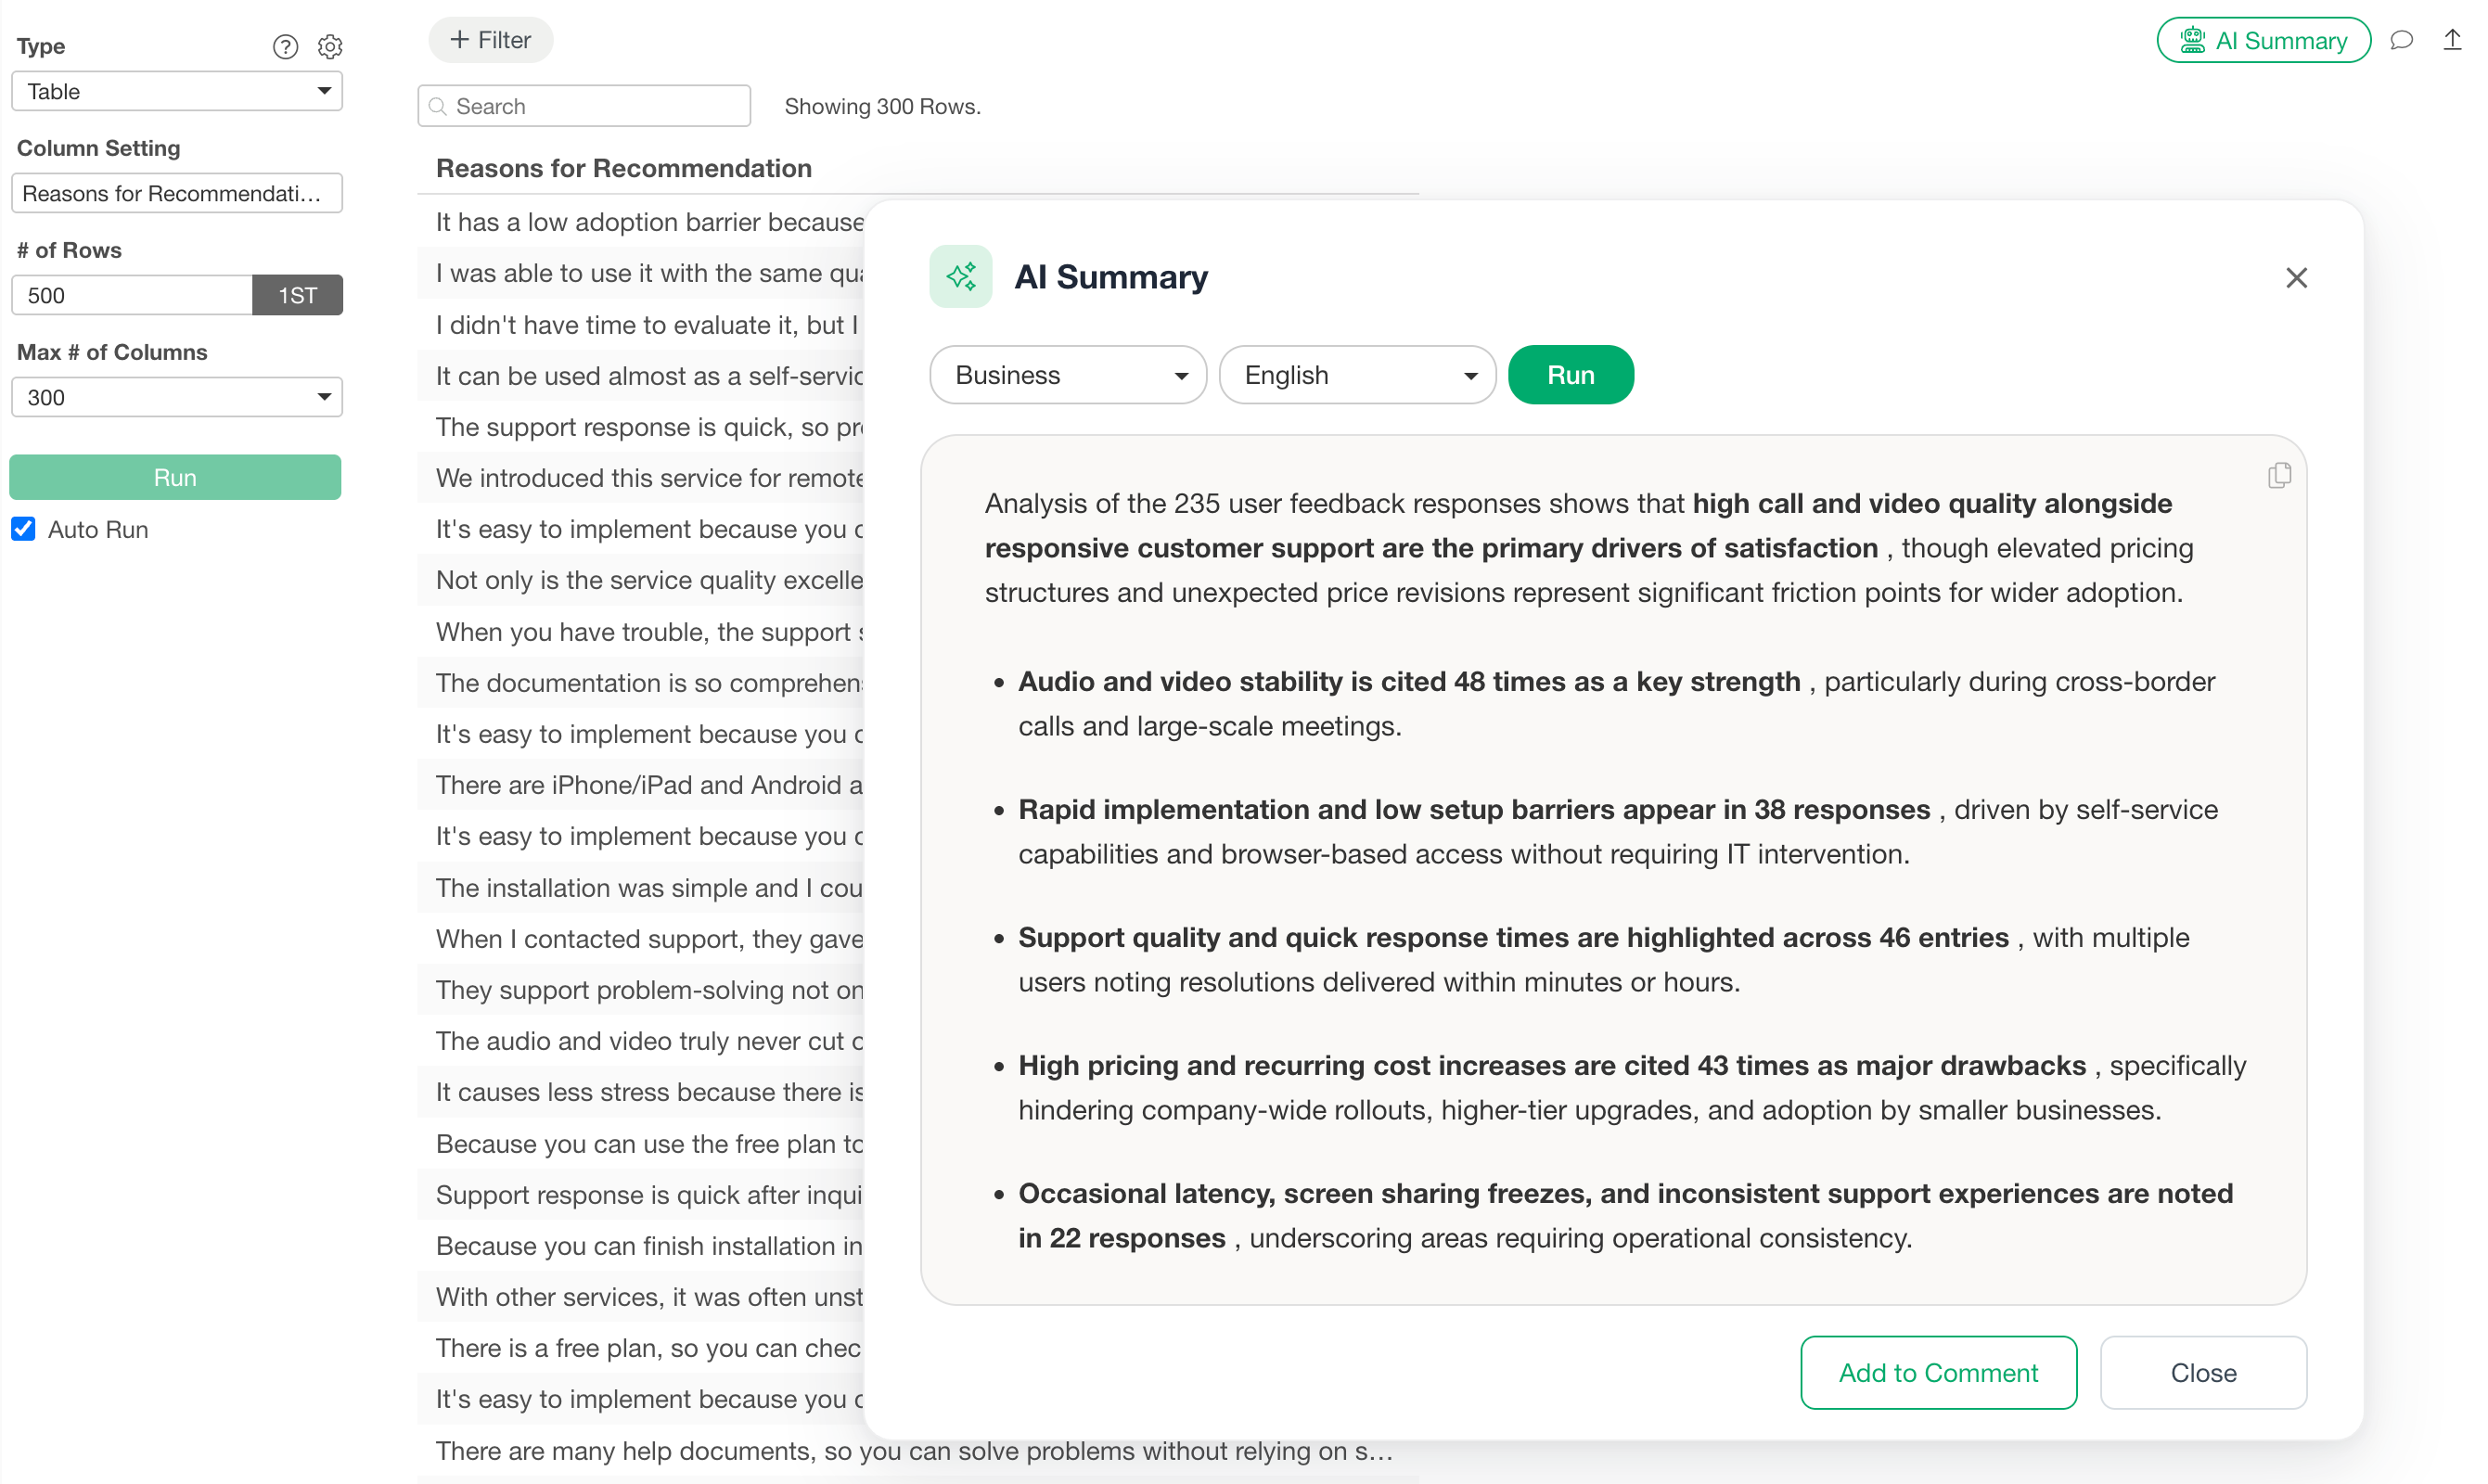
Summarize Responses
Use AI to summarize hundreds or thousands of responses and quickly understand the major themes, concerns, and ideas expressed by respondents.
Classify by Theme
Automatically classify open-ended responses into themes so you can see what respondents are talking about most frequently.
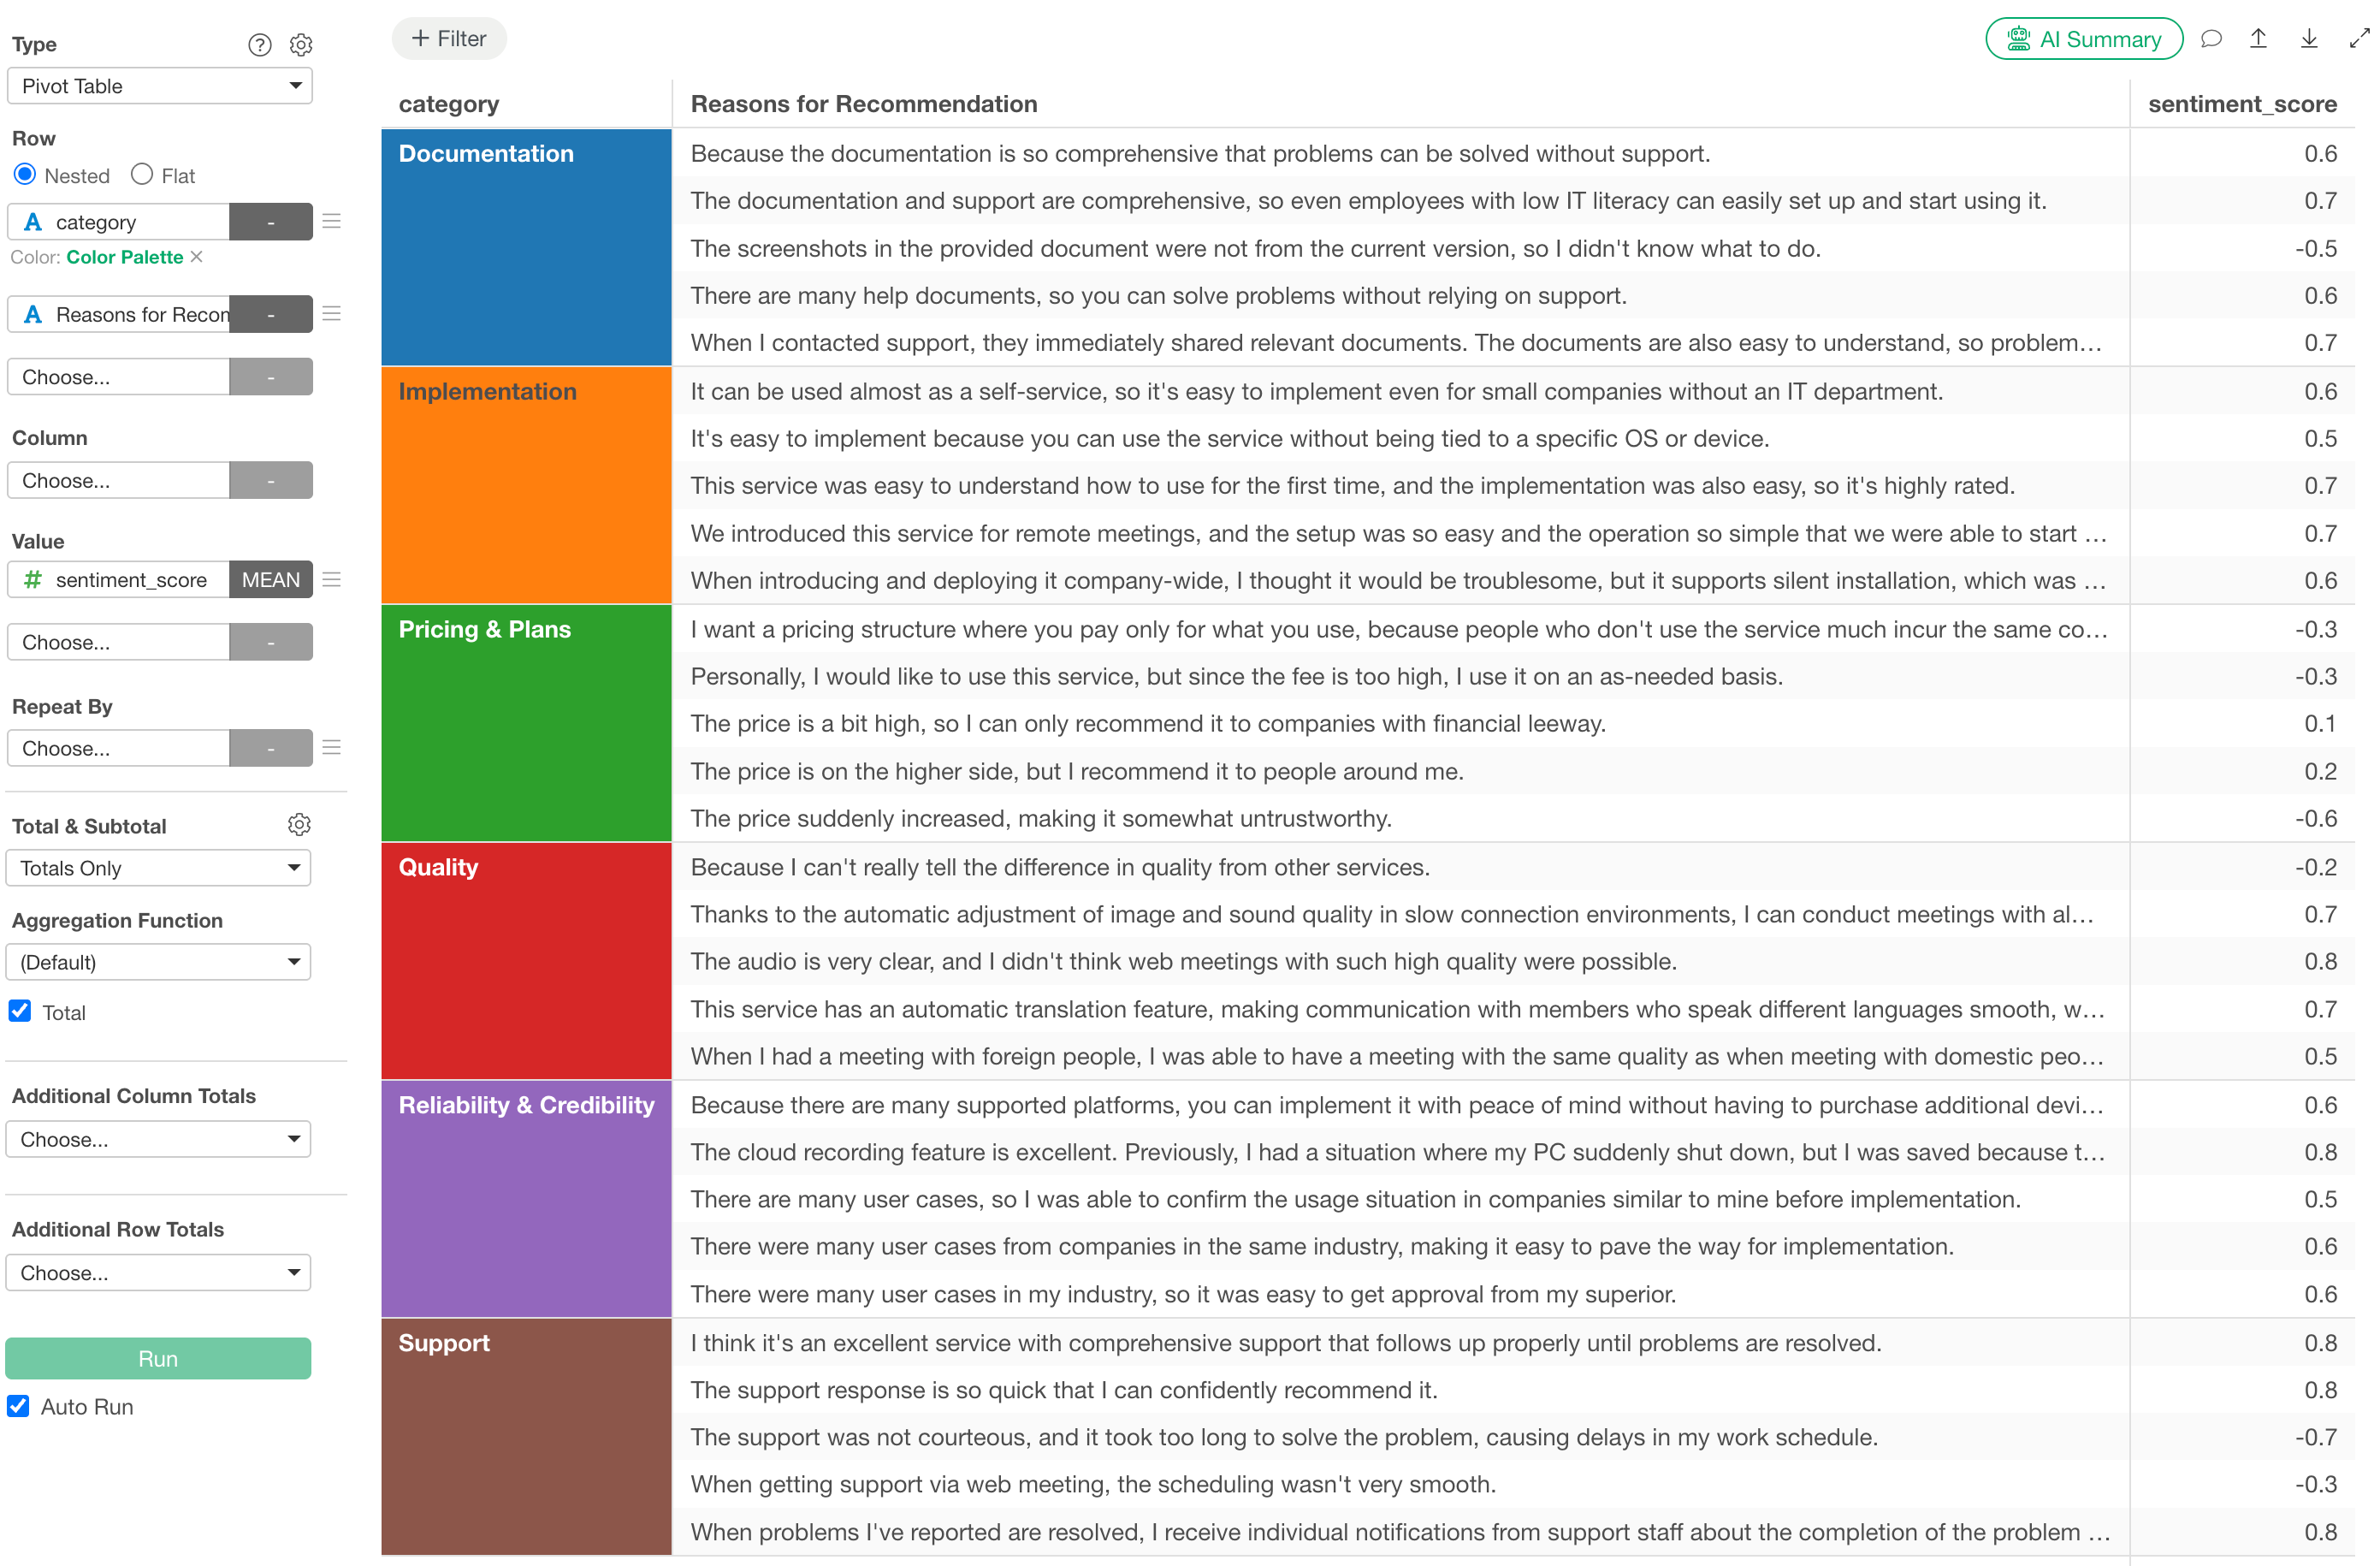
Crosstab AI-Classified Themes
Treat AI-generated categories like any other survey variable. Compare themes across demographics or customer segments to understand which groups are expressing particular needs, concerns, or preferences.
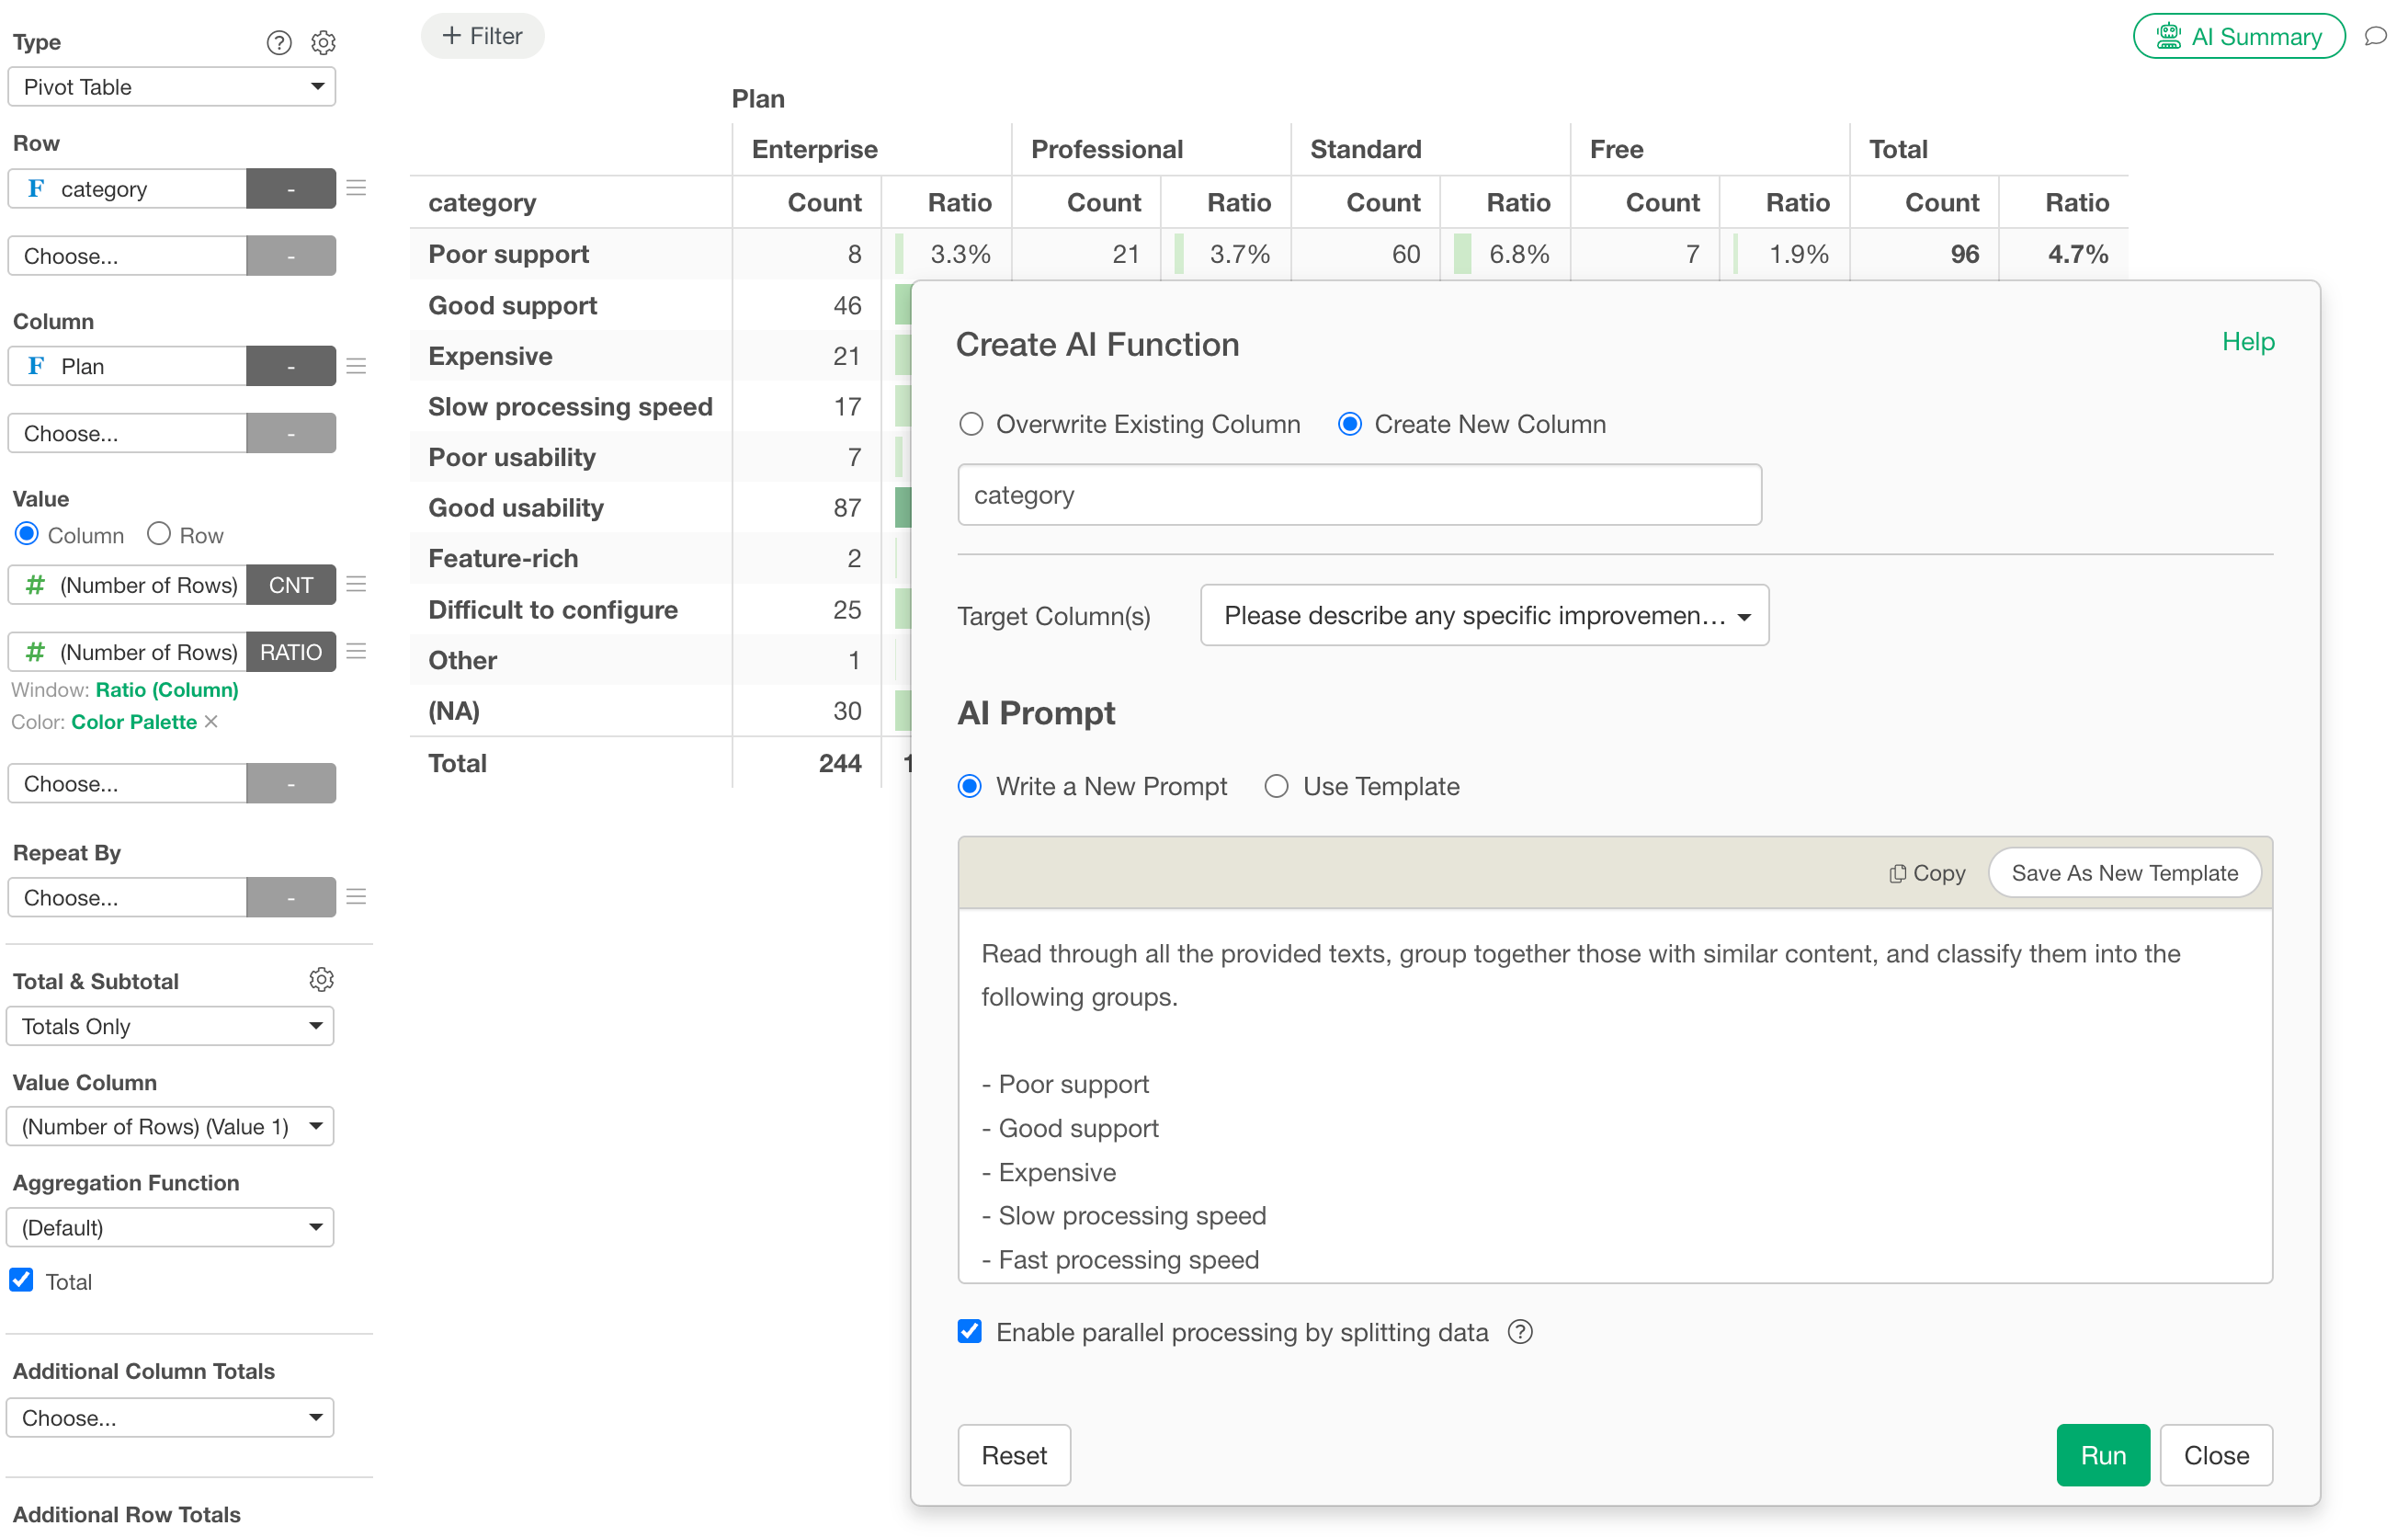
Sentiment Analysis
Classify comments as positive, negative, or neutral to measure how customers and users feel.
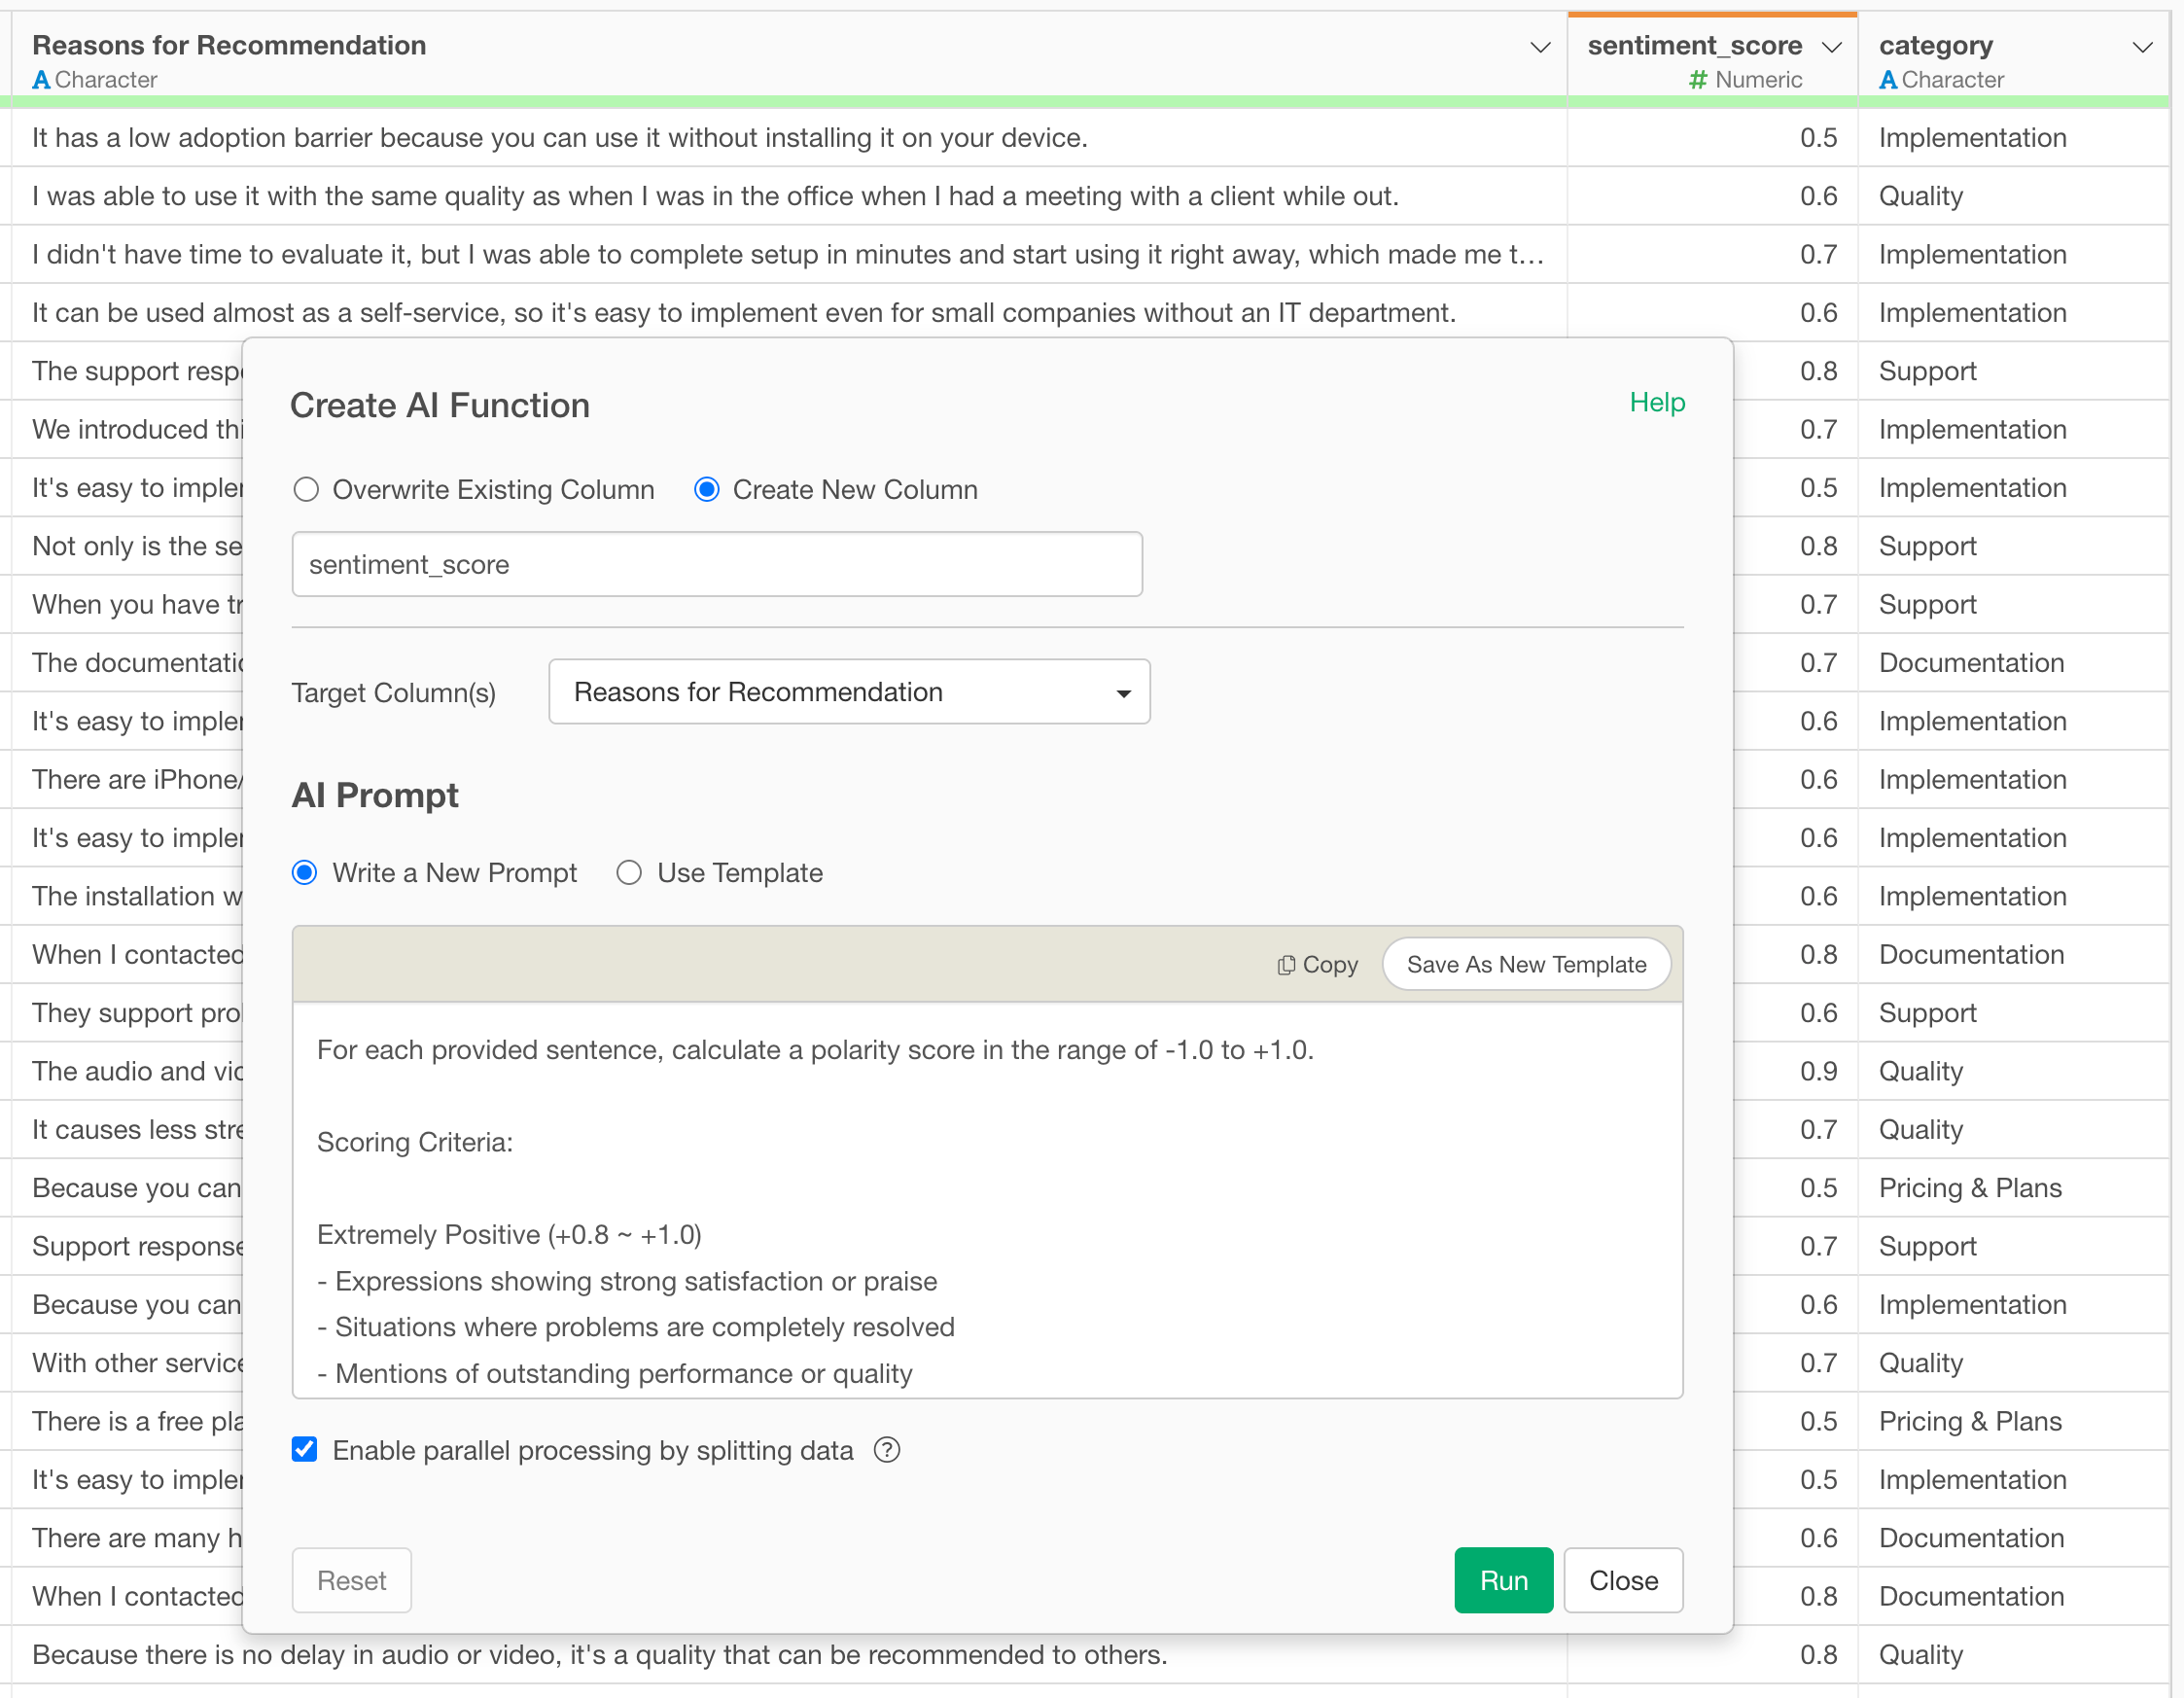
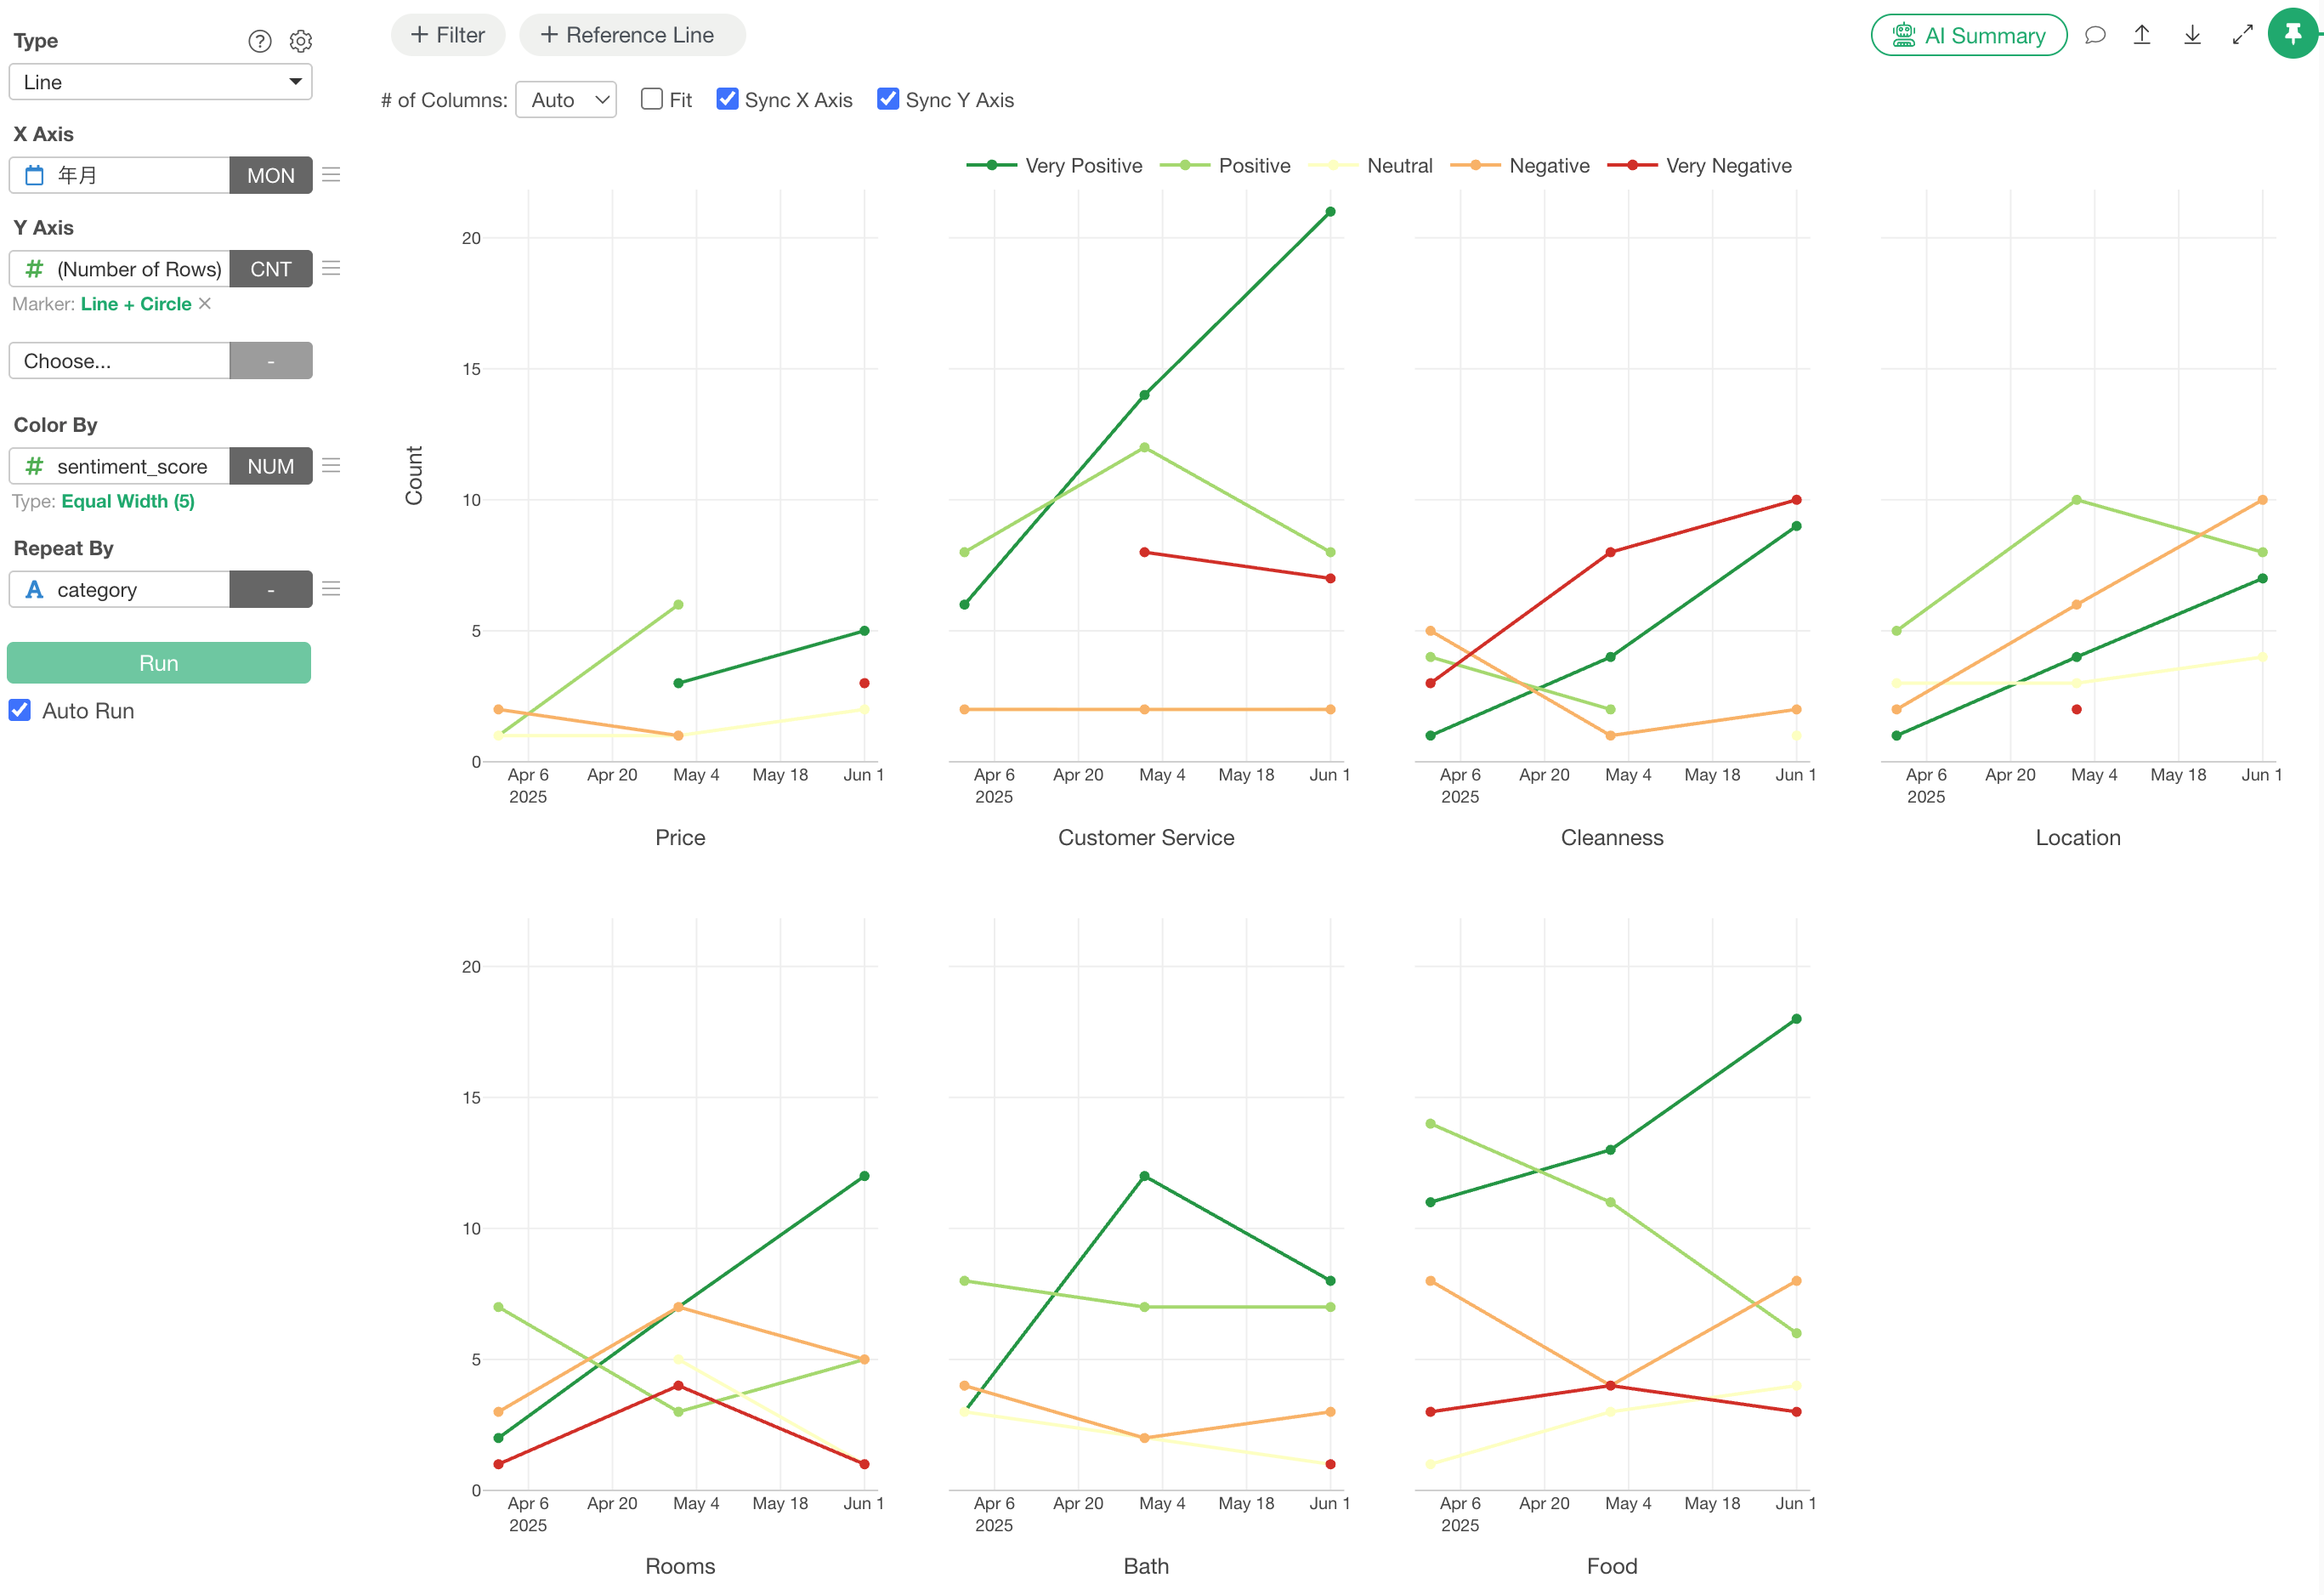
Sentiment Trends
Analyze open-ended responses from tracking surveys over time to follow how customer feedback, complaints, and expectations change.
Go beyond crosstabs to deeper statistical analysis.
Survey analysis does not have to end with toplines and crosstabs.
Once you identify an interesting pattern, Exploratory lets you move directly into statistical and multivariate analysis to better understand what may be driving it.
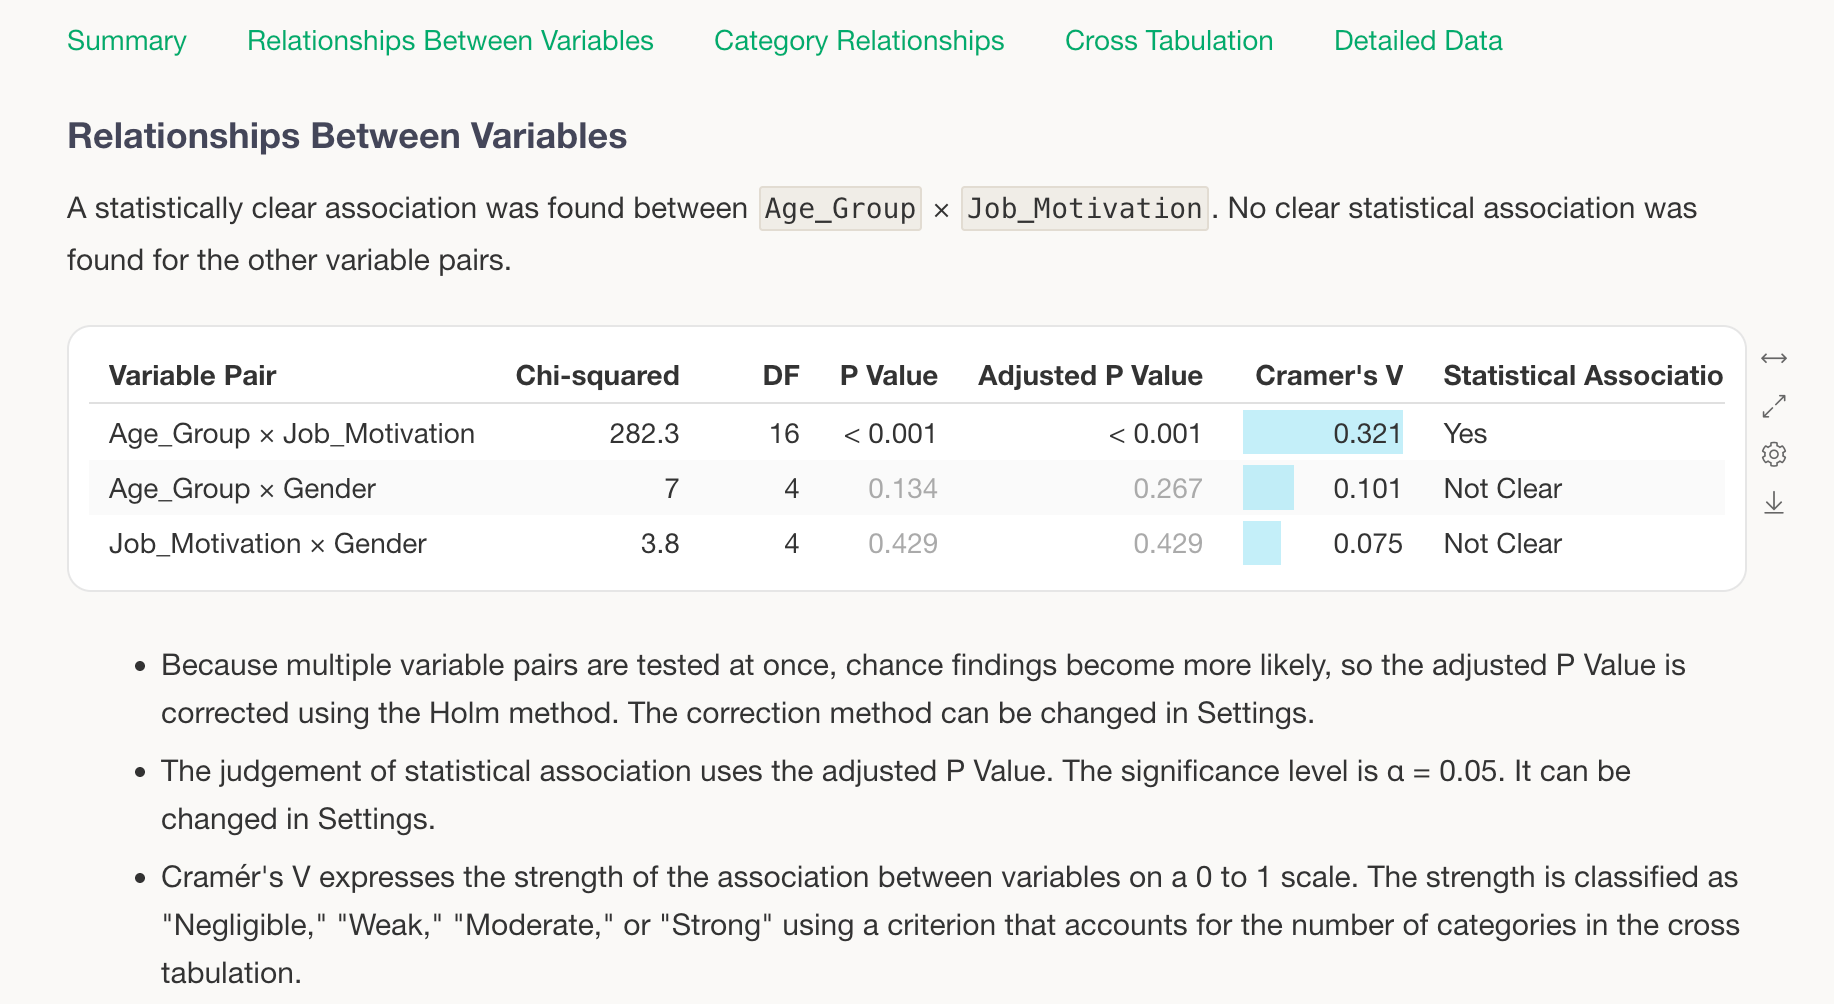
Significance Testing
When you find differences between groups, use statistical tests to evaluate whether those differences are likely to reflect meaningful patterns rather than random variation.
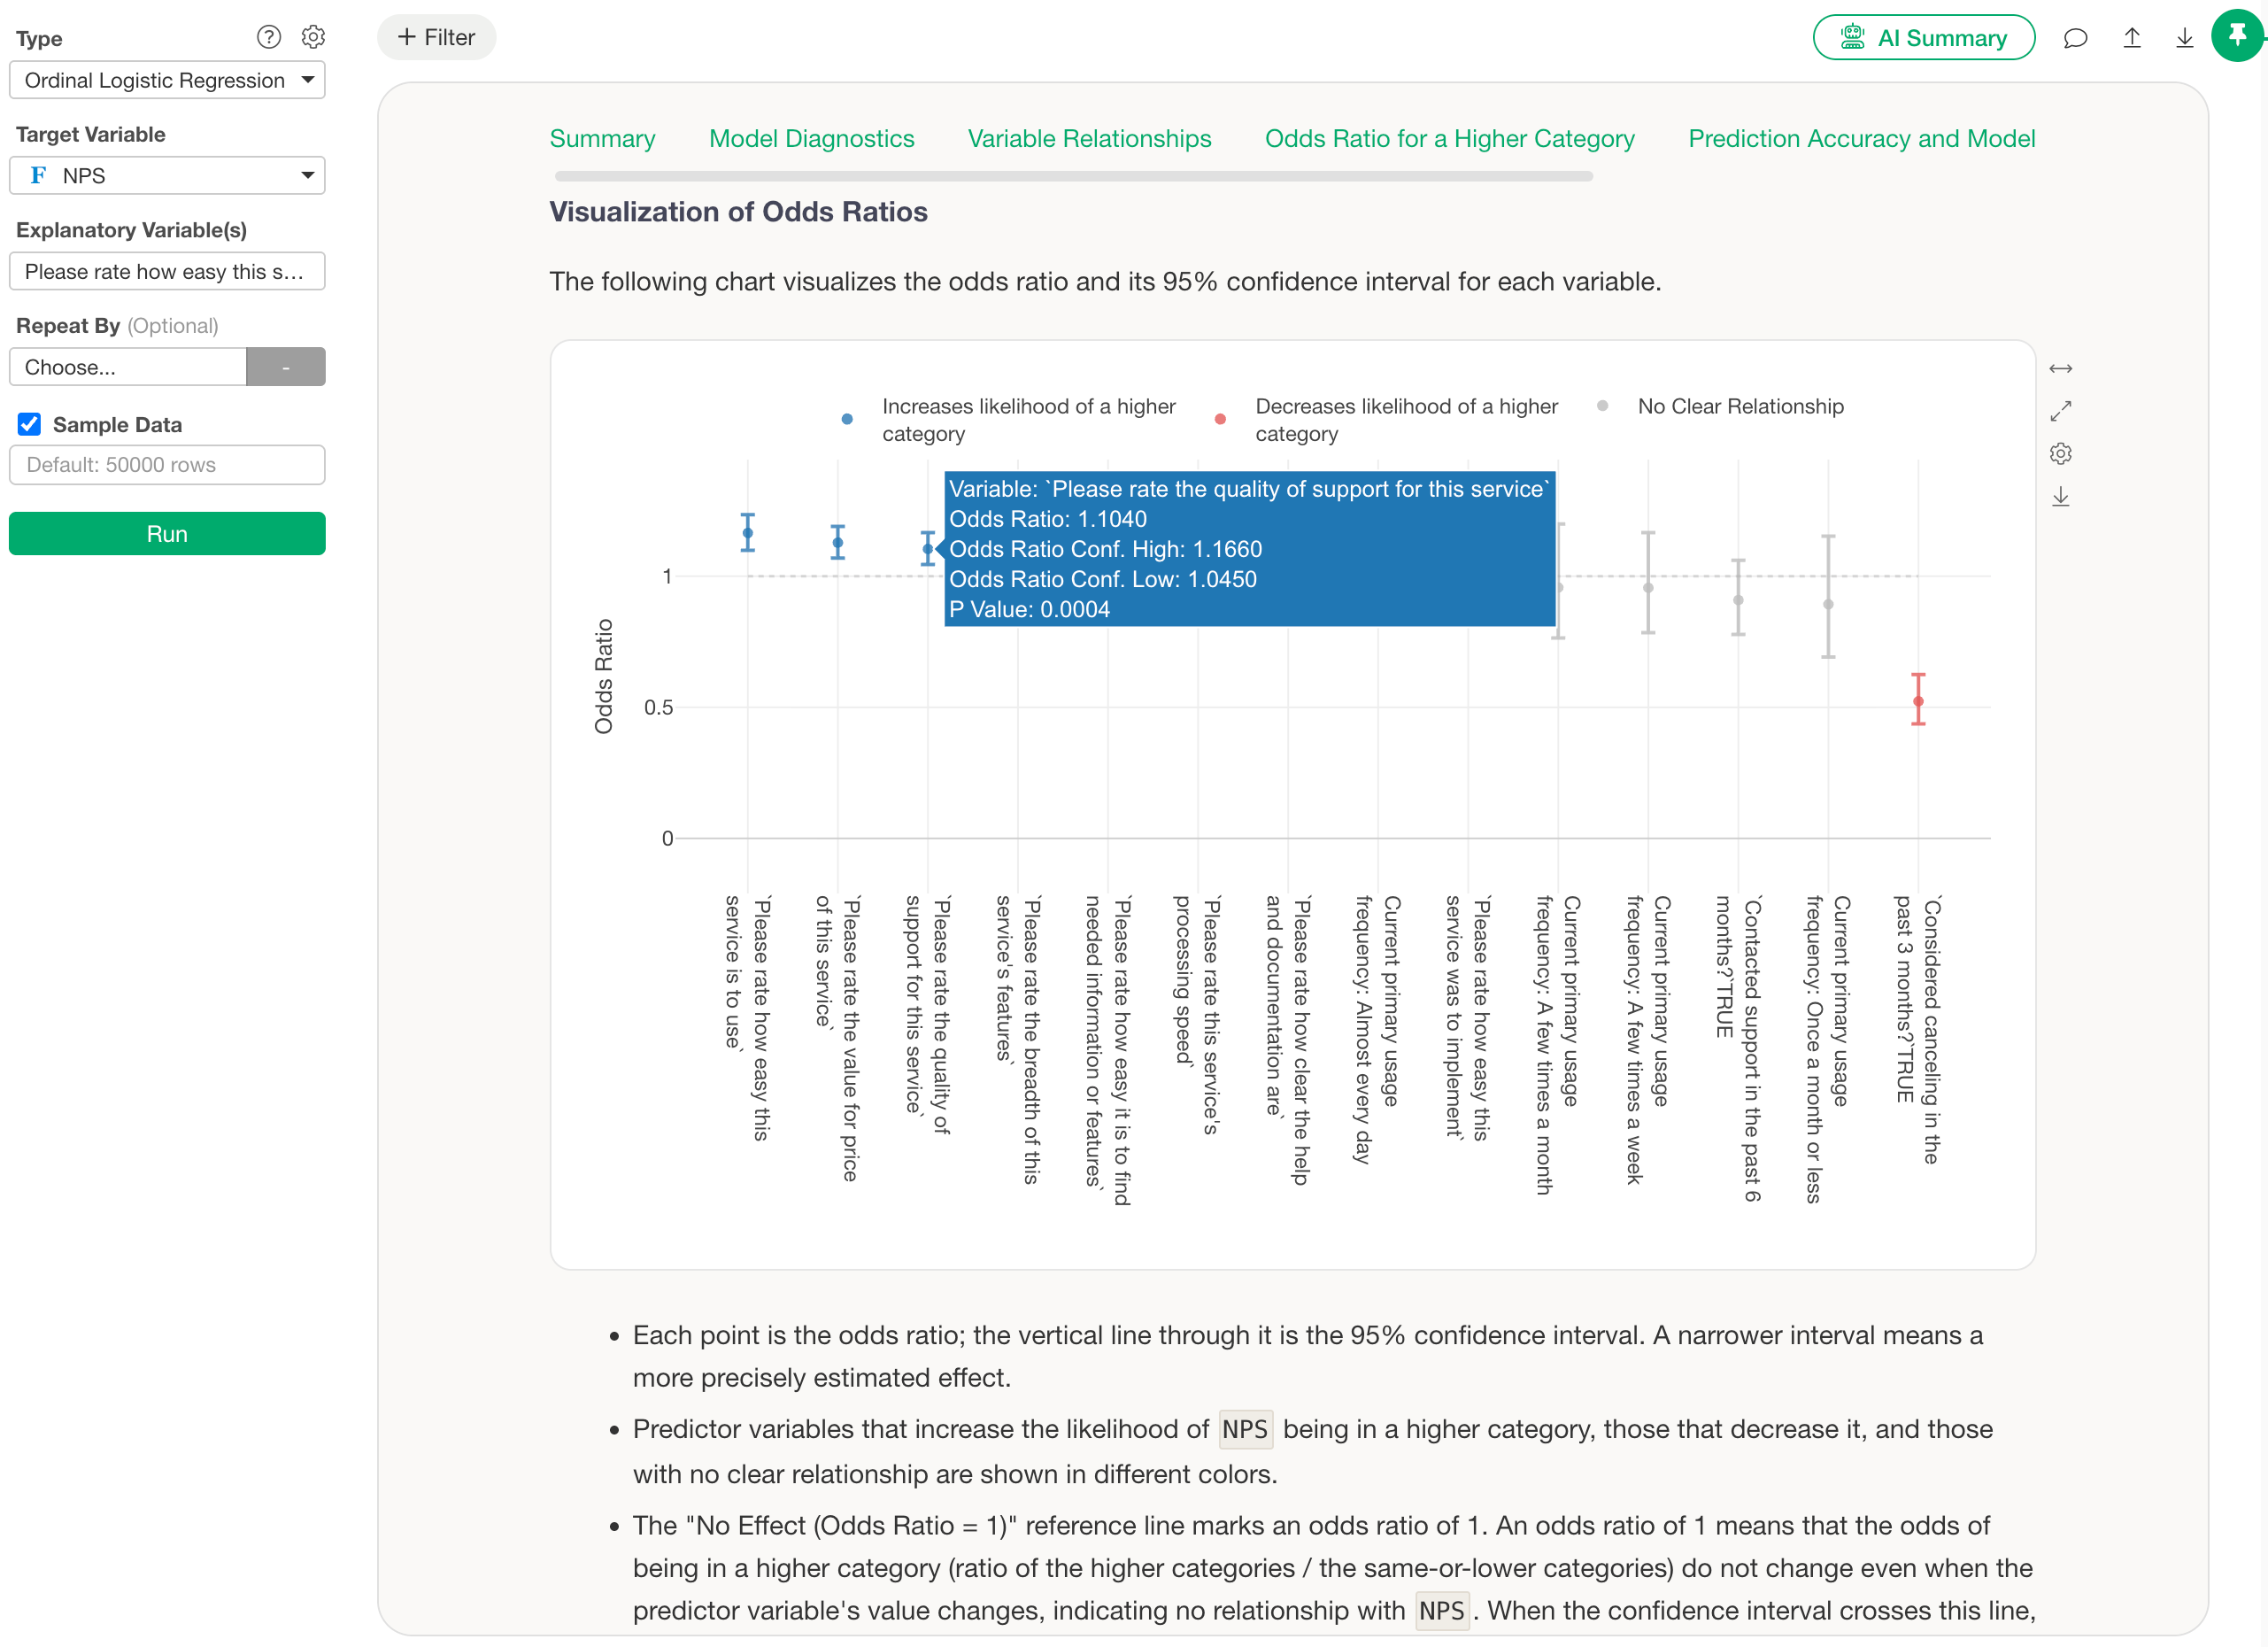
Regression Analysis
Examine which variables are associated with outcomes such as satisfaction or purchase intent while accounting for multiple factors at the same time.
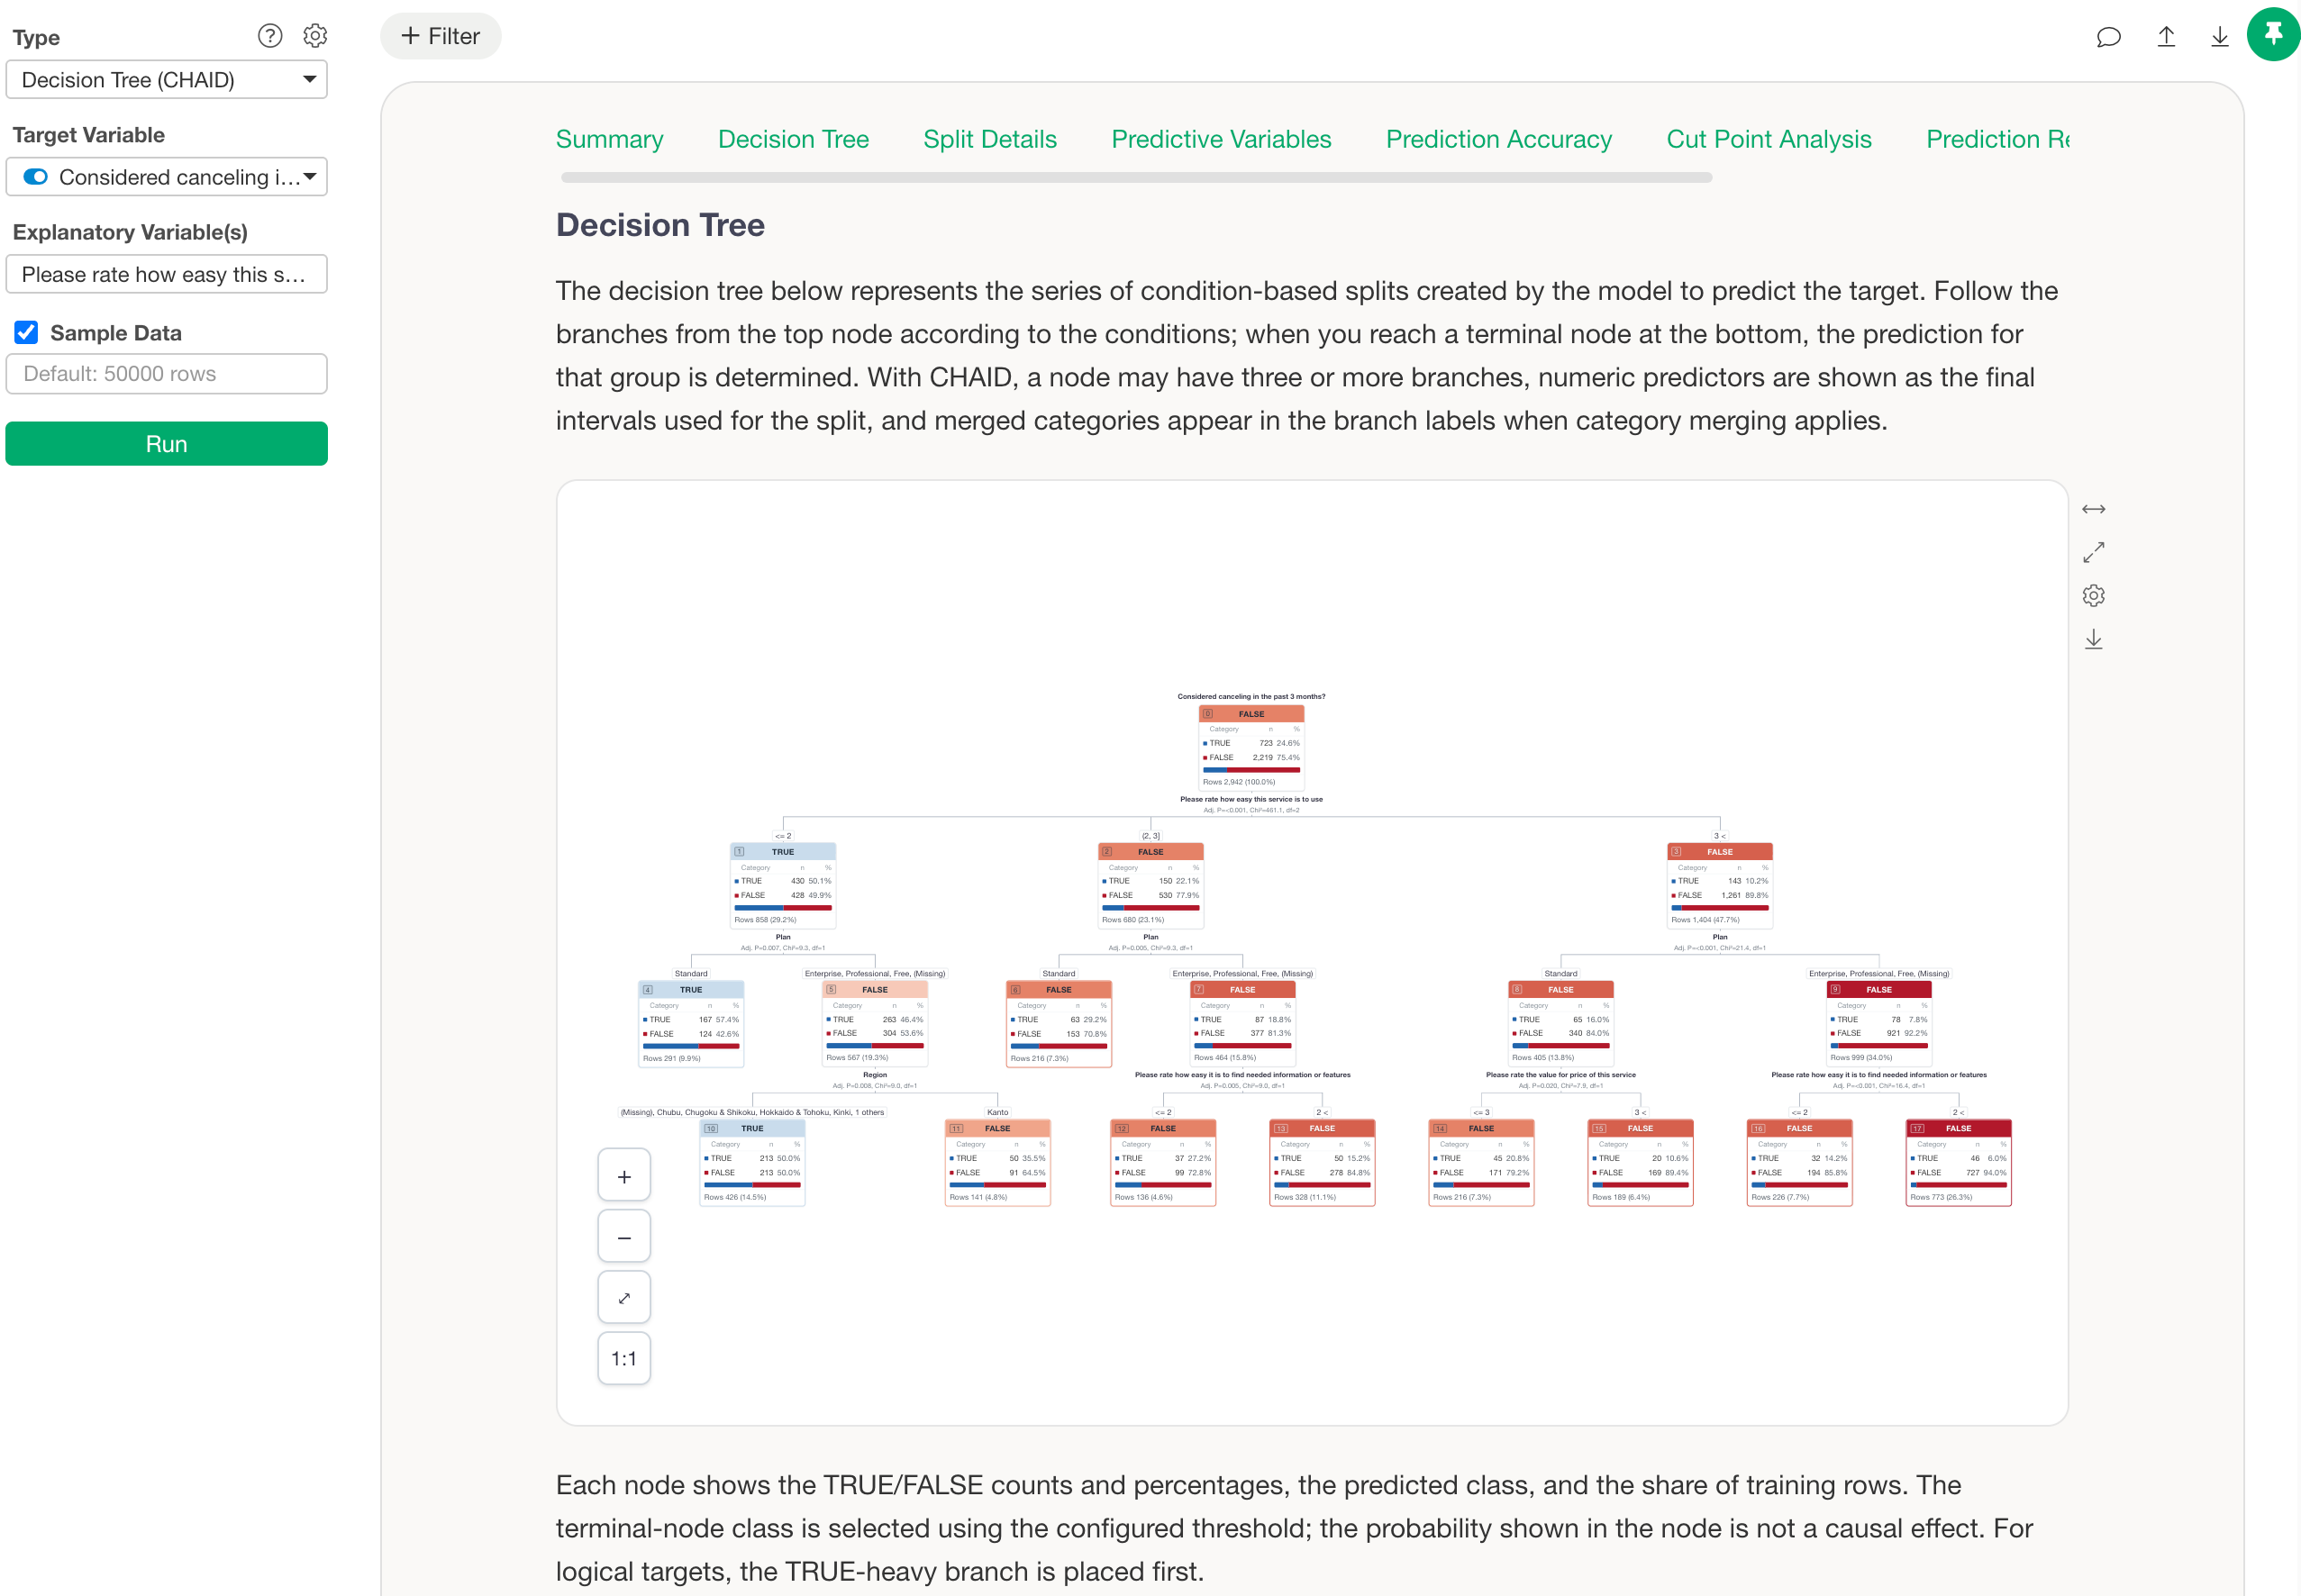
Decision Trees
Identify the conditions associated with different response patterns and explore them through an intuitive tree structure.
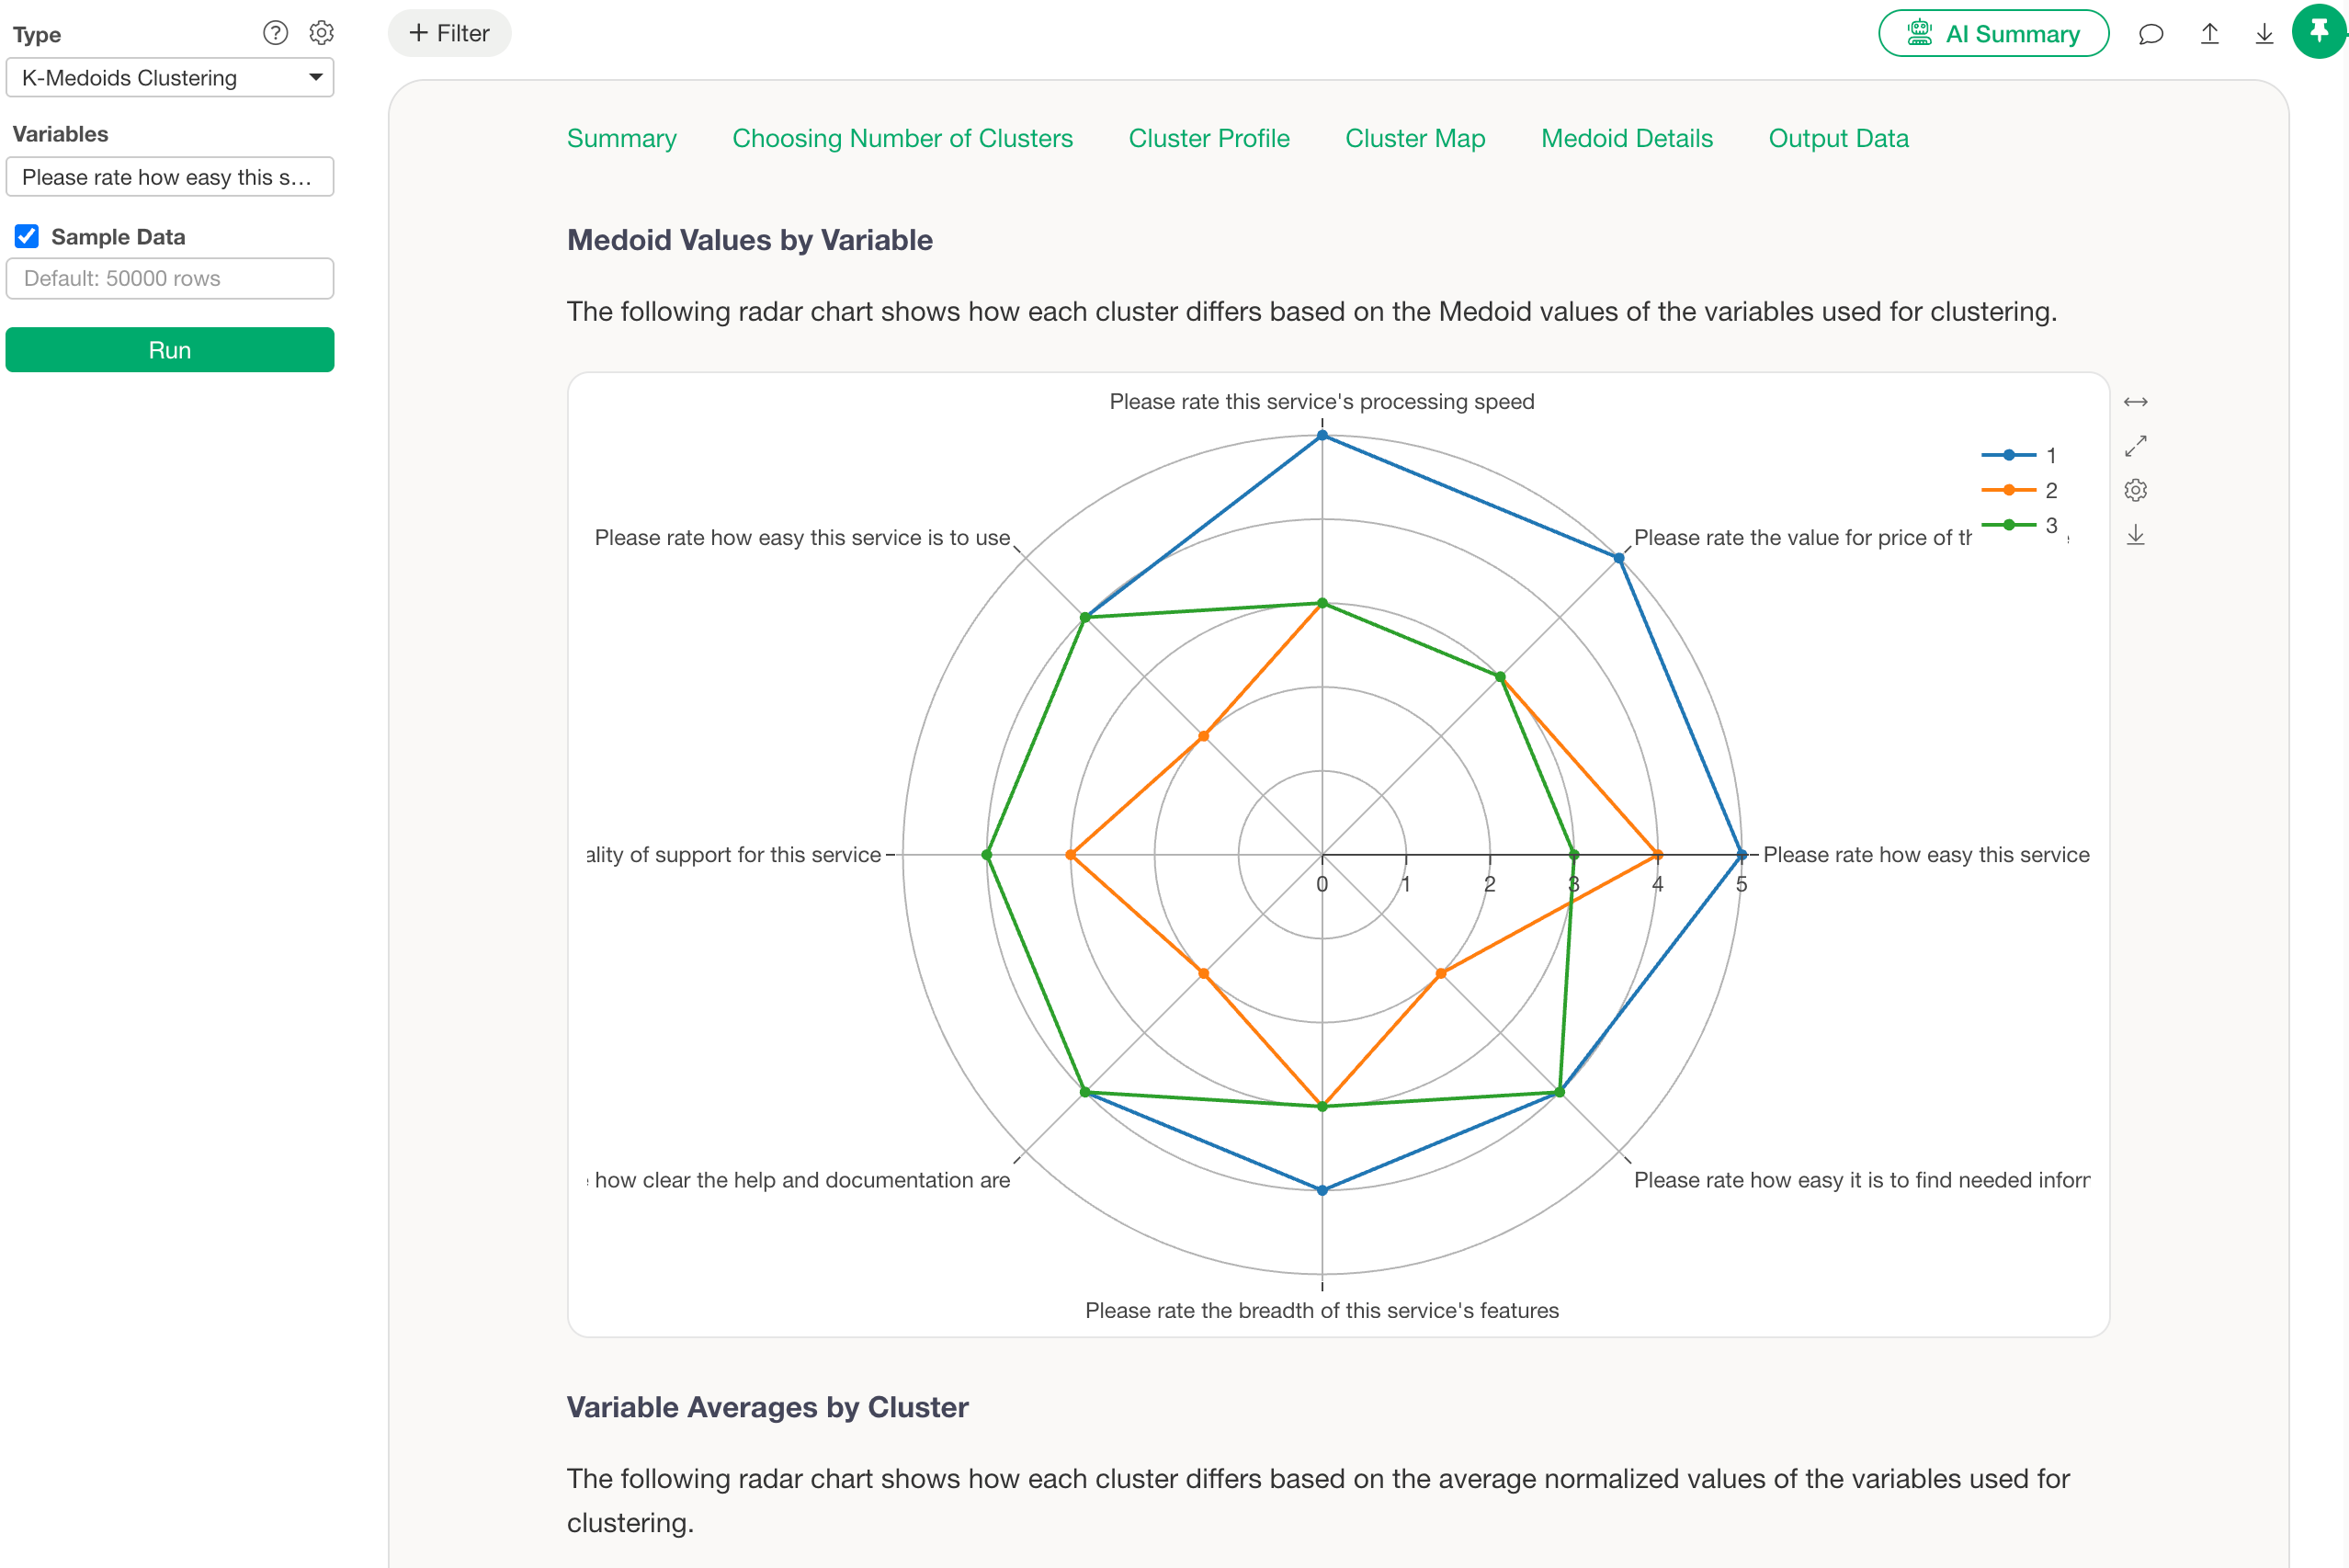
Clustering
Group respondents with similar response patterns to discover customer segments directly from the survey data.
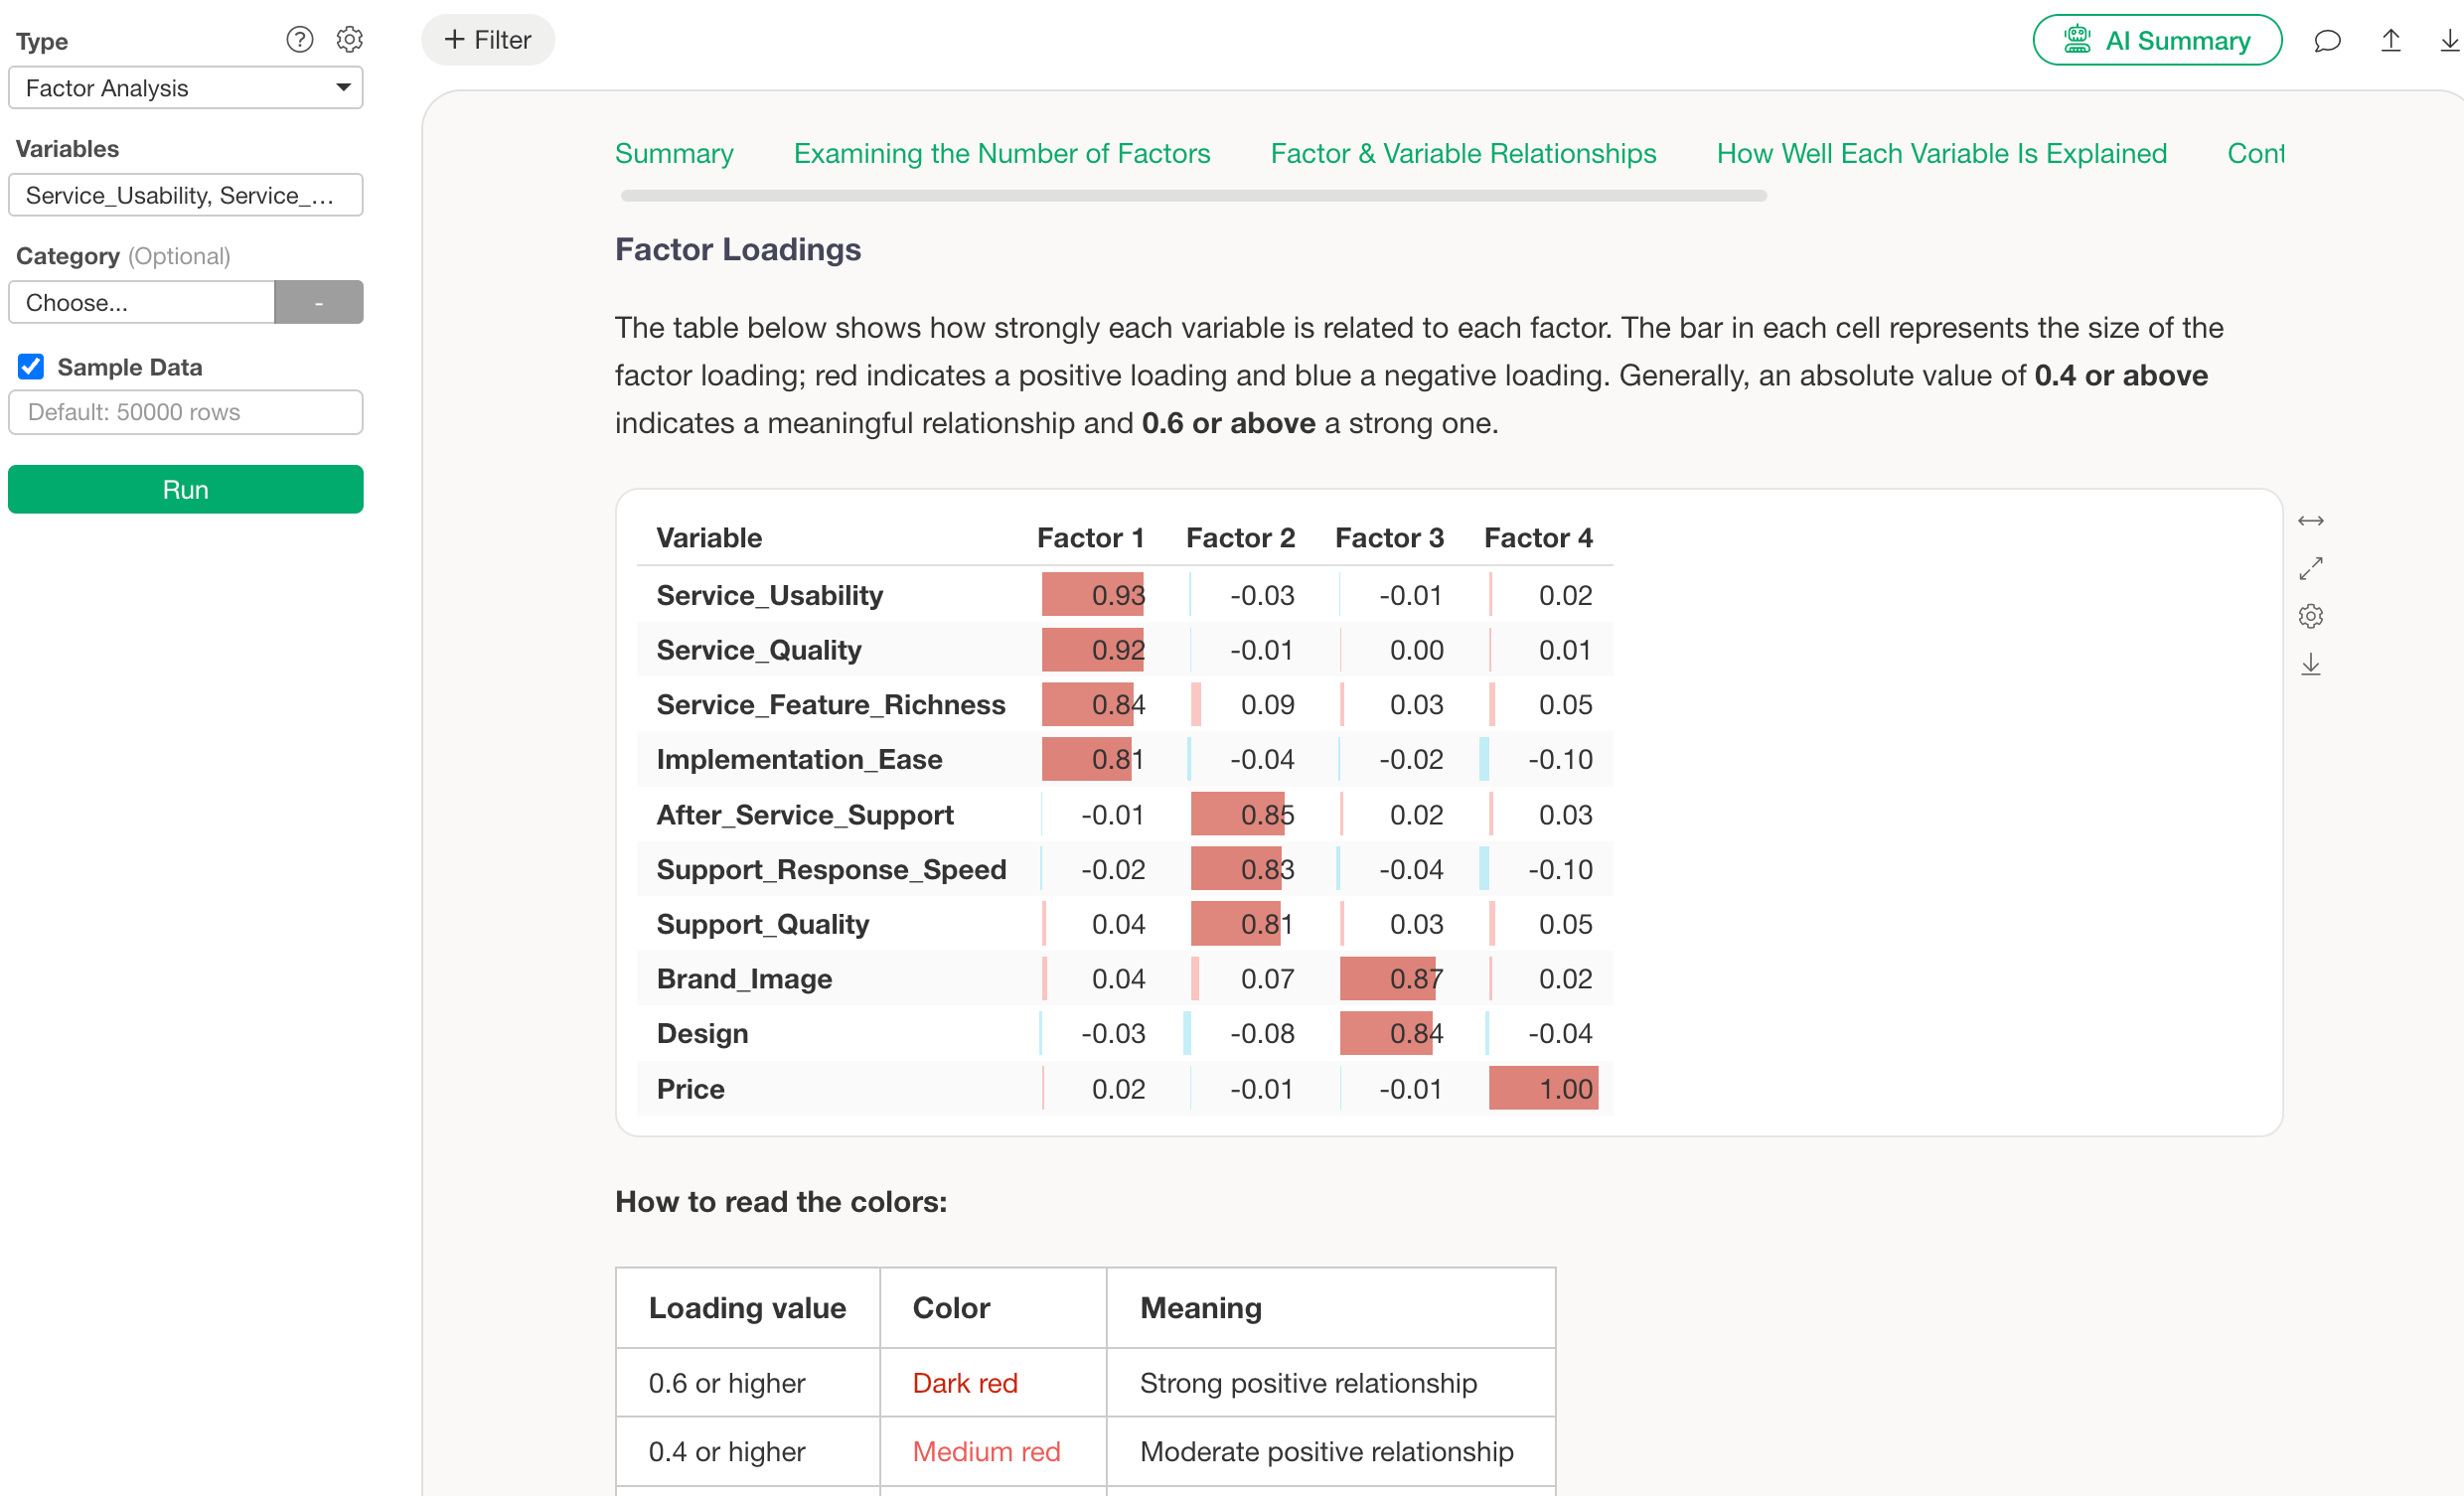
Factor Analysis
Identify common underlying dimensions behind a large number of survey questions and uncover the broader themes shaping respondent attitudes.
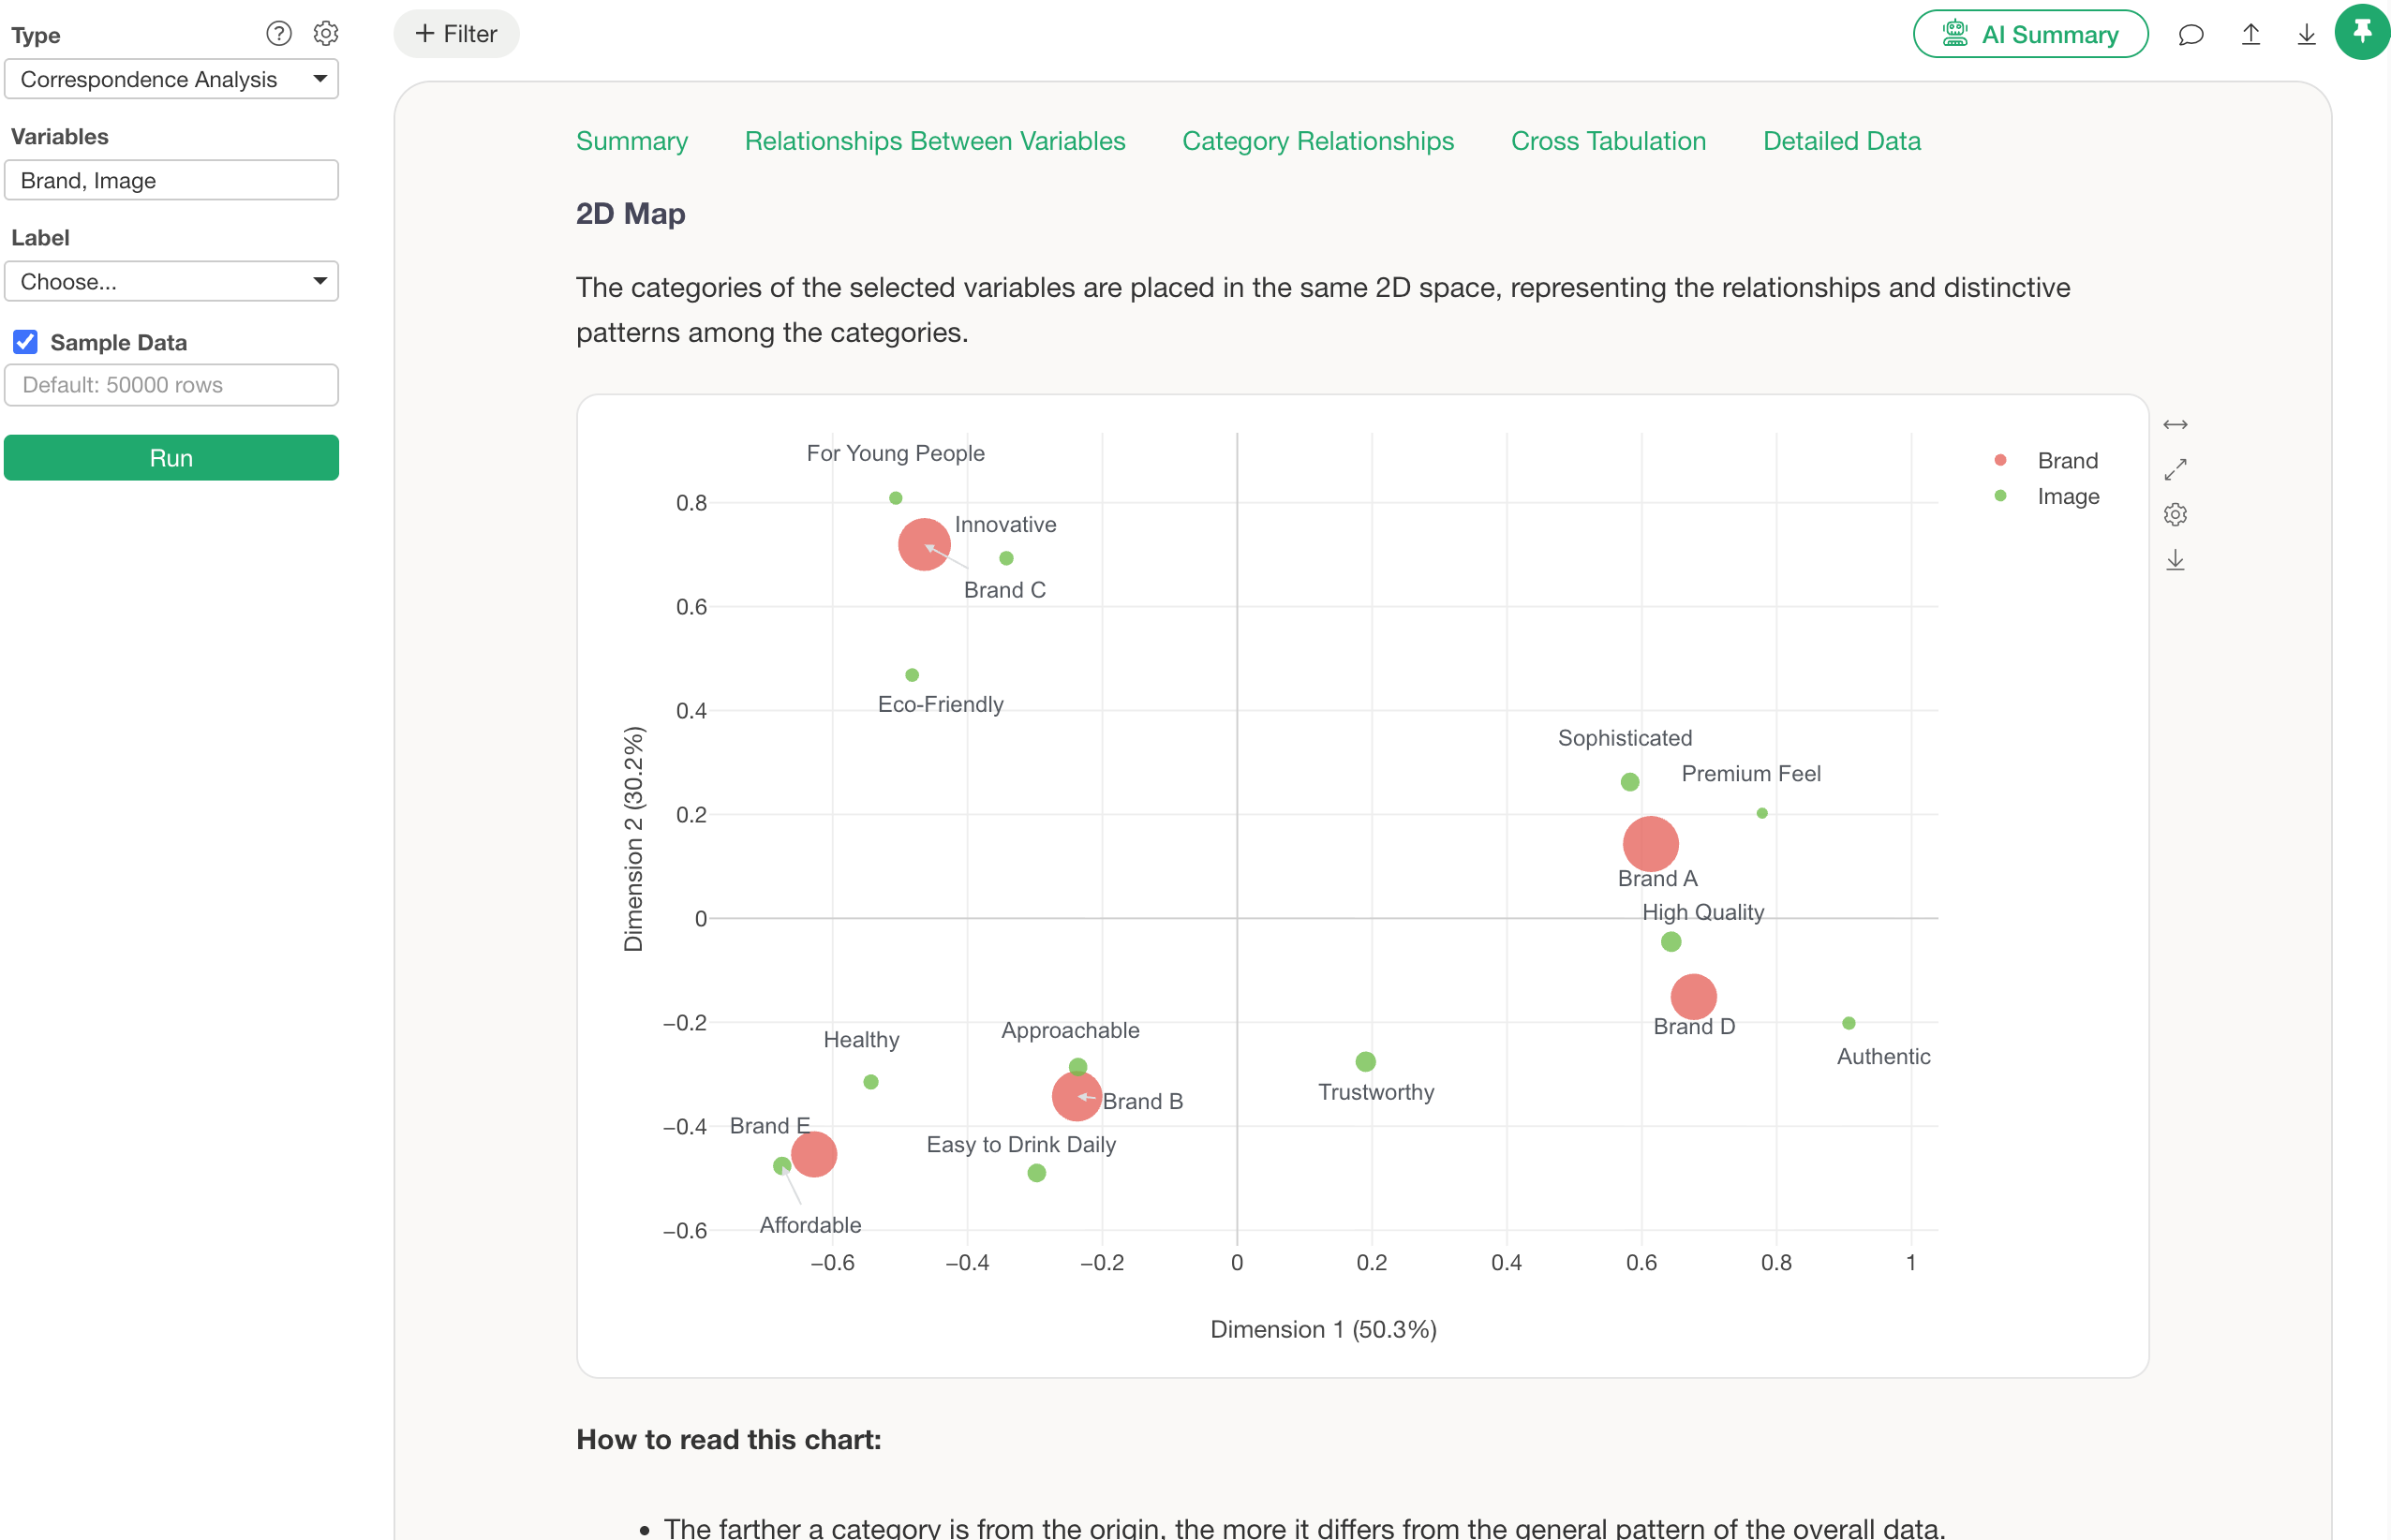
Correspondence Analysis
Visualize relationships among brands, categories, or response choices on a map to better understand their relative positioning.
Built for both in-house research teams and research agencies.
Turn repetitive survey processing, reporting, and analysis into a consistent workflow—whether you are running your own surveys or delivering research for clients.
In a demo, you’ll see a complete survey analysis workflow.
In the demo, we will show you how survey data exported from different platforms can be prepared, summarized, analyzed, and turned into reports within a reproducible workflow.
What you’ll see
- Importing survey data from CSV and Excel
- Cleaning question and response labels
- Analyzing multiple-response questions
- Creating topline tables
- Building crosstabs
- Calculating Top 2 Box, Bottom 2 Box, and Net metrics
We can also cover
- Preparing data with AI or the UI
- Classifying and summarizing open-ended responses with AI
- Creating reports with AI
- Exporting tables to Excel
- Refreshing the analysis with new survey data
- Designing reusable survey analysis workflows
Frequently asked questions
Answers to the questions we hear most often before teams get started.