Build Your Entire Analytics Workflow in One Place
Exploratory Desktop is where you build and analyze your data through a transparent and reproducible workflow.
Use AI and an intuitive visual interface to prepare data, create visualizations, run statistical and machine learning analyses, and build dashboards and reports—all while keeping every step connected and editable.
Use AI and an intuitive visual interface to prepare data, create visualizations, run statistical and machine learning analyses, and build dashboards and reports—all while keeping every step connected and editable.
Data Science with Exploratory
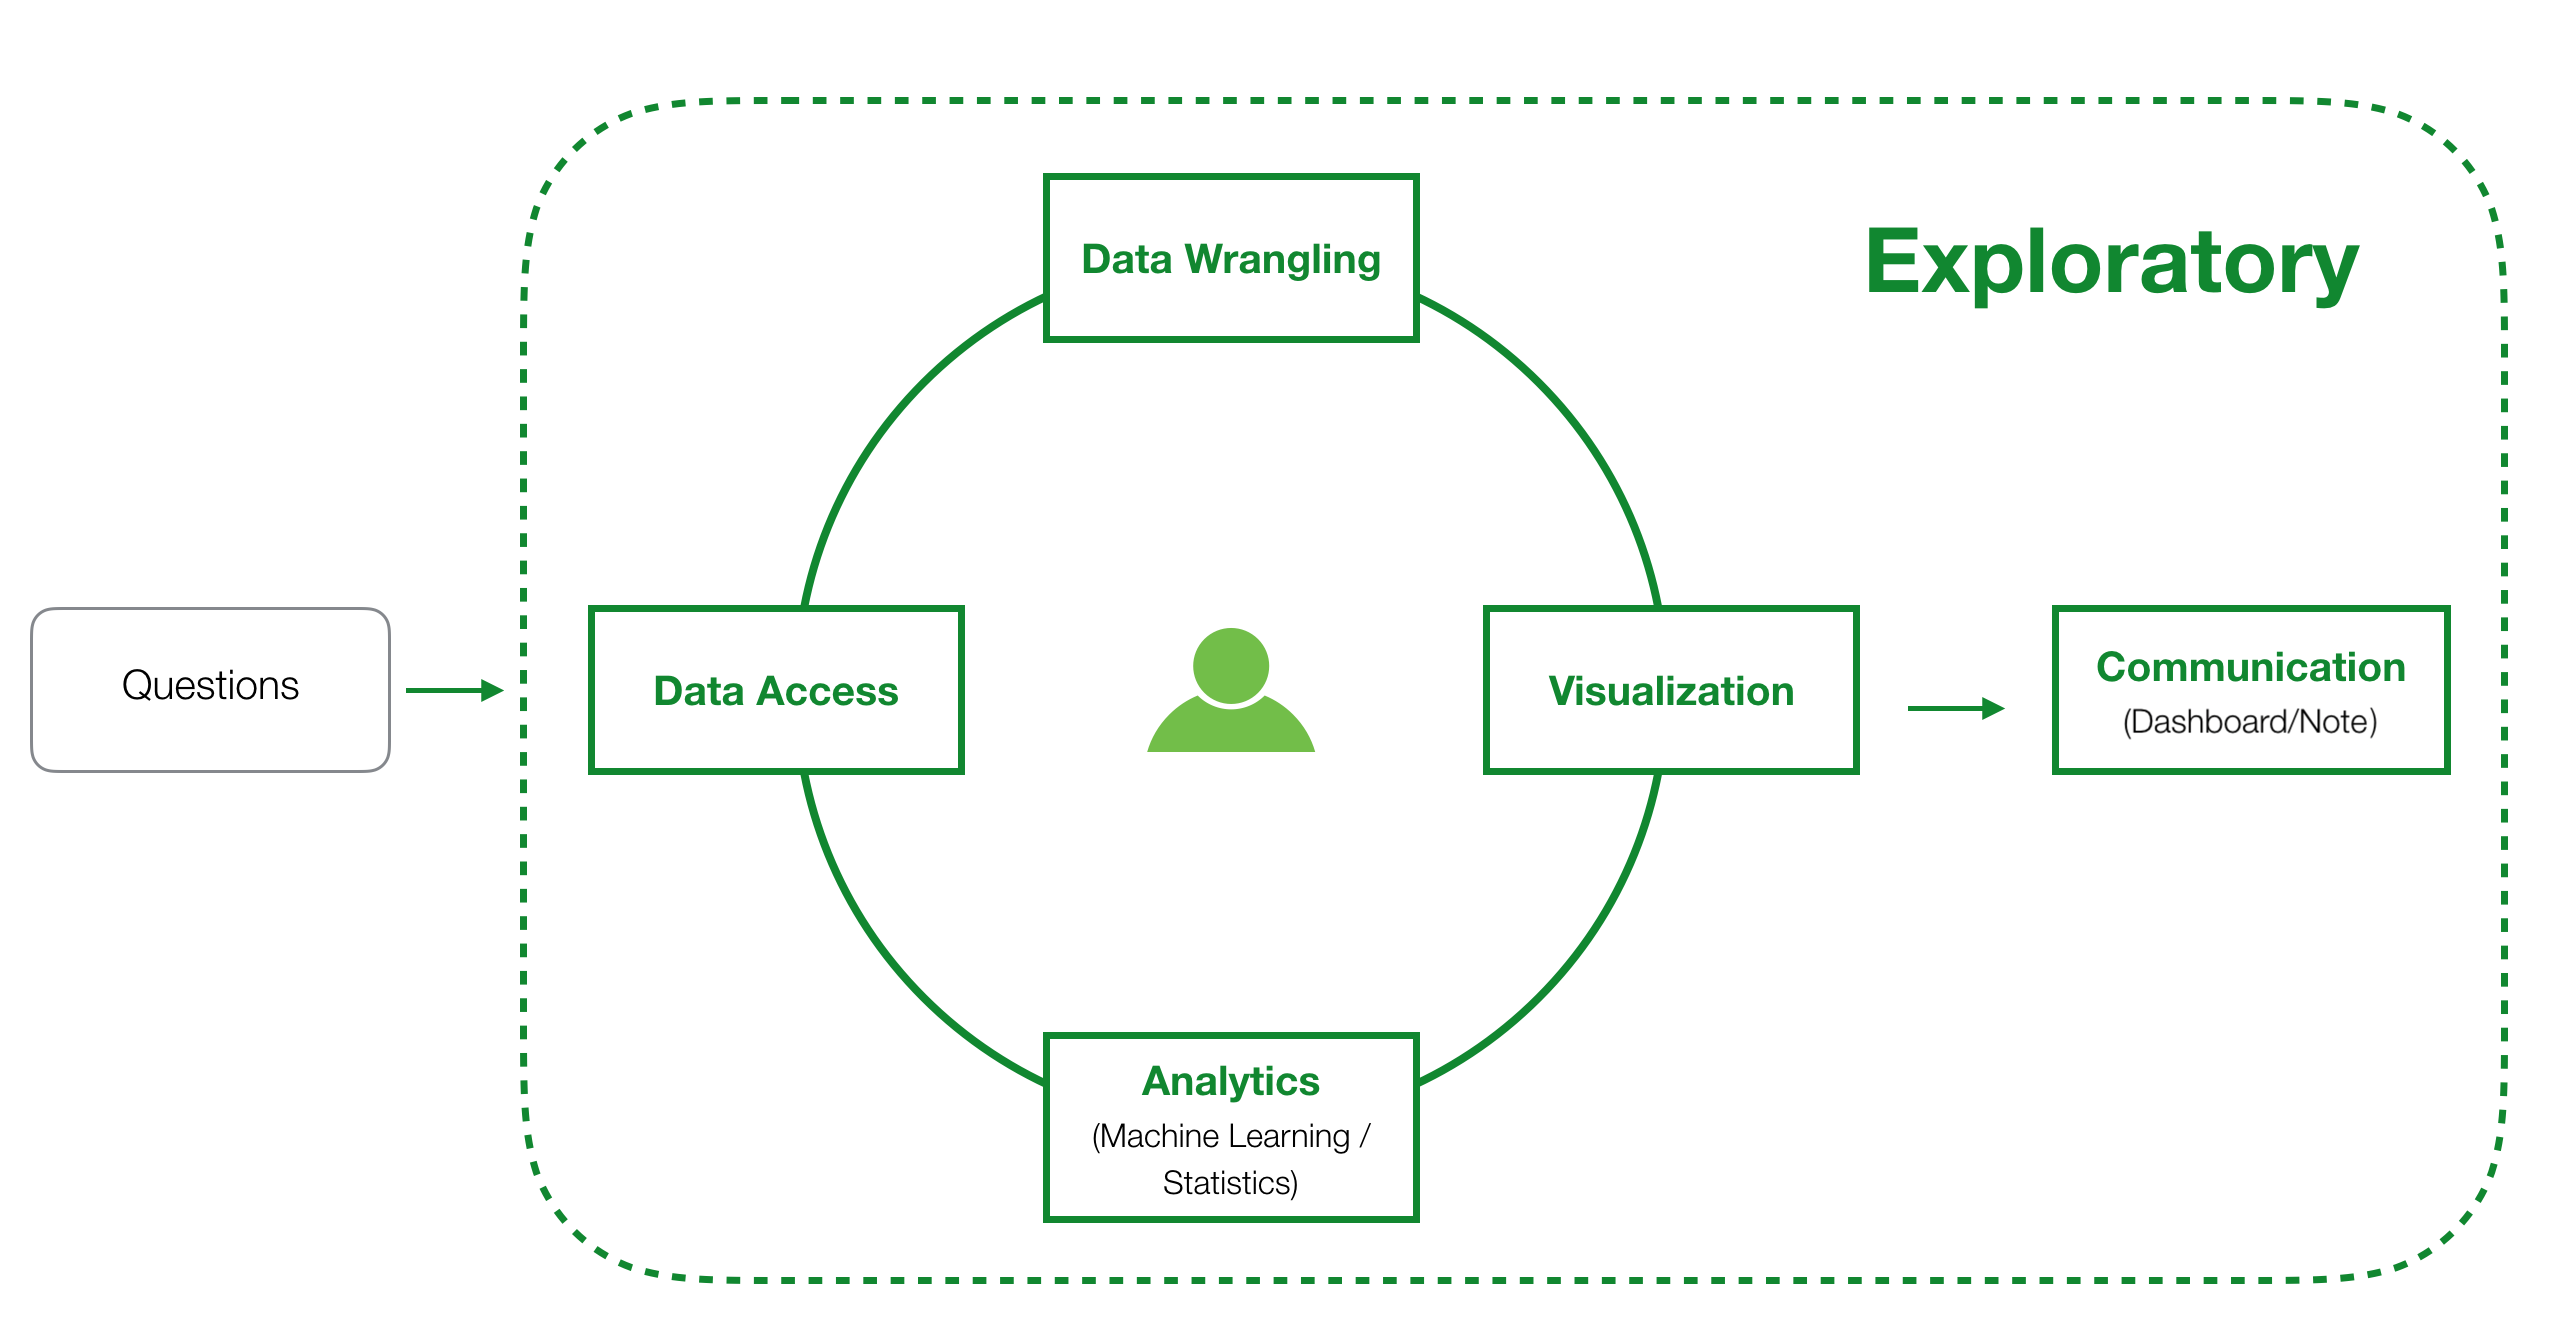
In order to answer business questions with data, you need 5 pillars of Data Science tasks. They are Data Access, Data Wrangling, Visualization, Analytics, and Communication.
Exploratory’s simple UI experience provides not only the best capability in each area but also a natively integrated experience that is designed from the ground up.
Exploratory’s simple UI experience provides not only the best capability in each area but also a natively integrated experience that is designed from the ground up.
Data Access
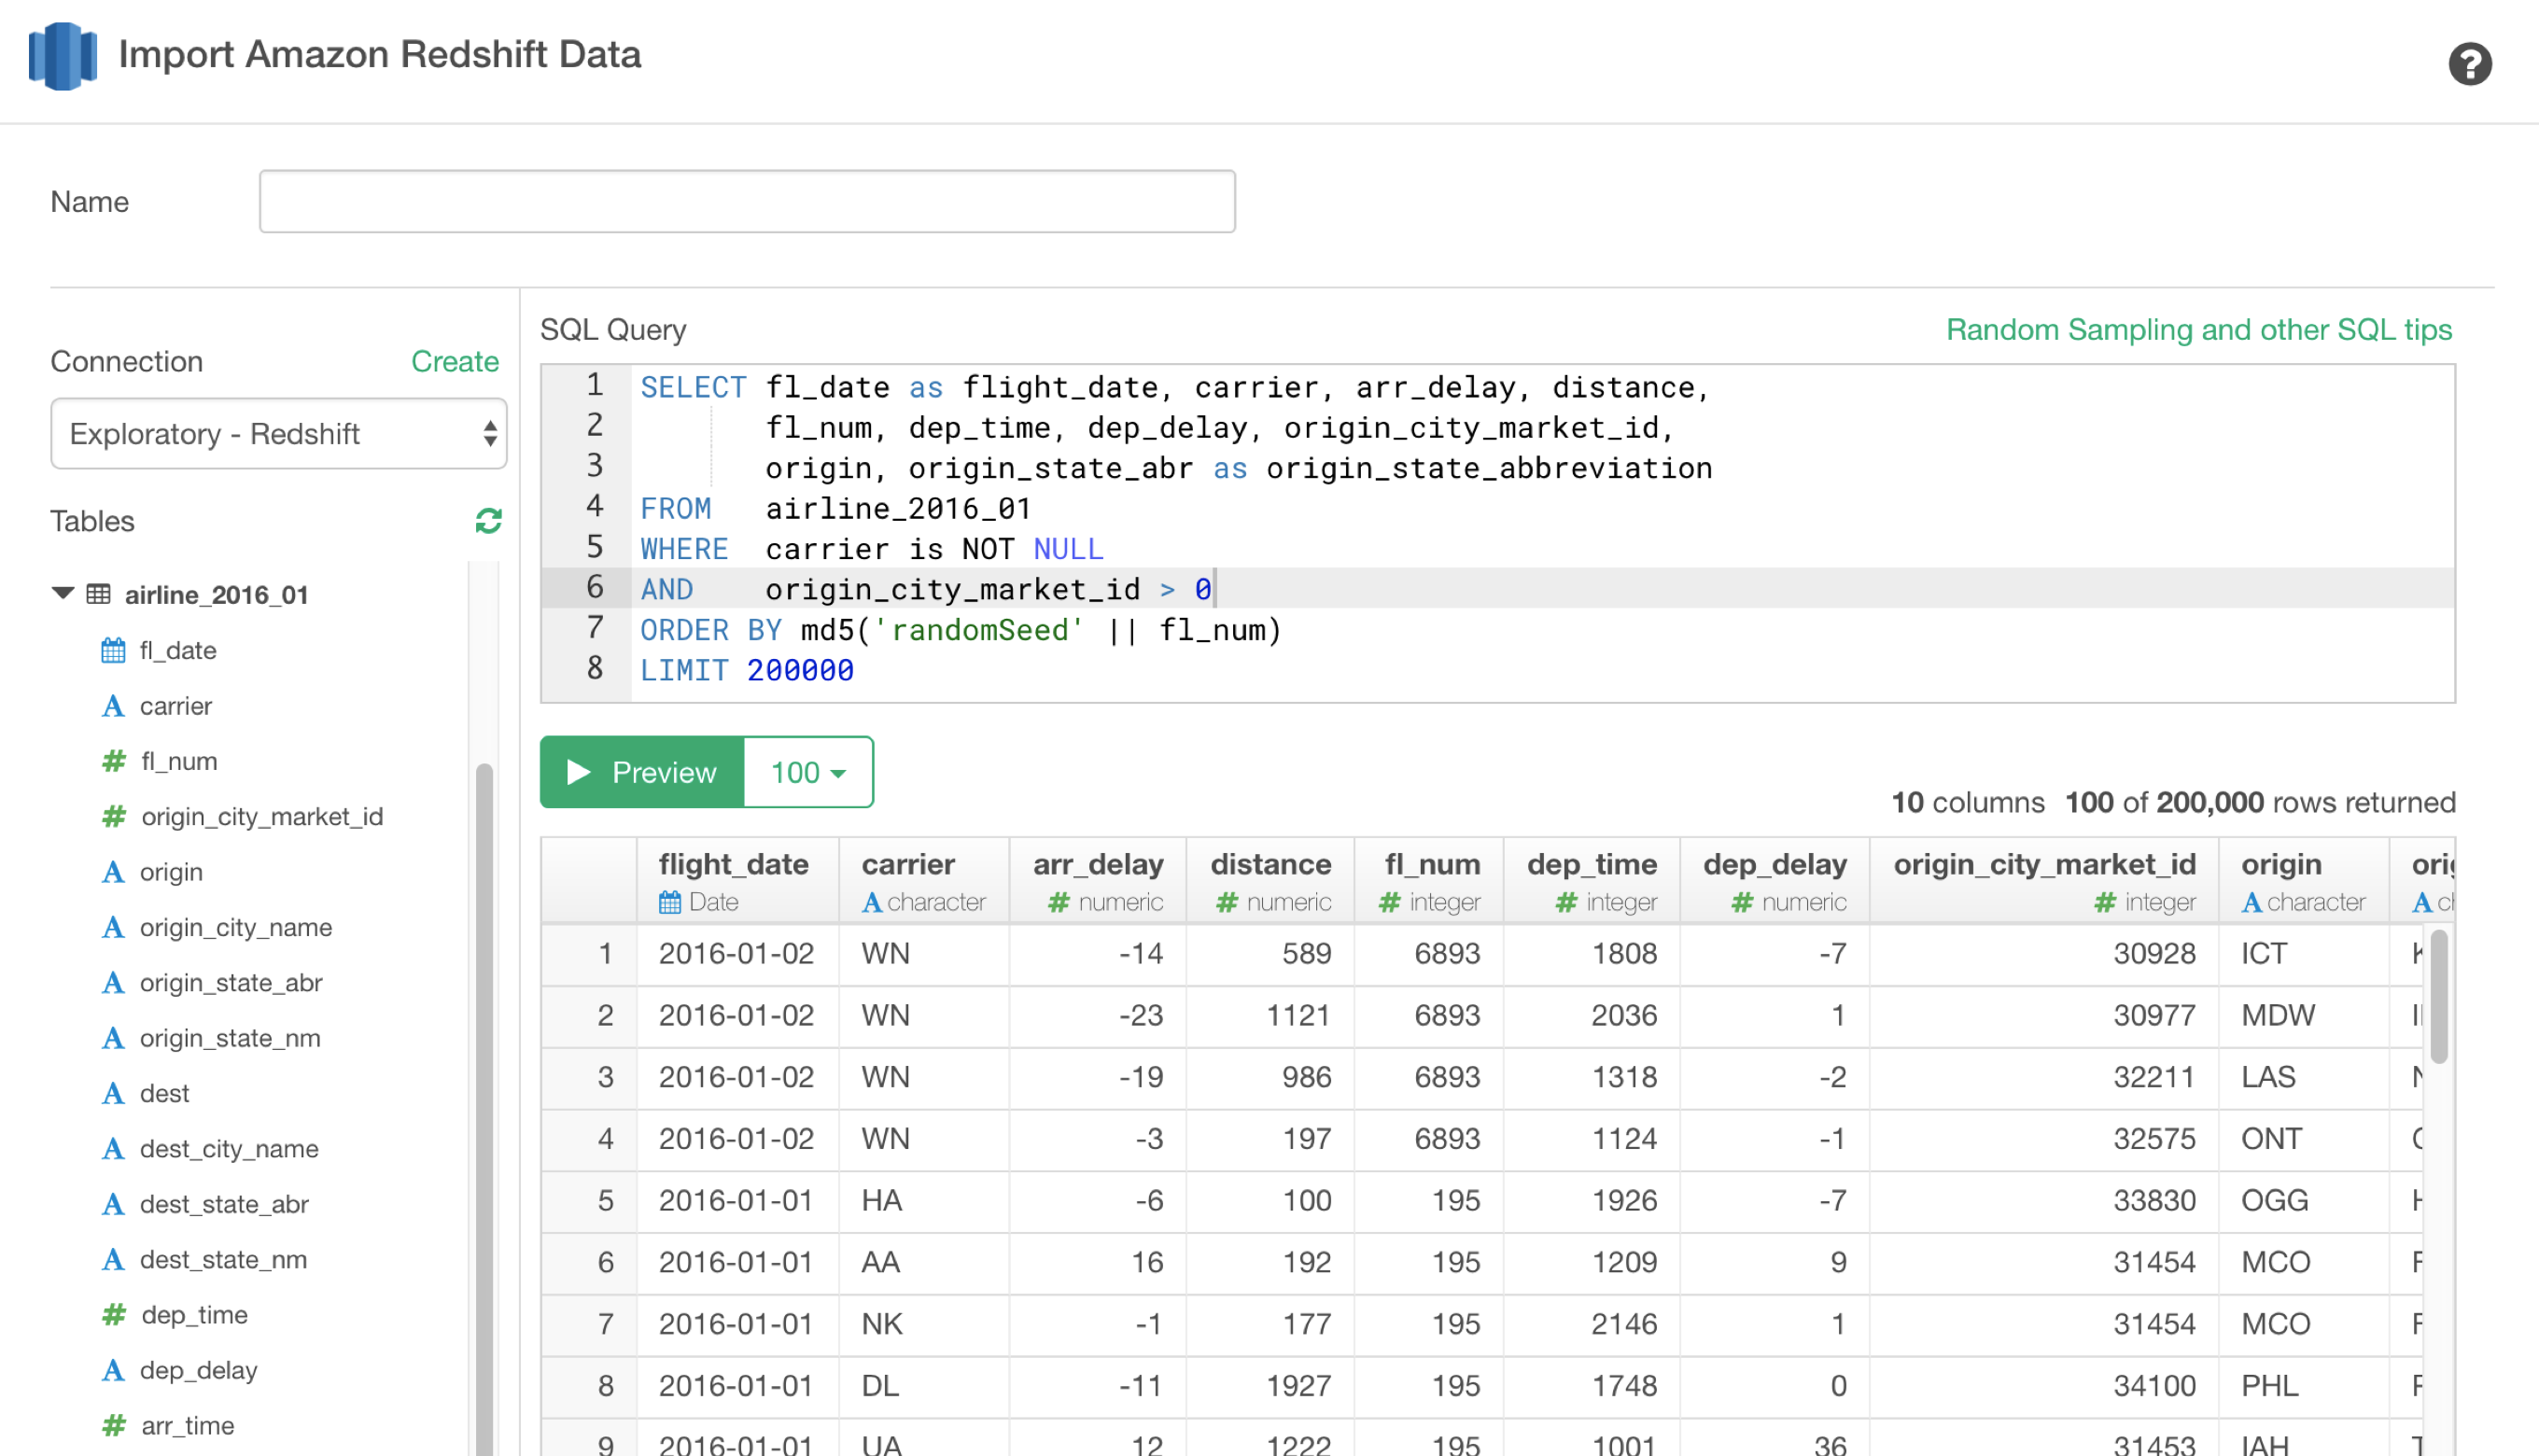
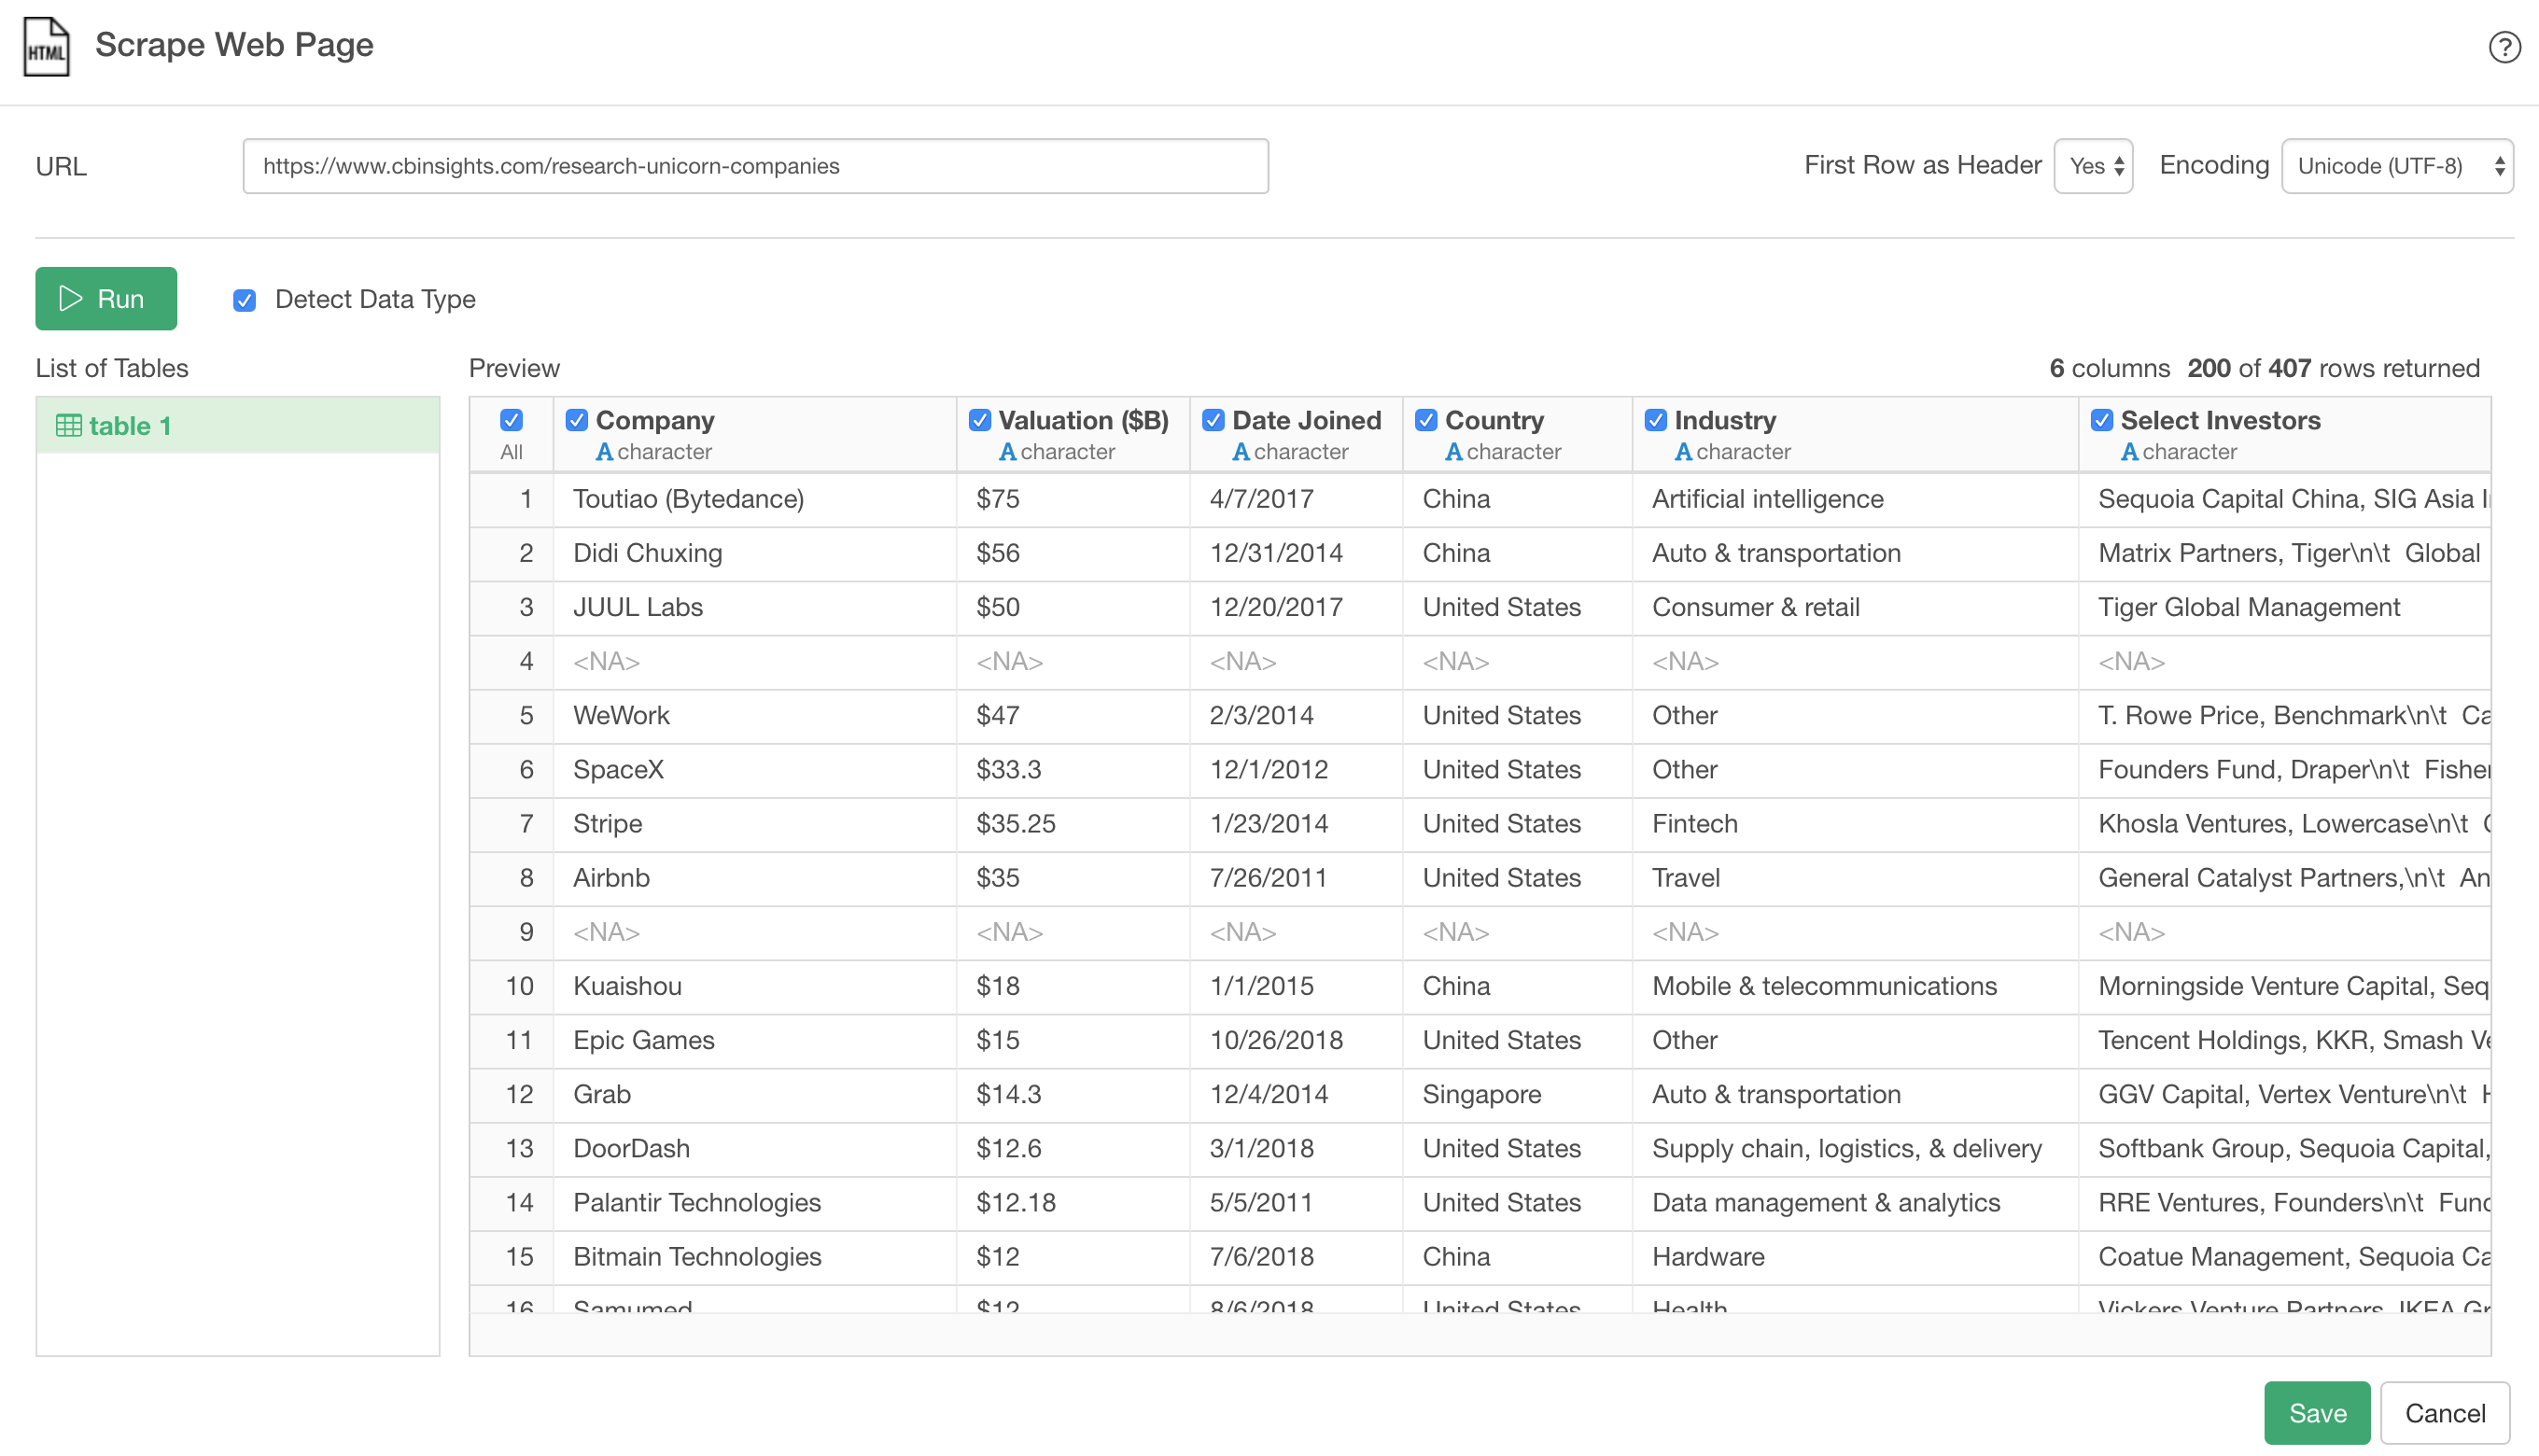
You can quickly extract data from various built-in data sources such as Redshift, BigQuery, PostgreSQL, MySQL, Oracle, SQL Server, Vertica, MongoDB, Presto, Google Analytics, Google Drive, Azure Storage, Amazon S3, Web Scraping, CSV, Excel, JSON, etc.
Summary View
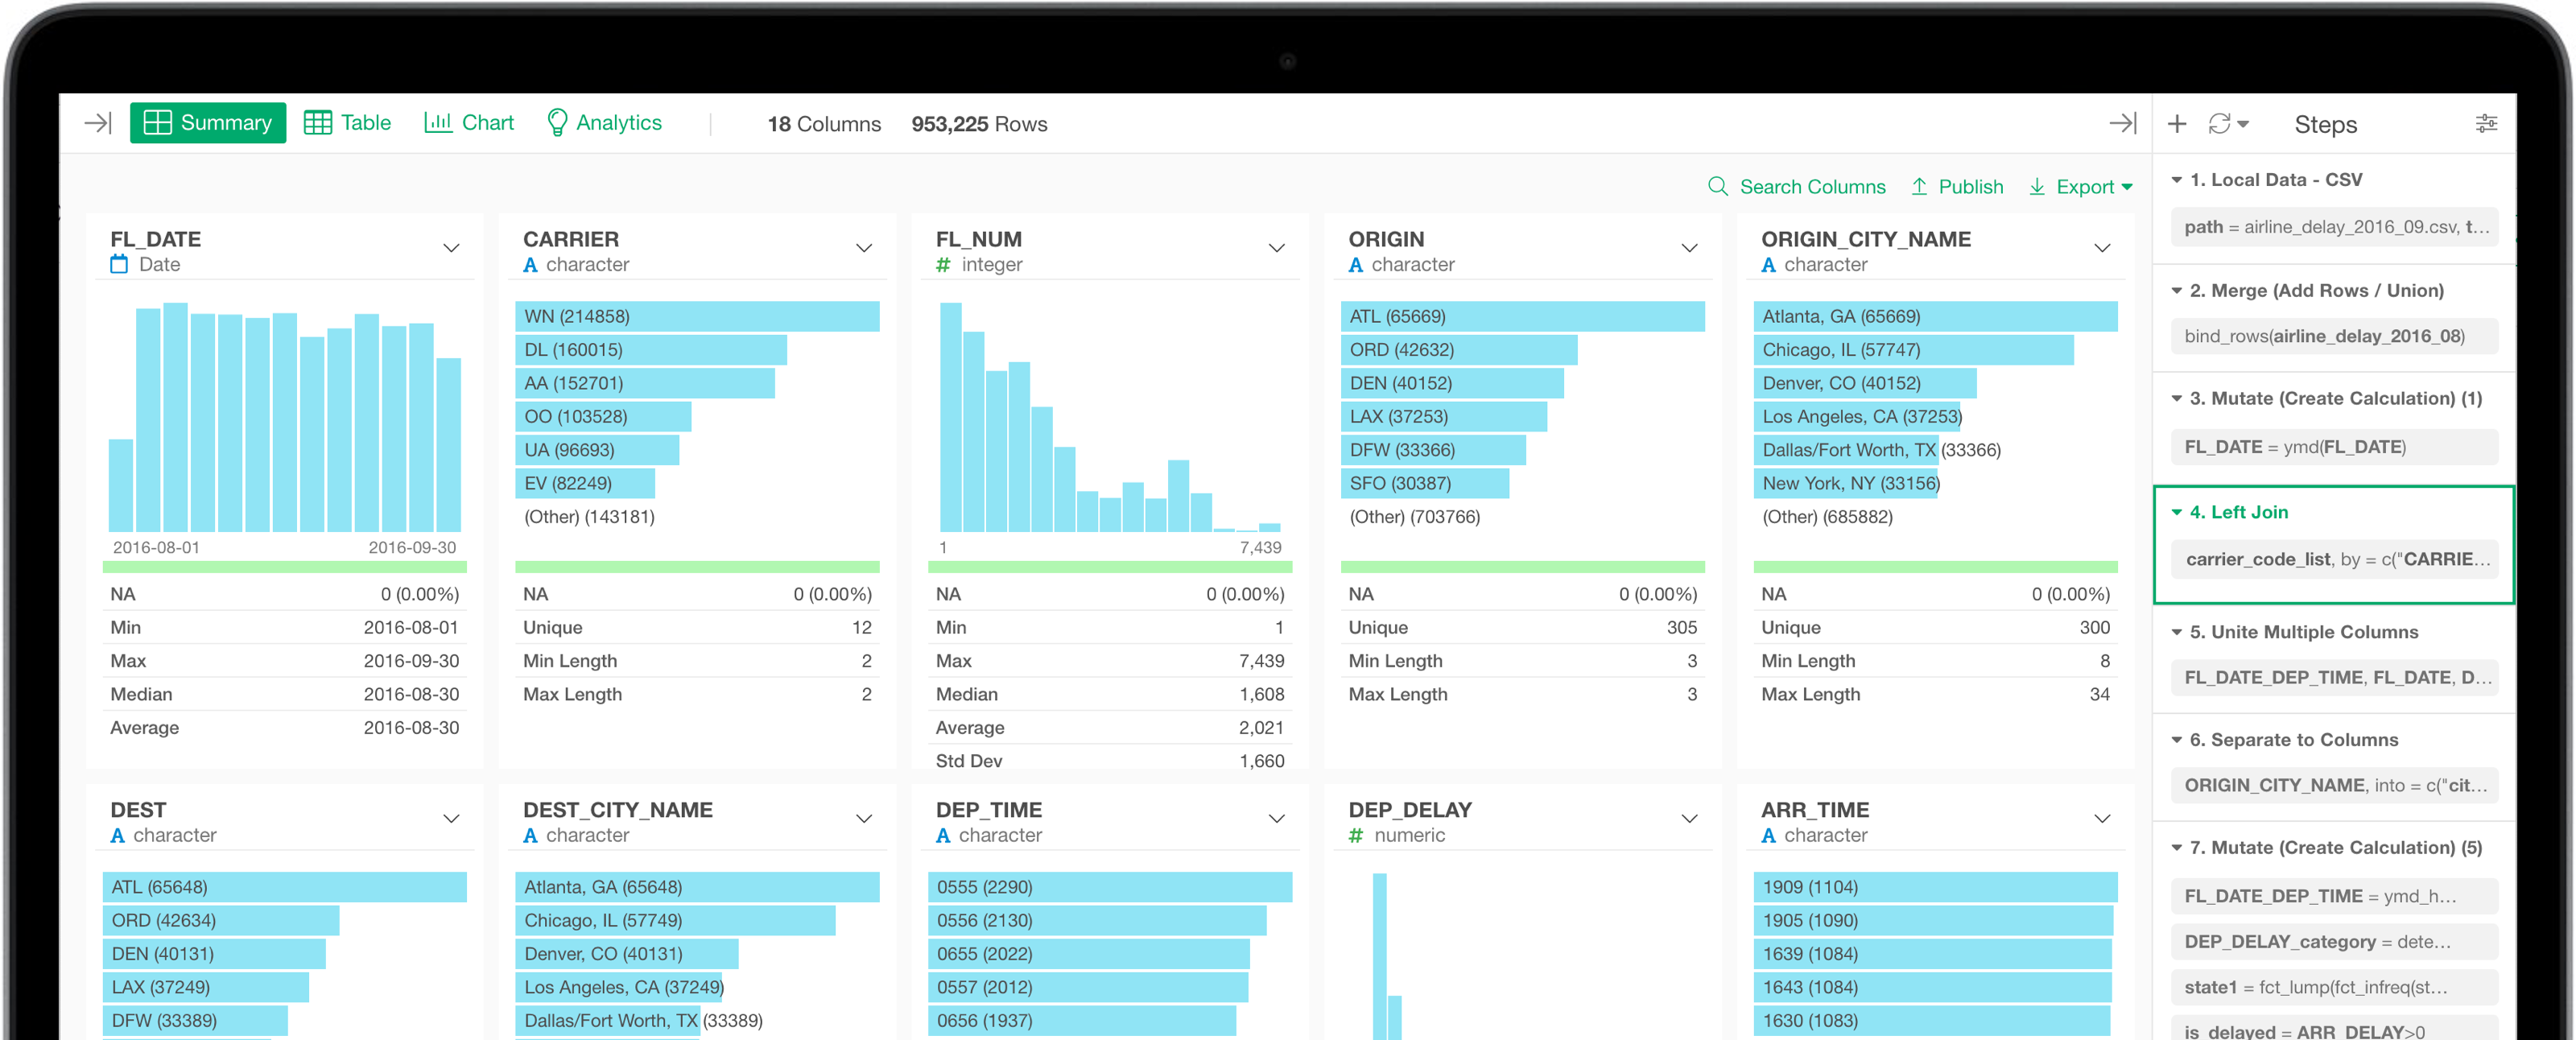
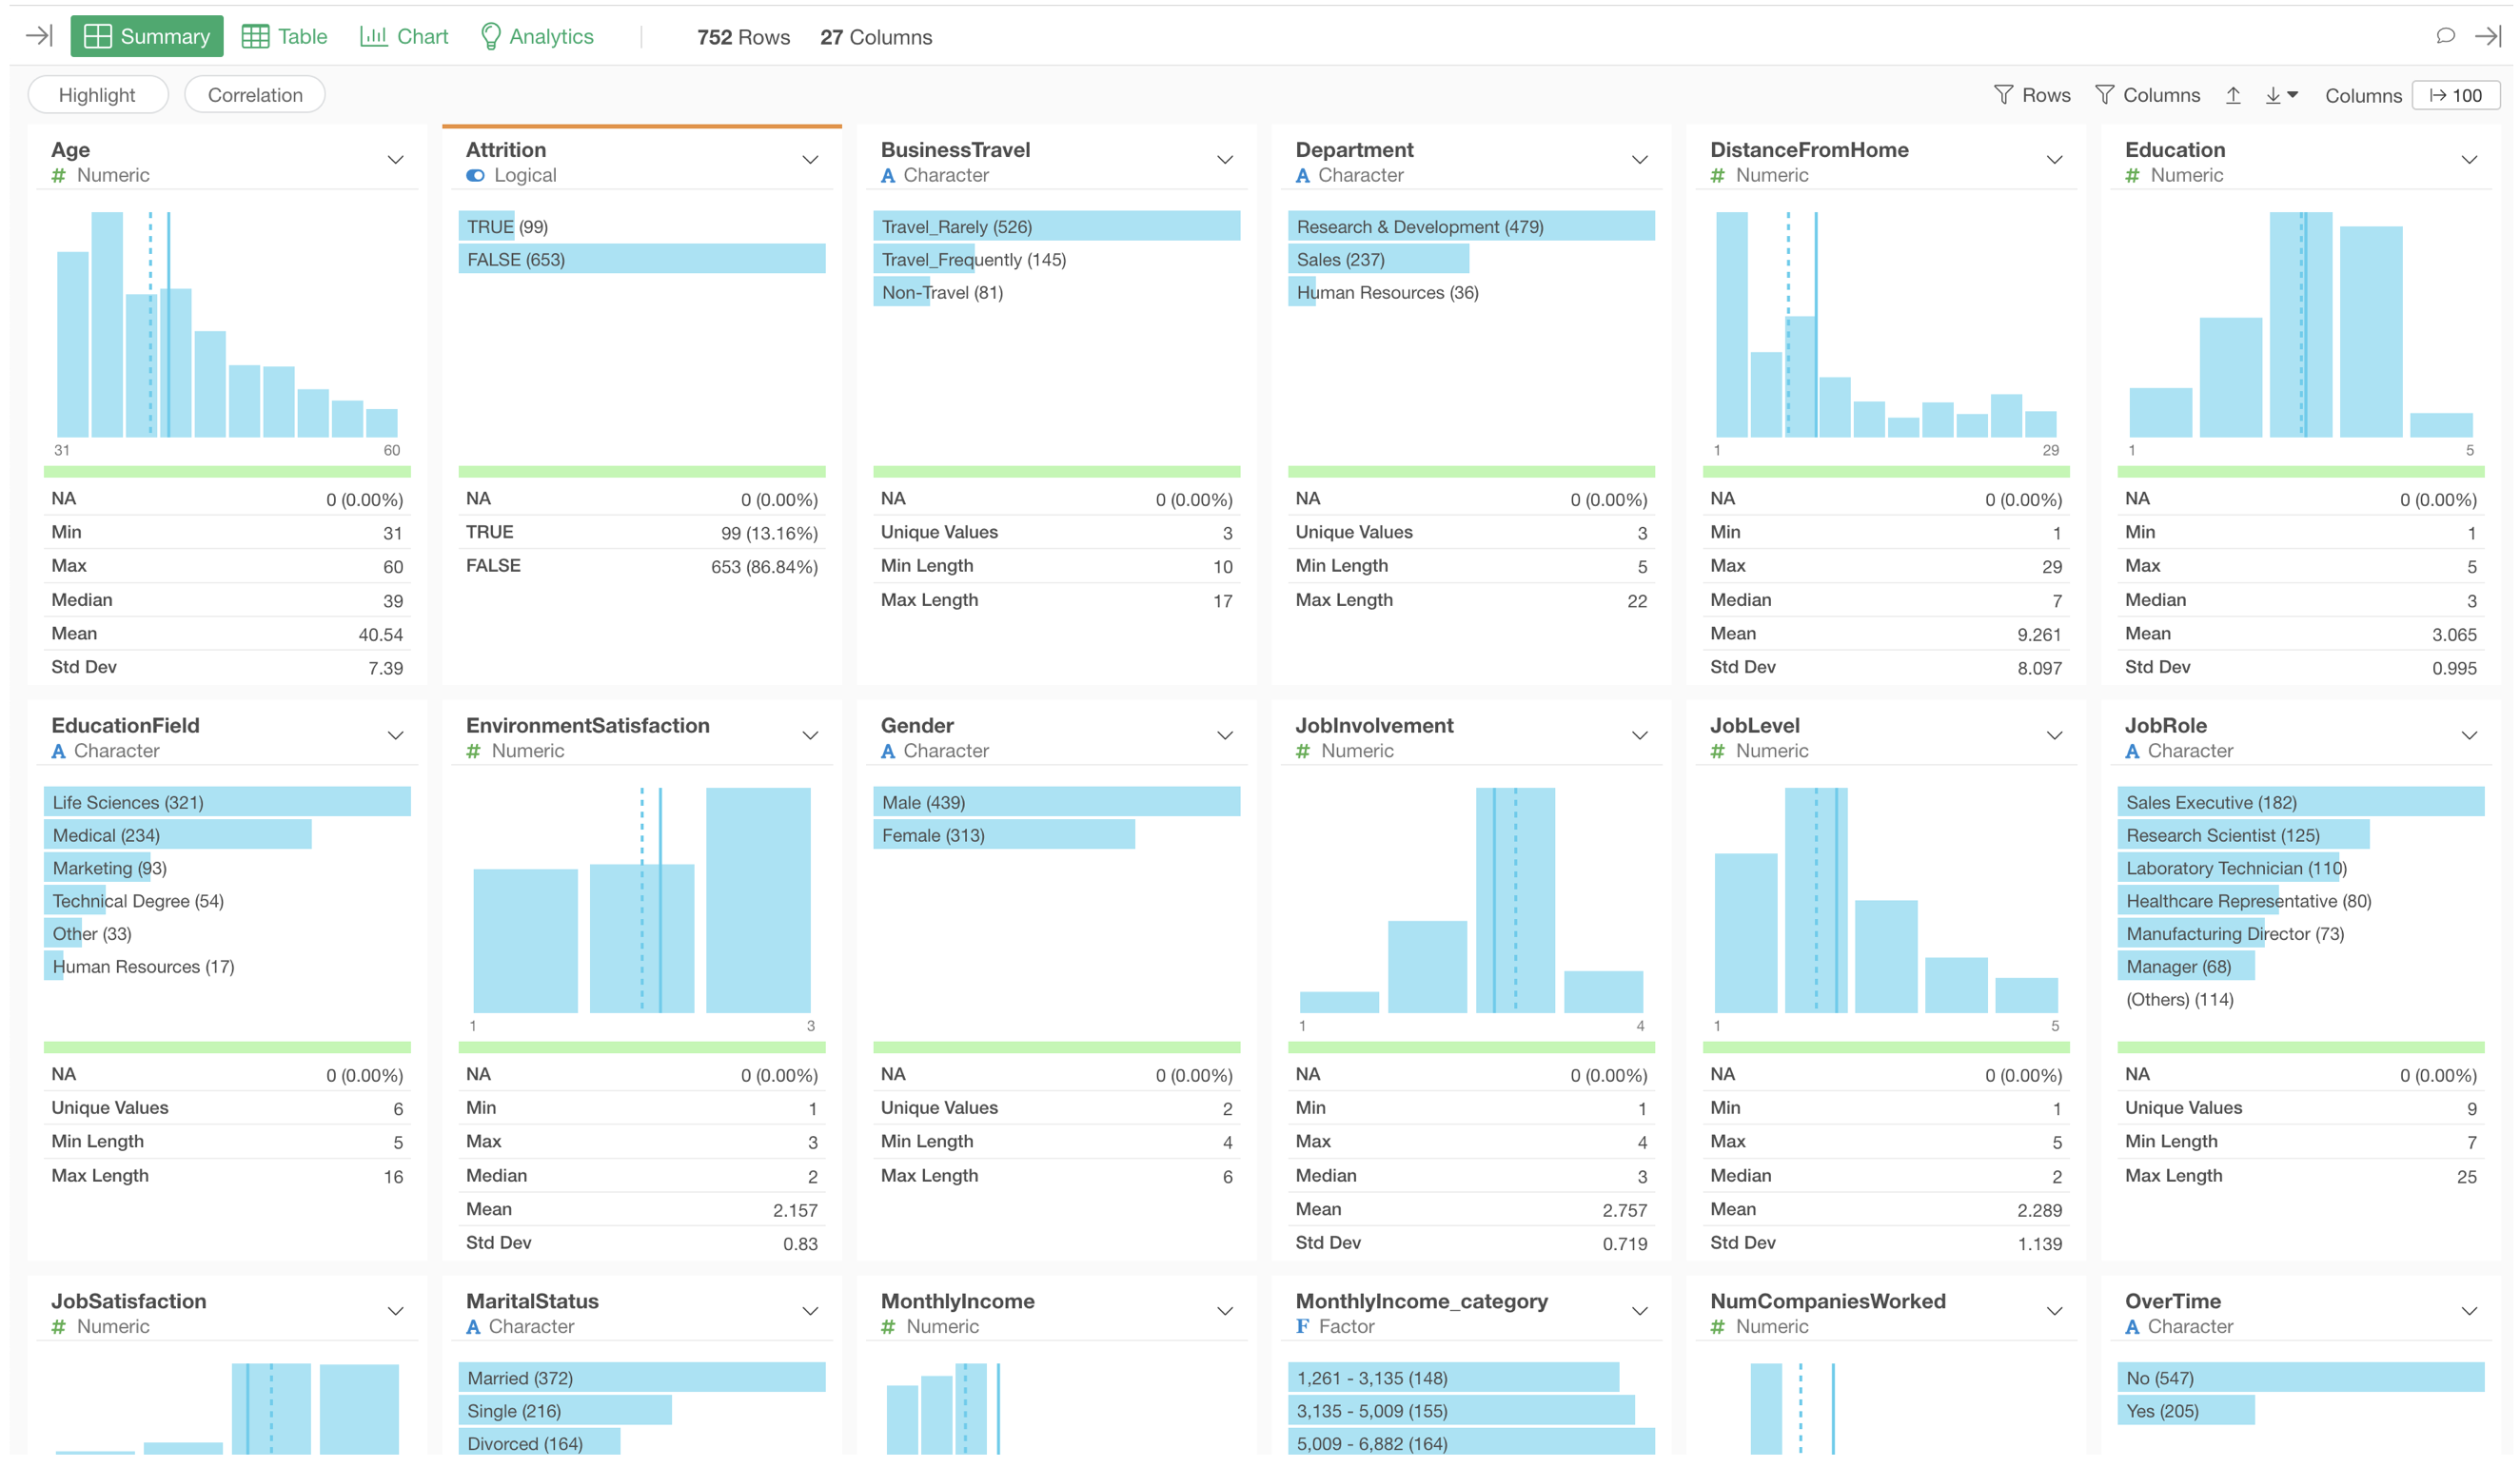
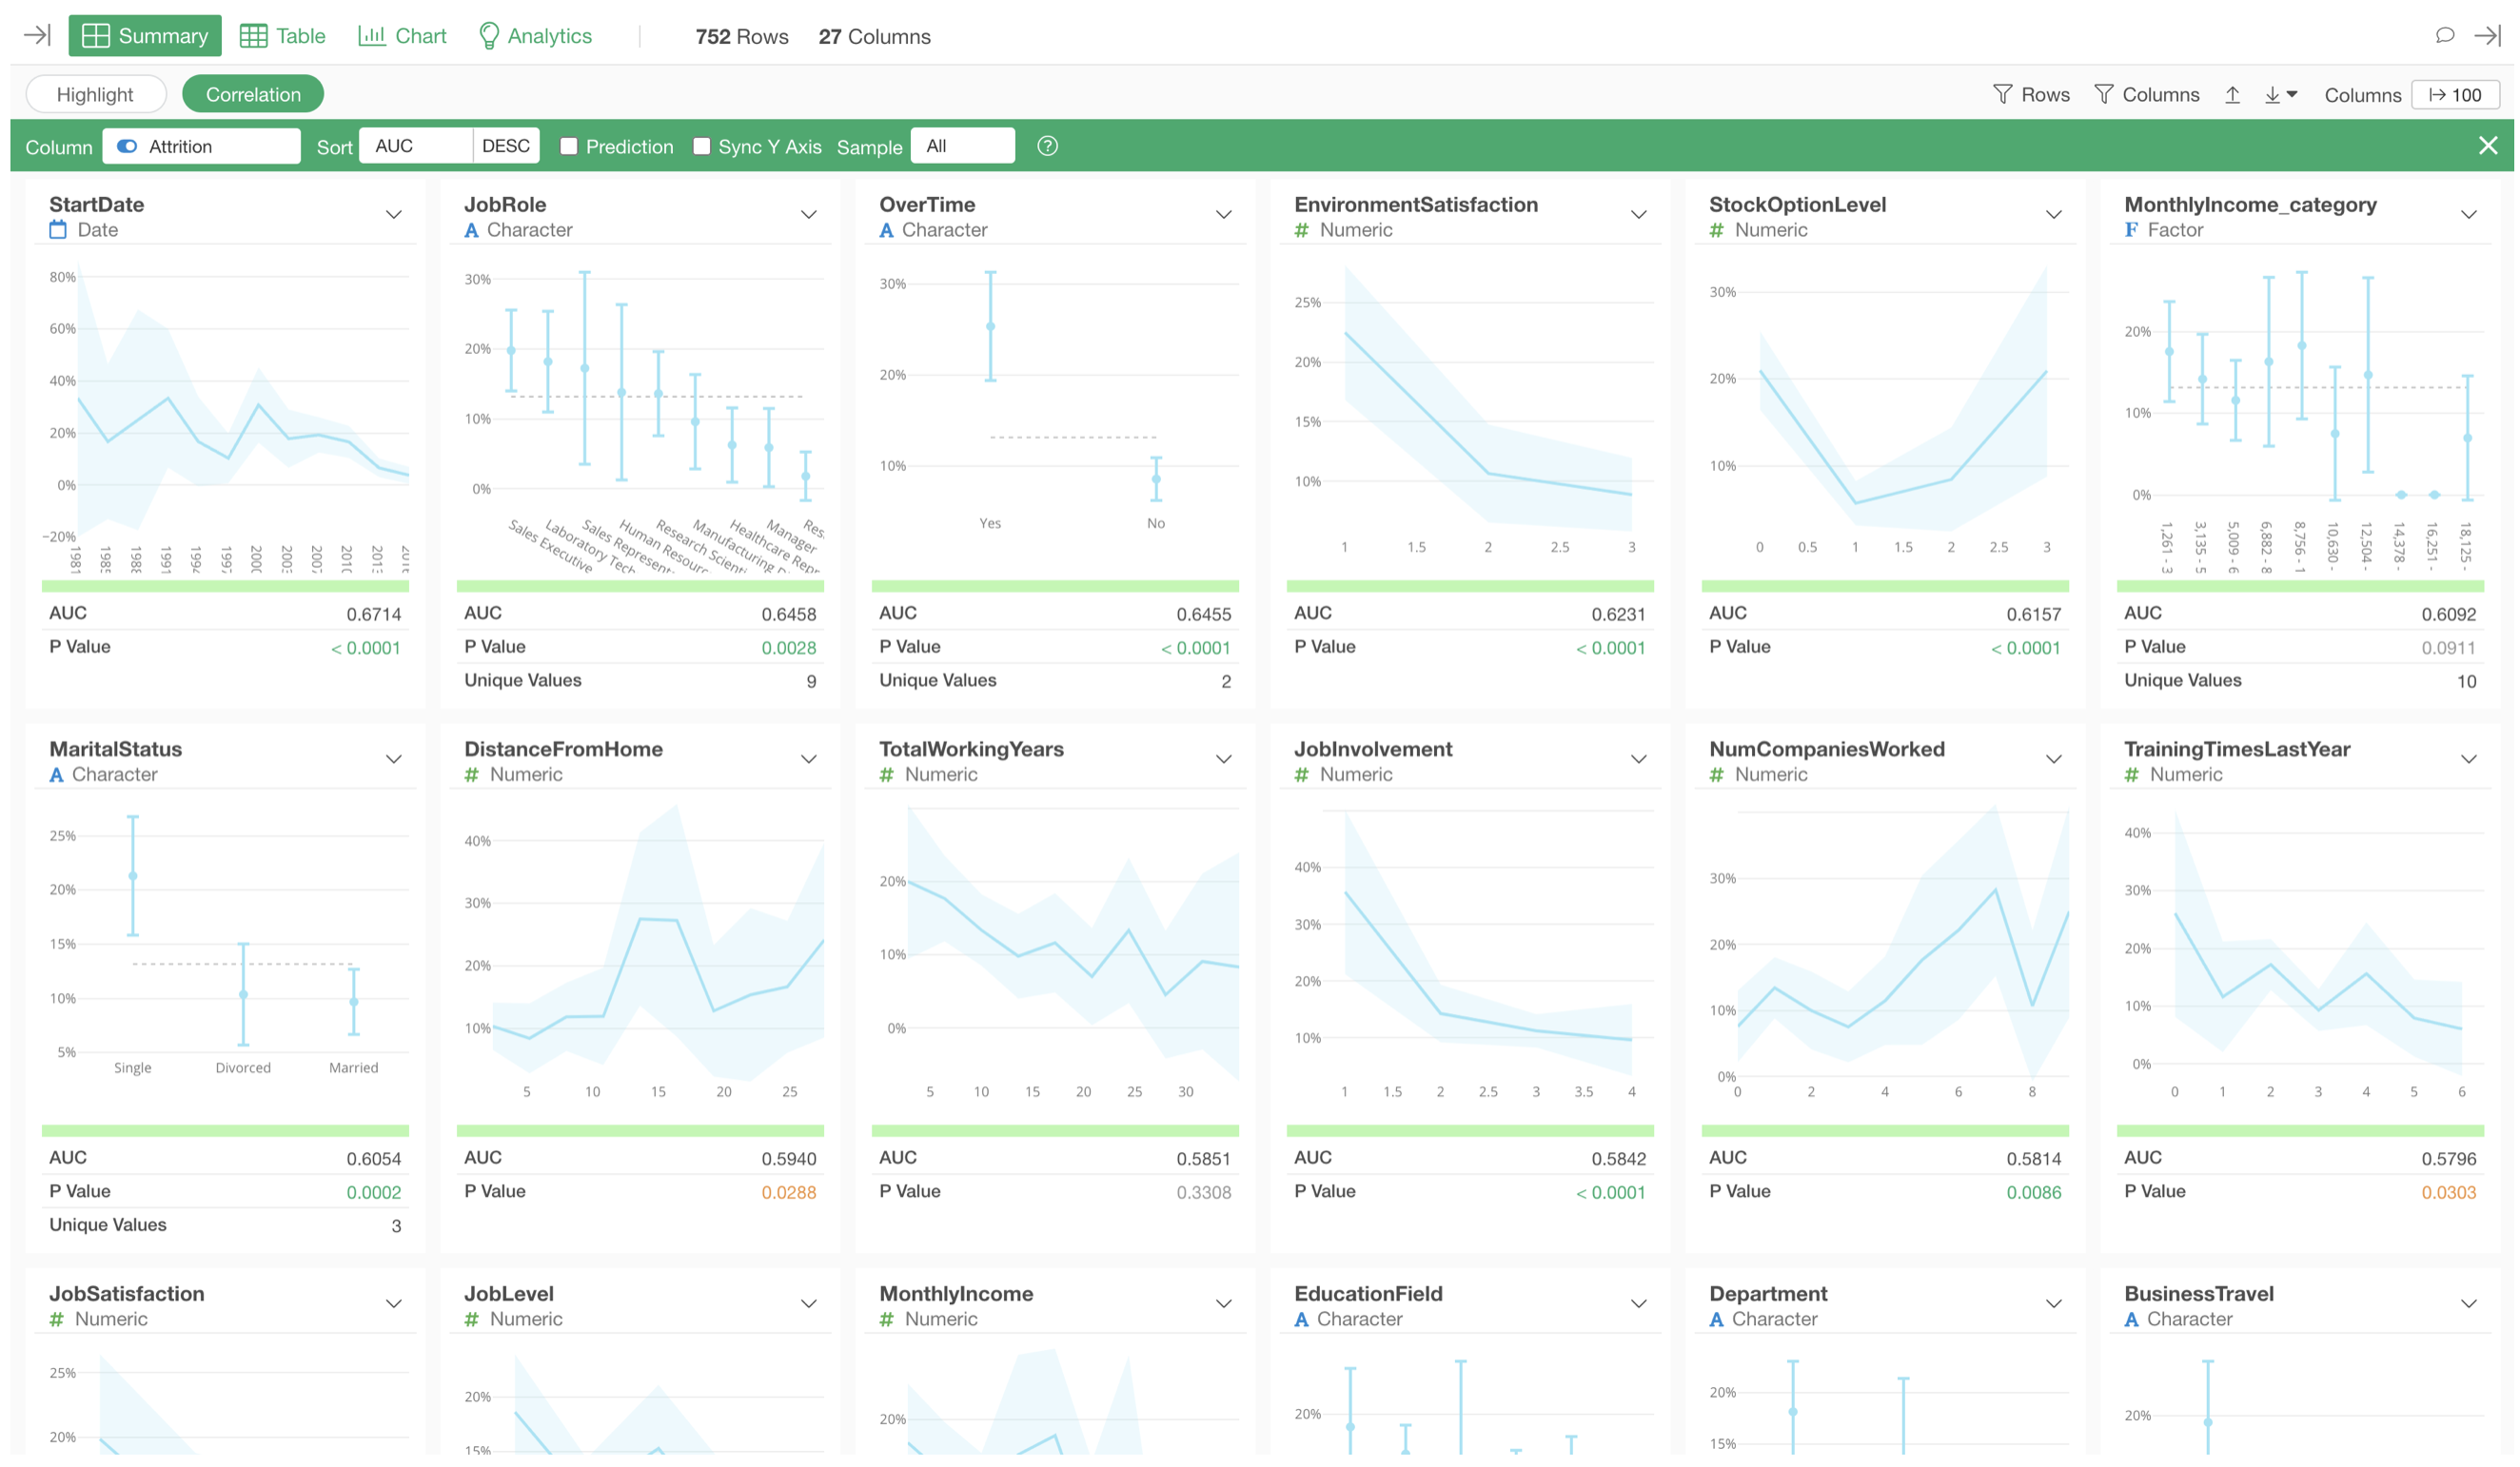
Once you import your data, Exploratory automatically generates a summary view where you can see a set of statistics and charts to understand your data at a glance. You can also use Correlation mode to analyze relationships among variables quickly.
Data Wrangling with AI Prompt
Want to clean, transform, calculate, merge data? Just describe what you want in plain English, Exploratory’s AI Prompt will generate the right data wrangling steps for you.
No Code. No Menu. Just your Words. Data wrangling powered by AI.
No Code. No Menu. Just your Words. Data wrangling powered by AI.

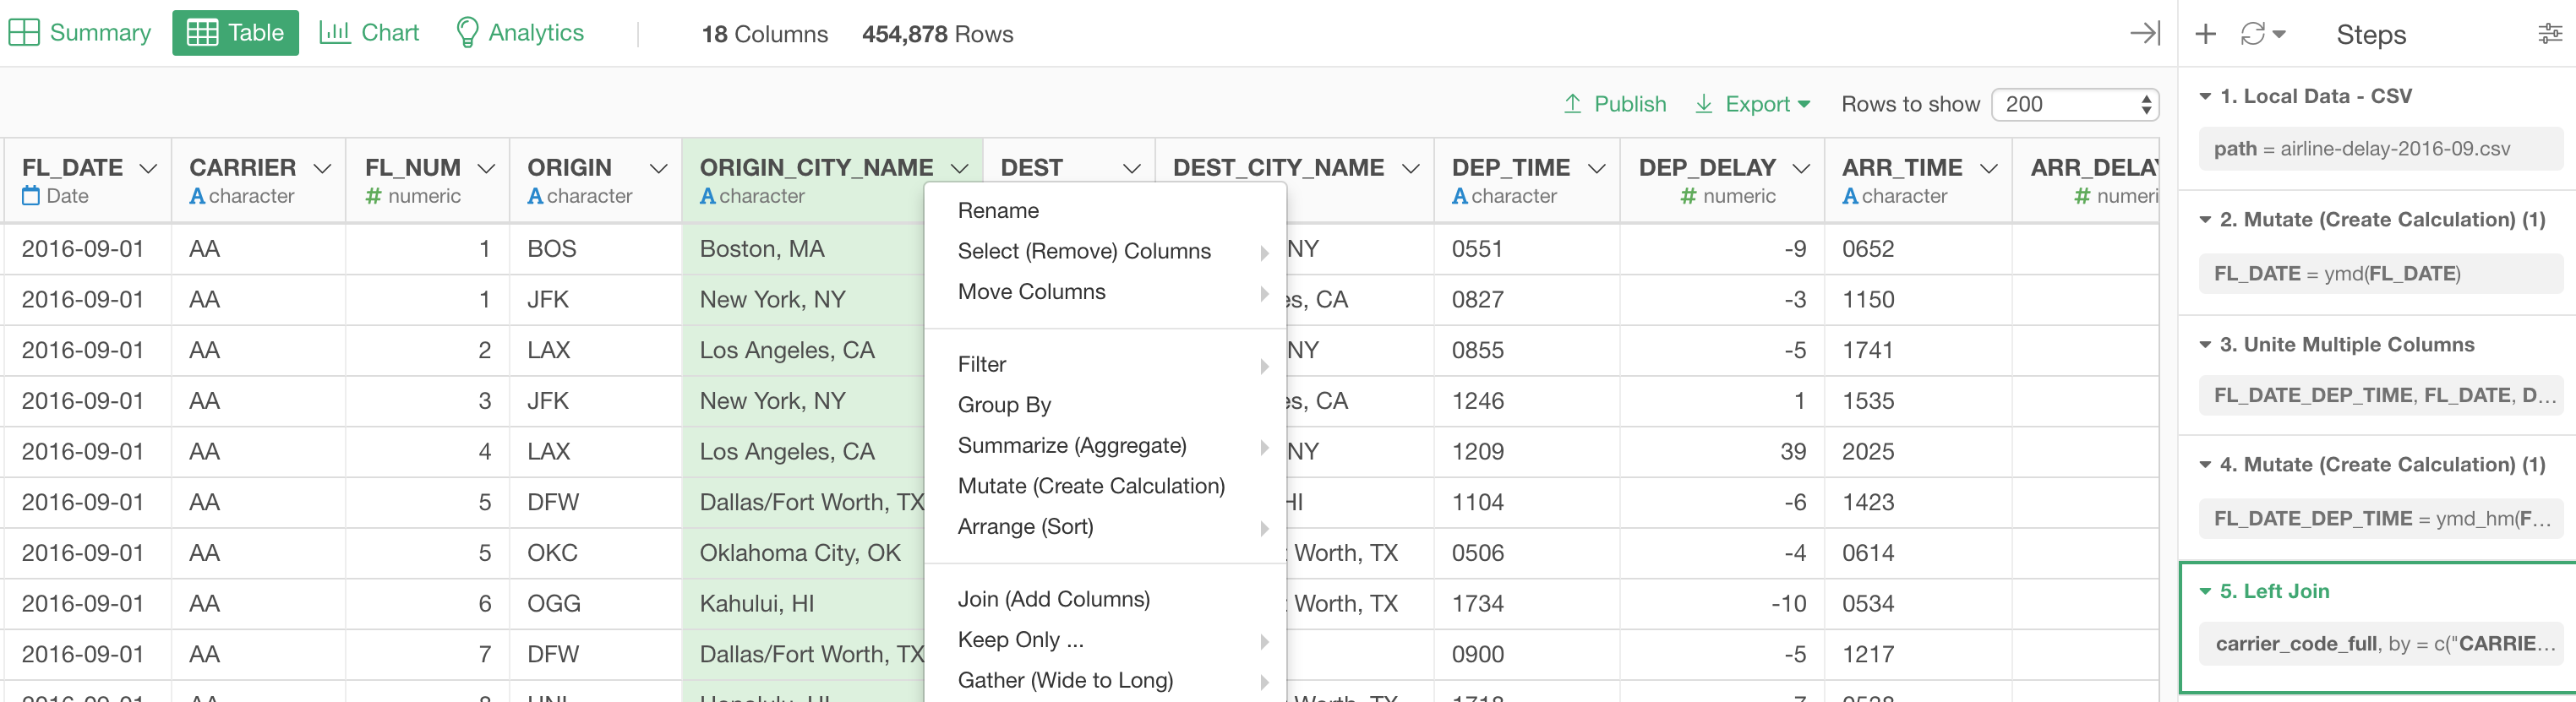
Data Wrangling with UI
Exploratory’s Step based UI experience makes it easy to clean and transform data flexibly and manage the data wrangling process in a reproducible way.
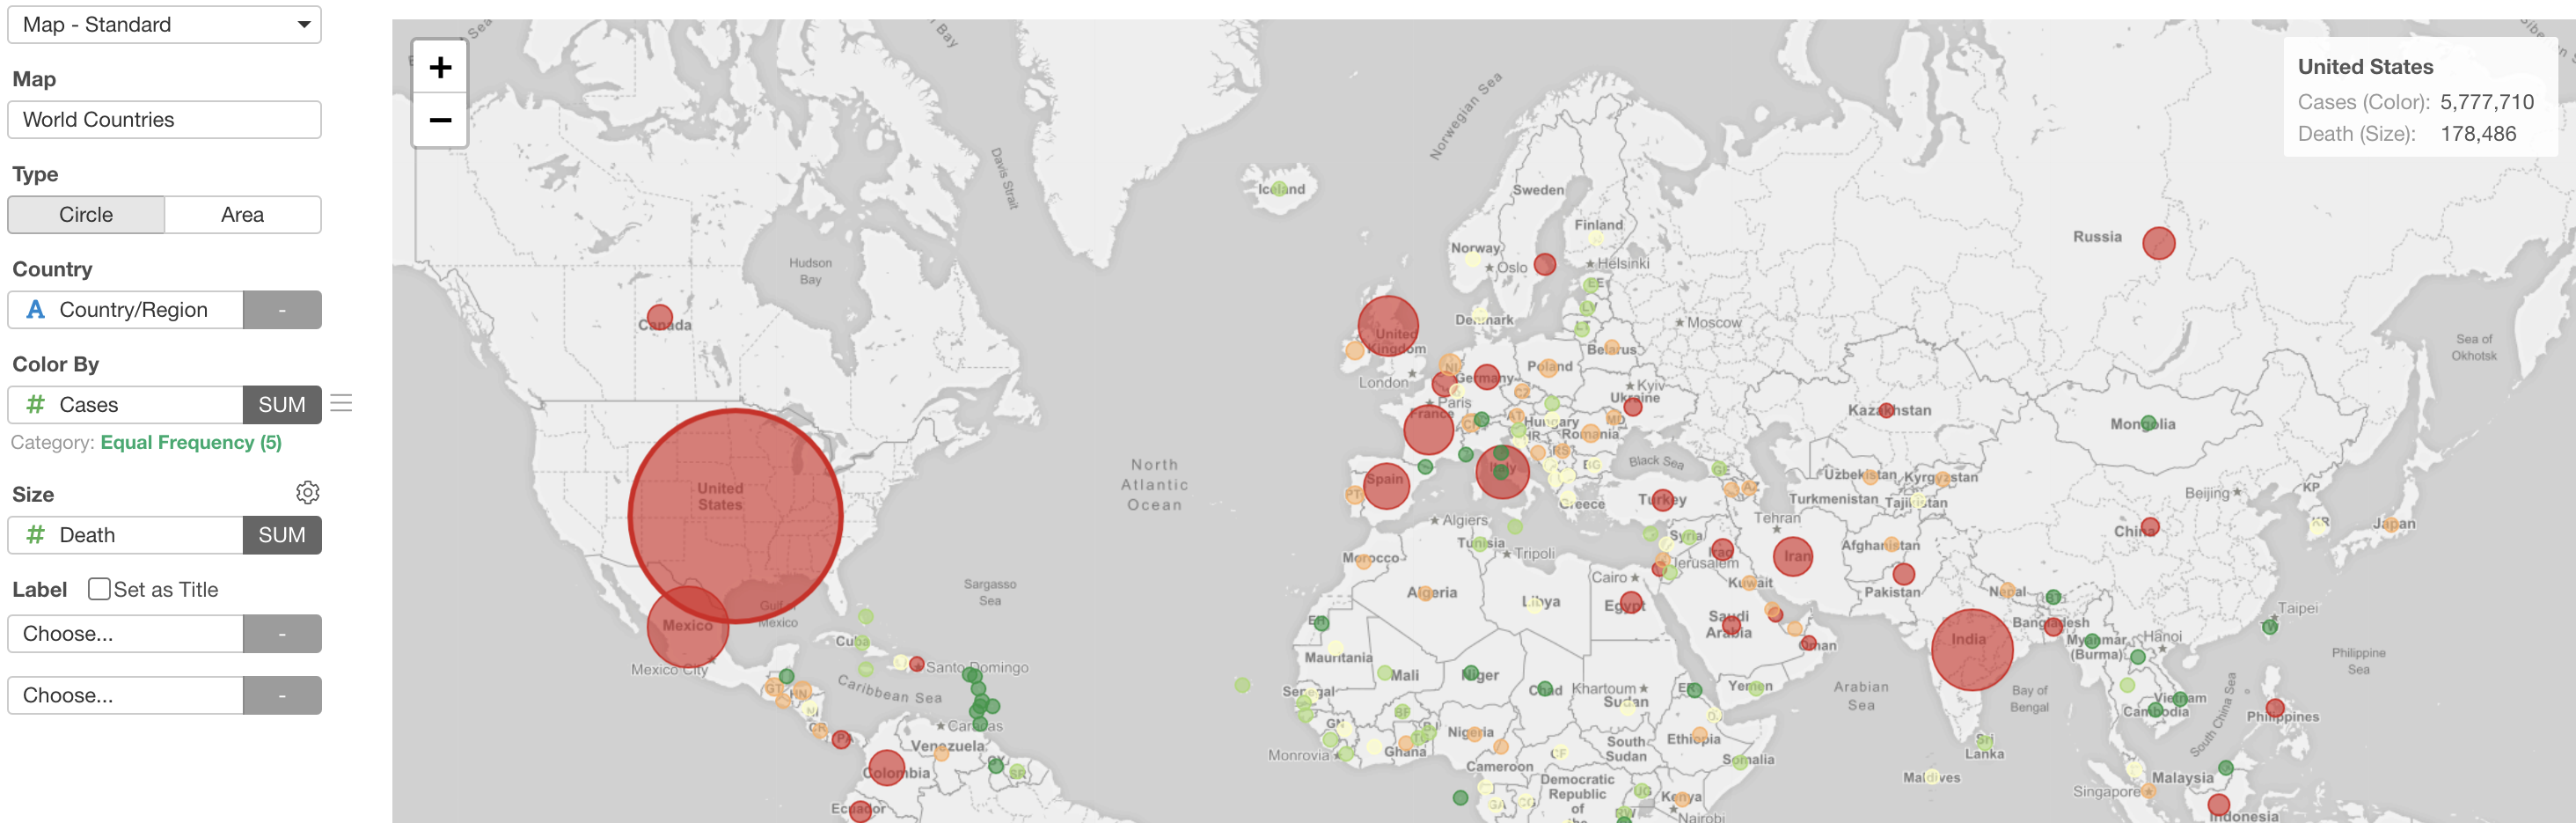
Data Visualization
Easy to create charts with a wide range of chart types and with various functionalities to explore your data and discover insights quickly.
AnalyticsStatistics / Machine Learning
Exploratory’s simple UI experience makes it easy to use a wide range of Statistics and Machine Learning algorithms to explore data and gain deeper insights quickly.
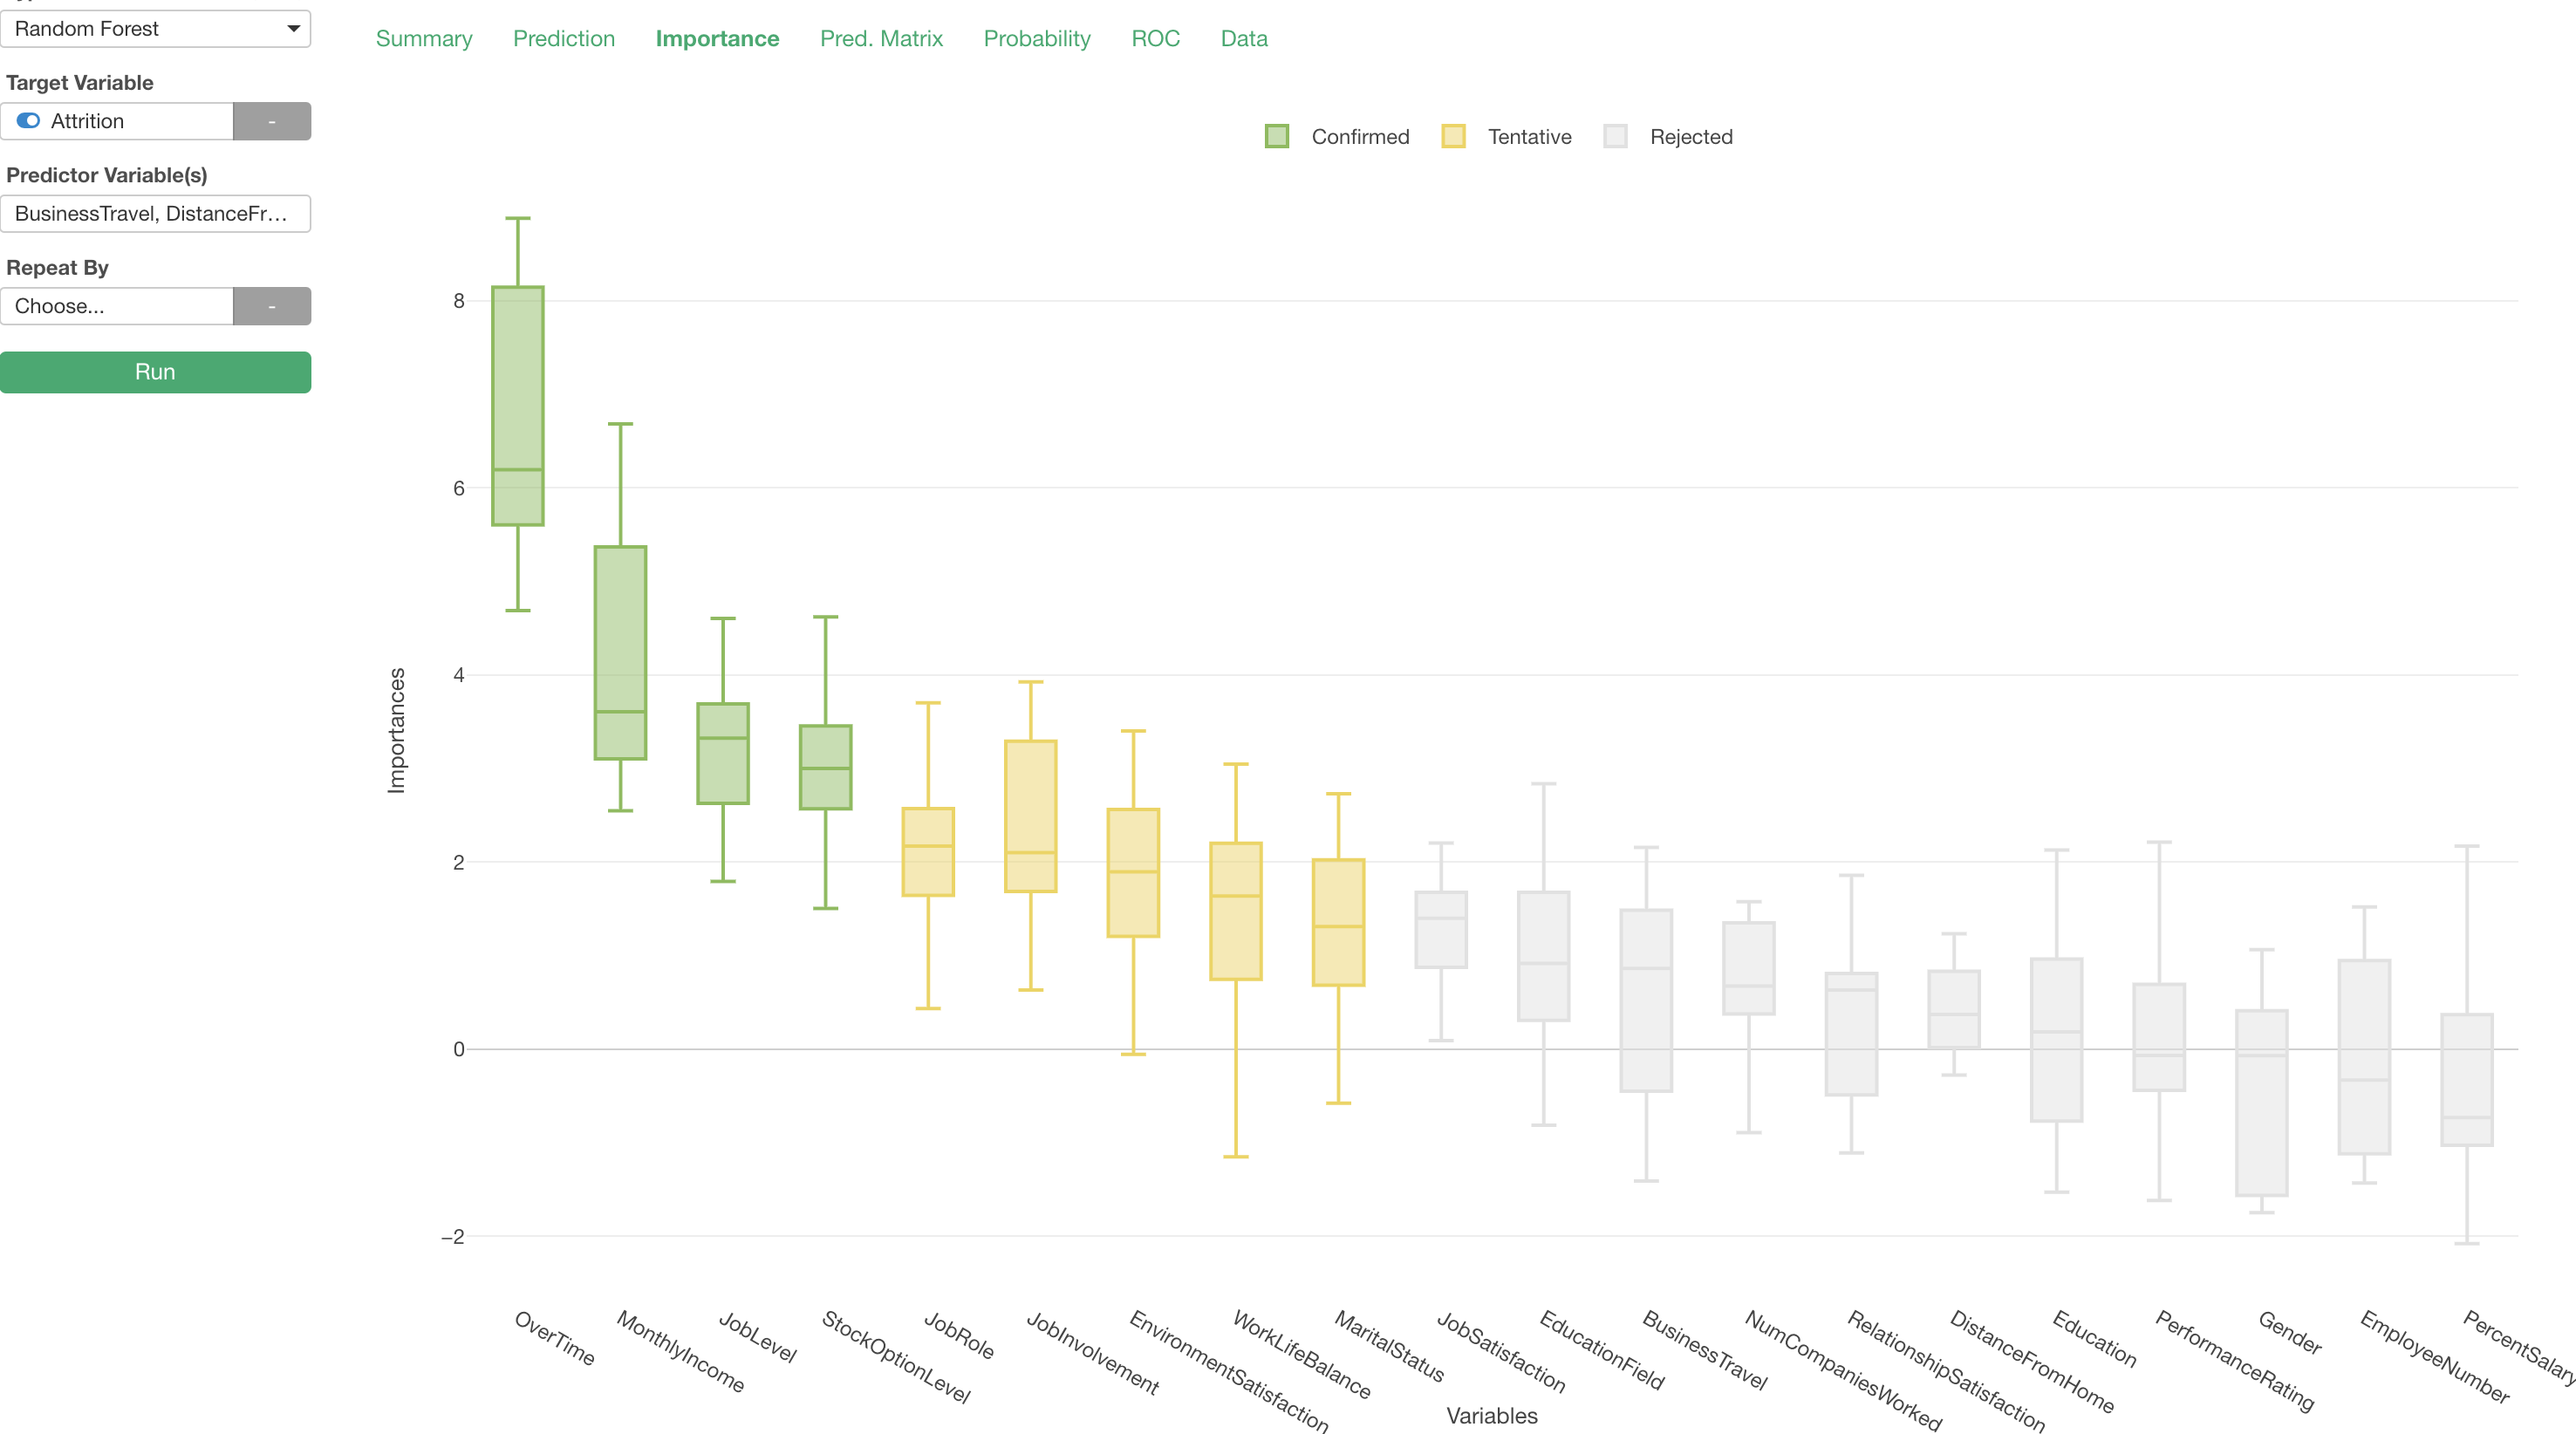
Random Forest
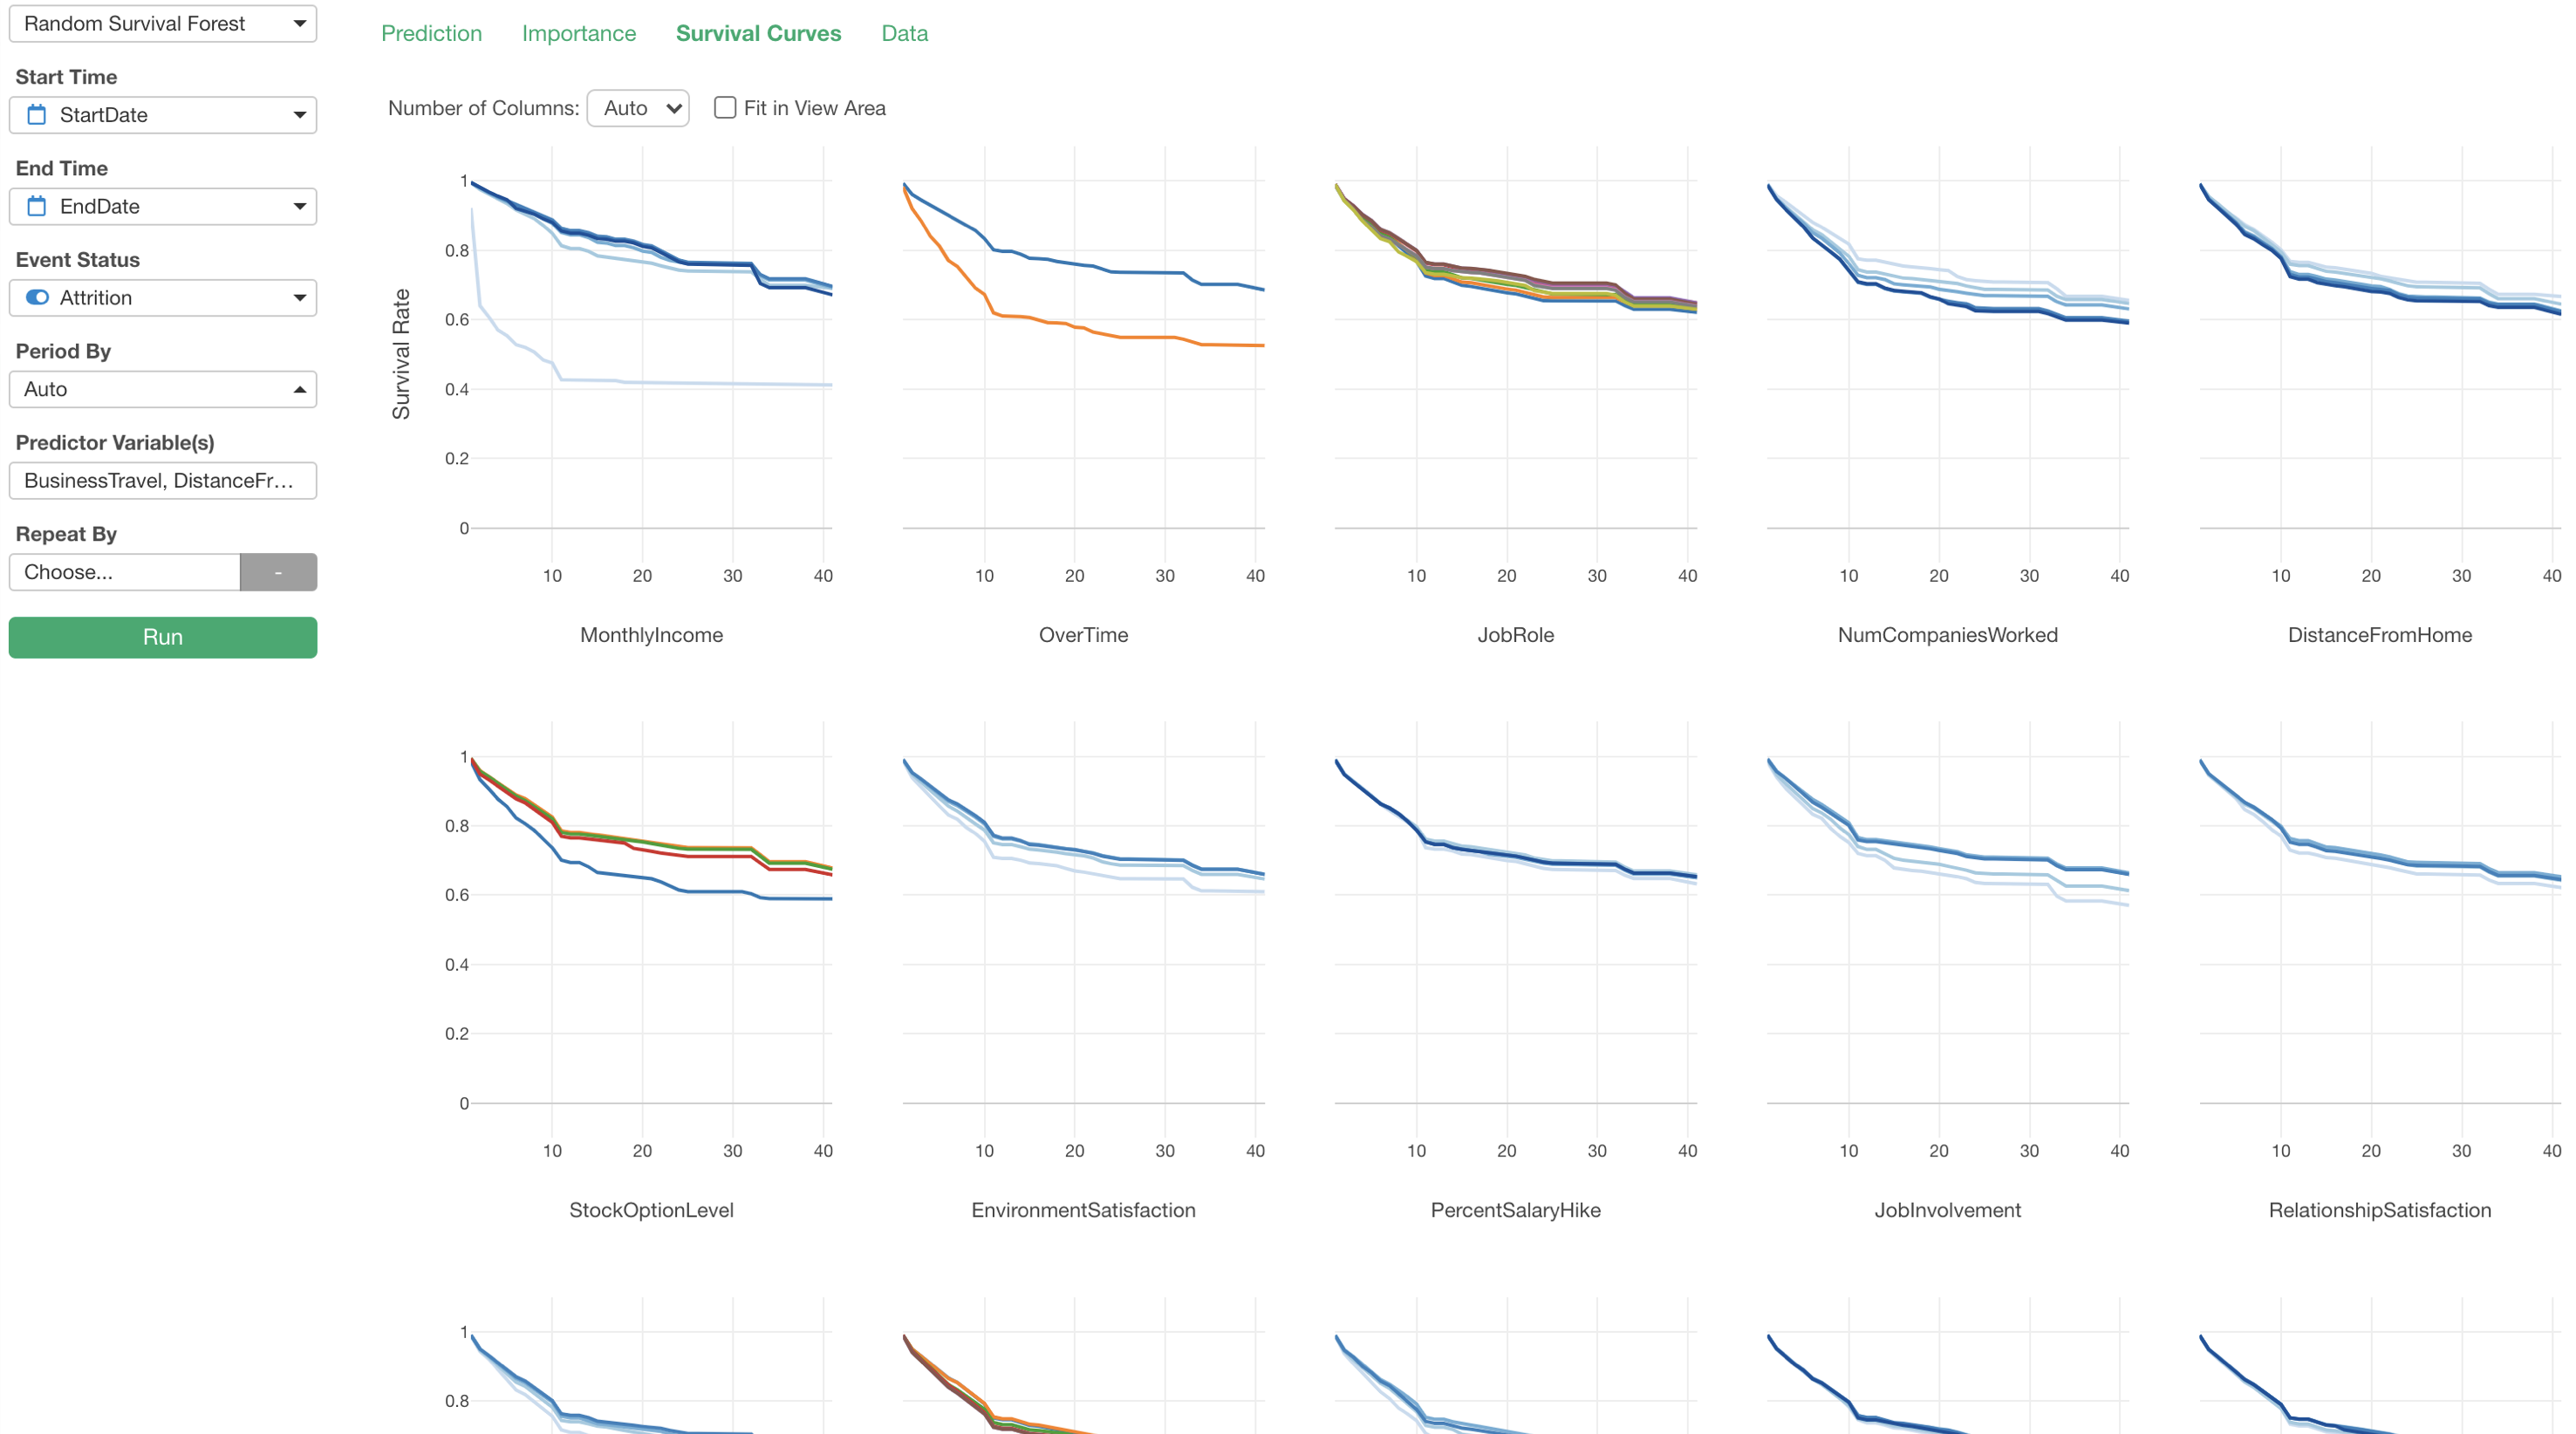
Survival Analysis
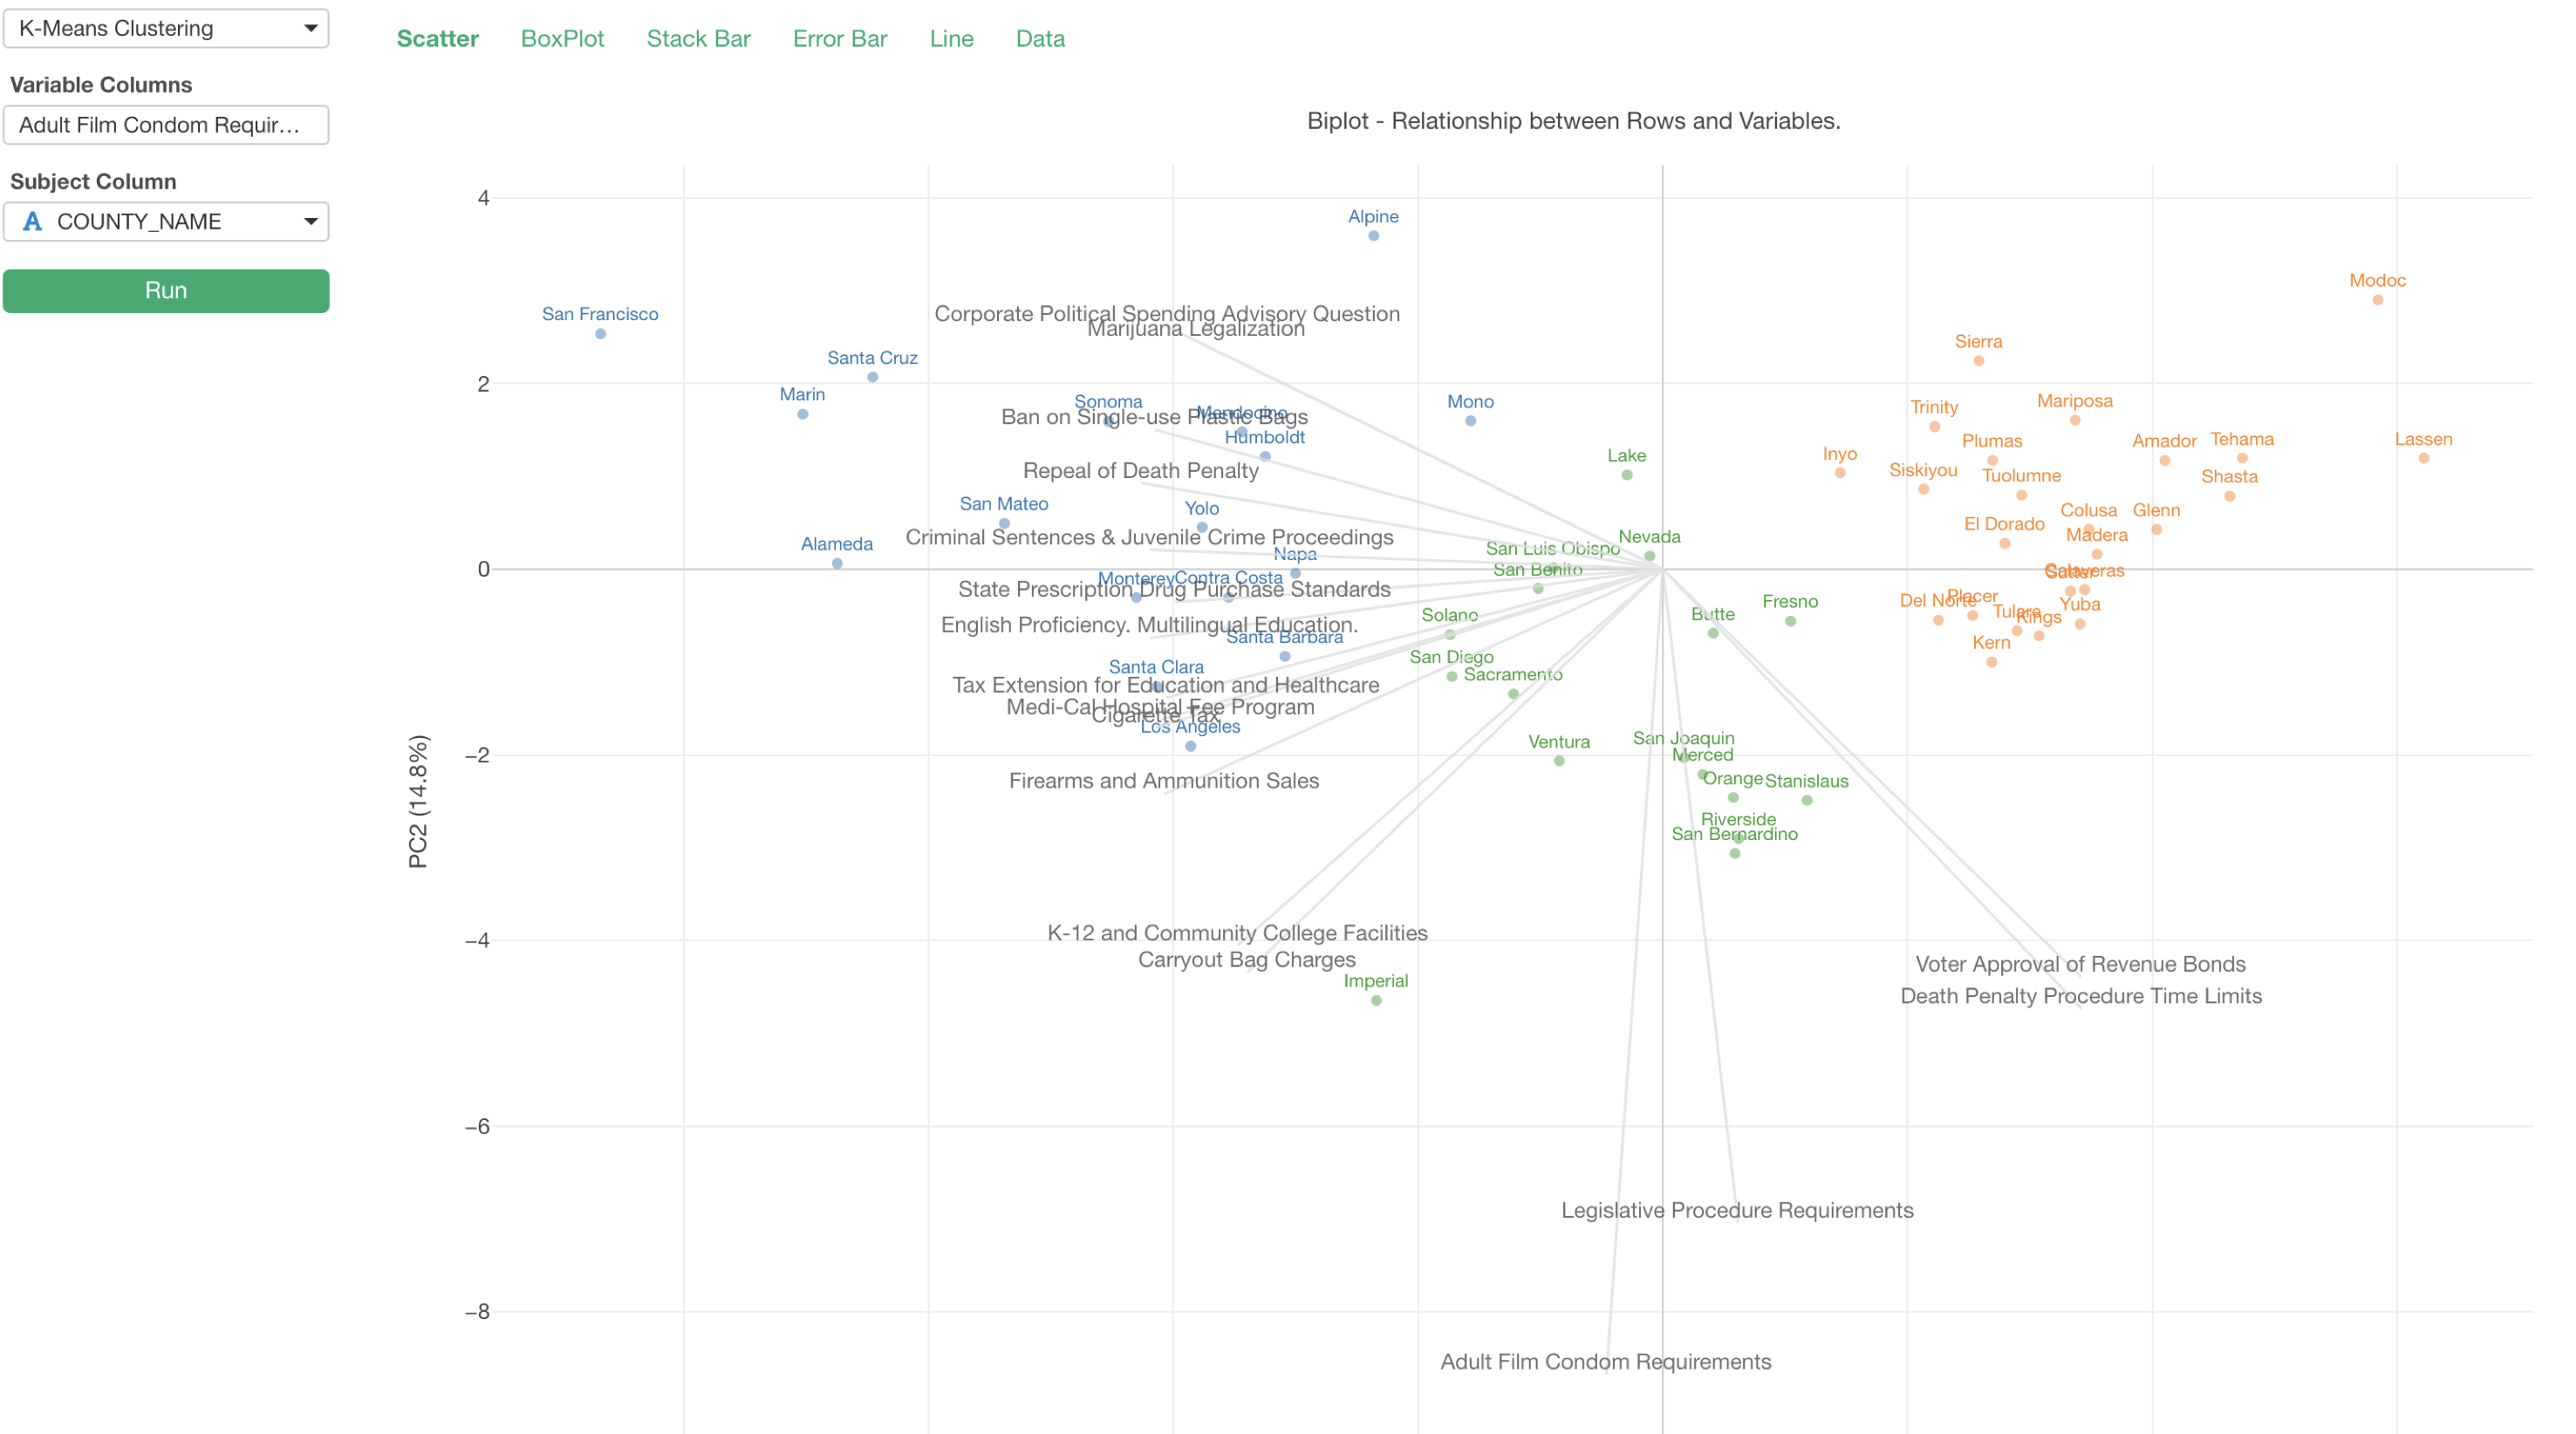
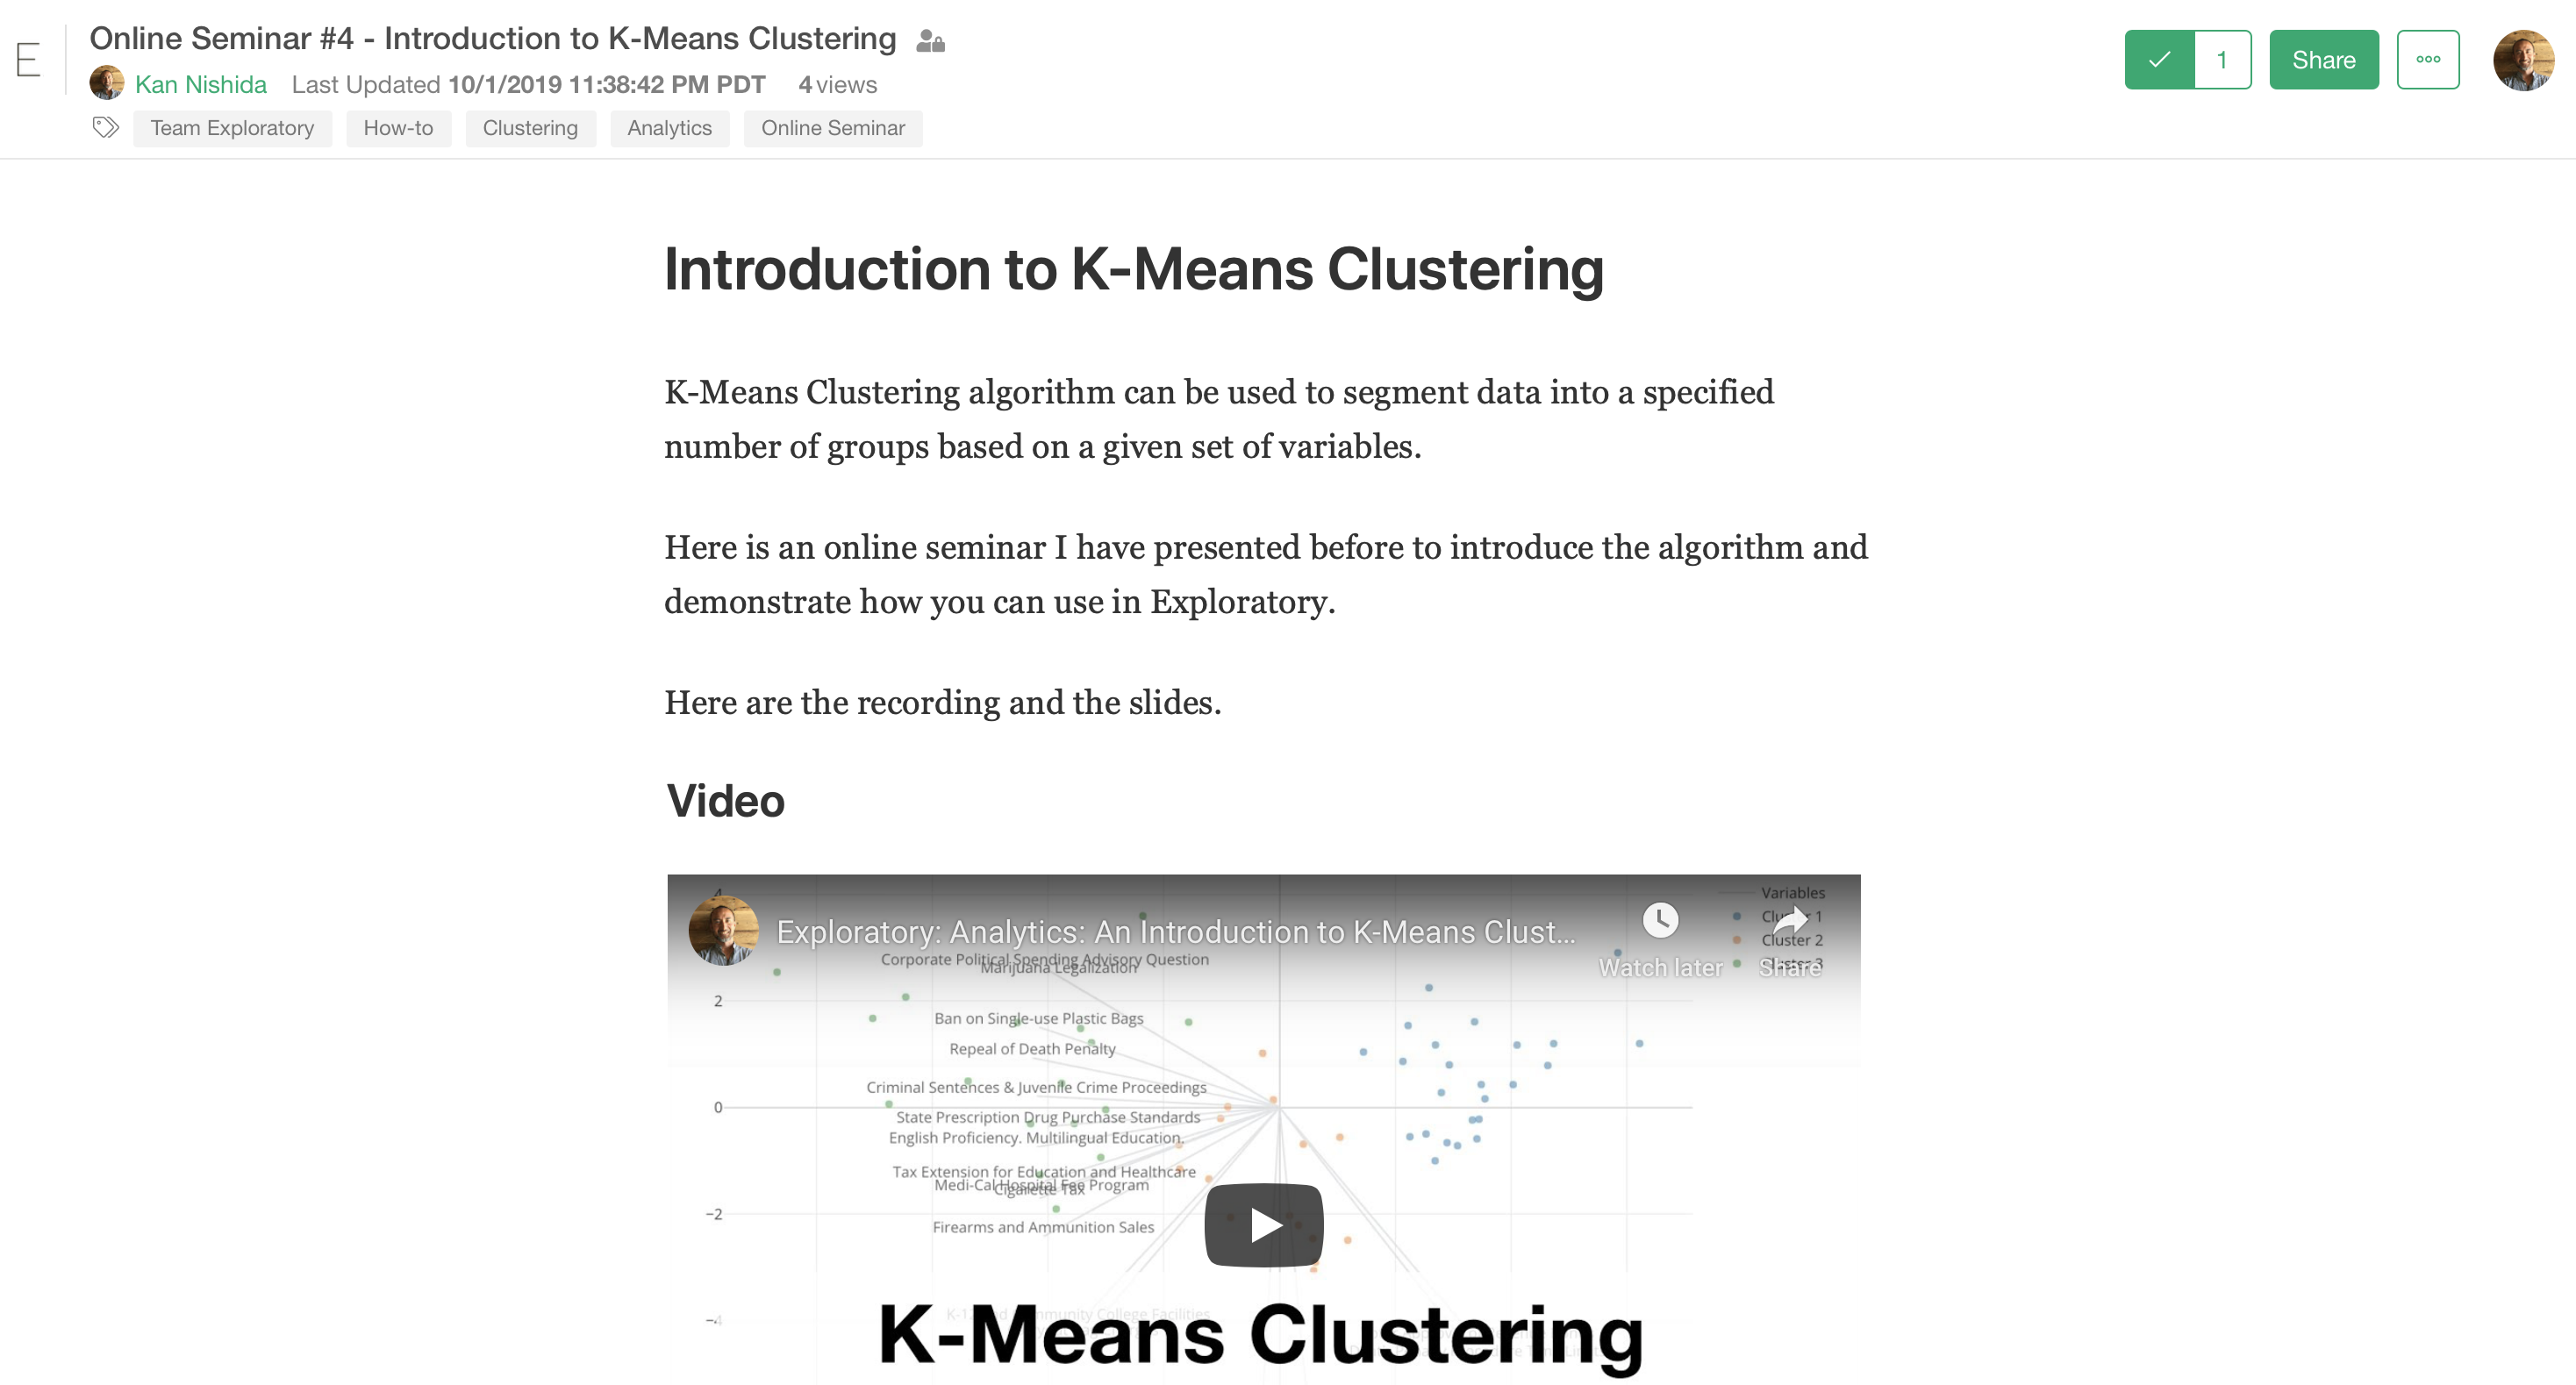
Clustering
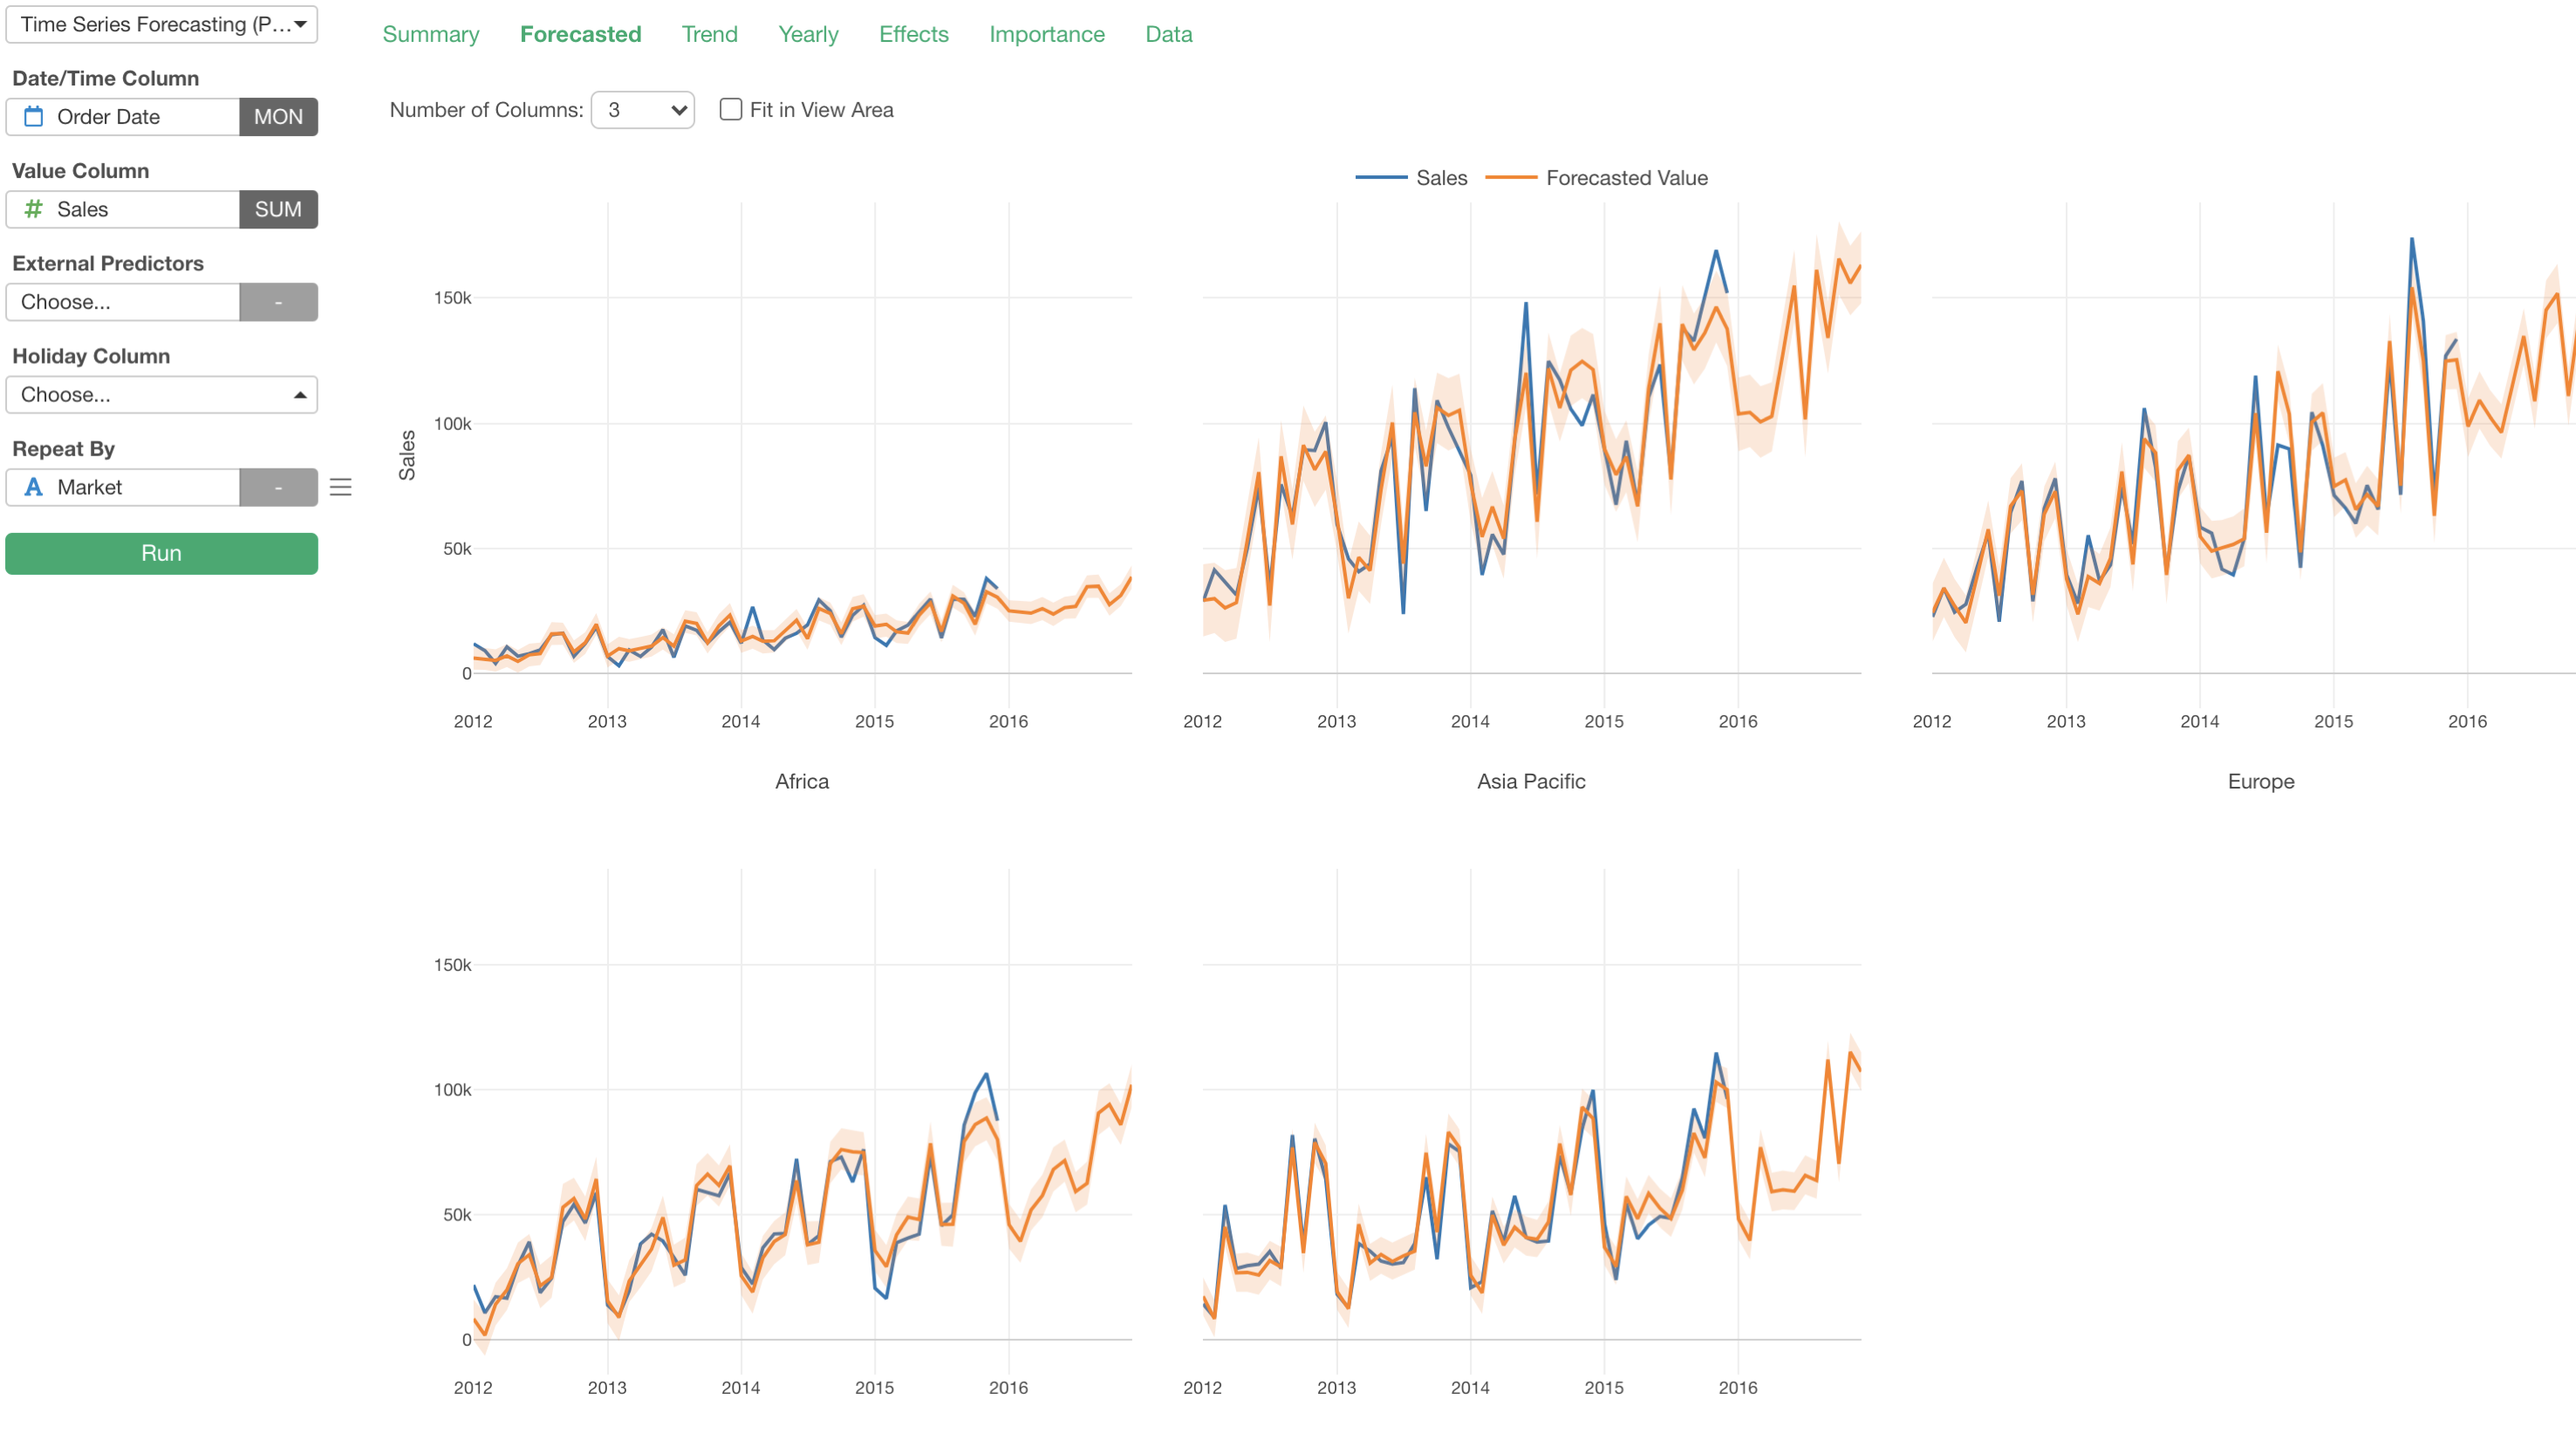
Time Series Forecasting
Dashboard
Quickly create your own Dashboards with flexible layouts and interactive charts. Automate updating the data and generating the latest dashboard outputs at Exploratory Server.
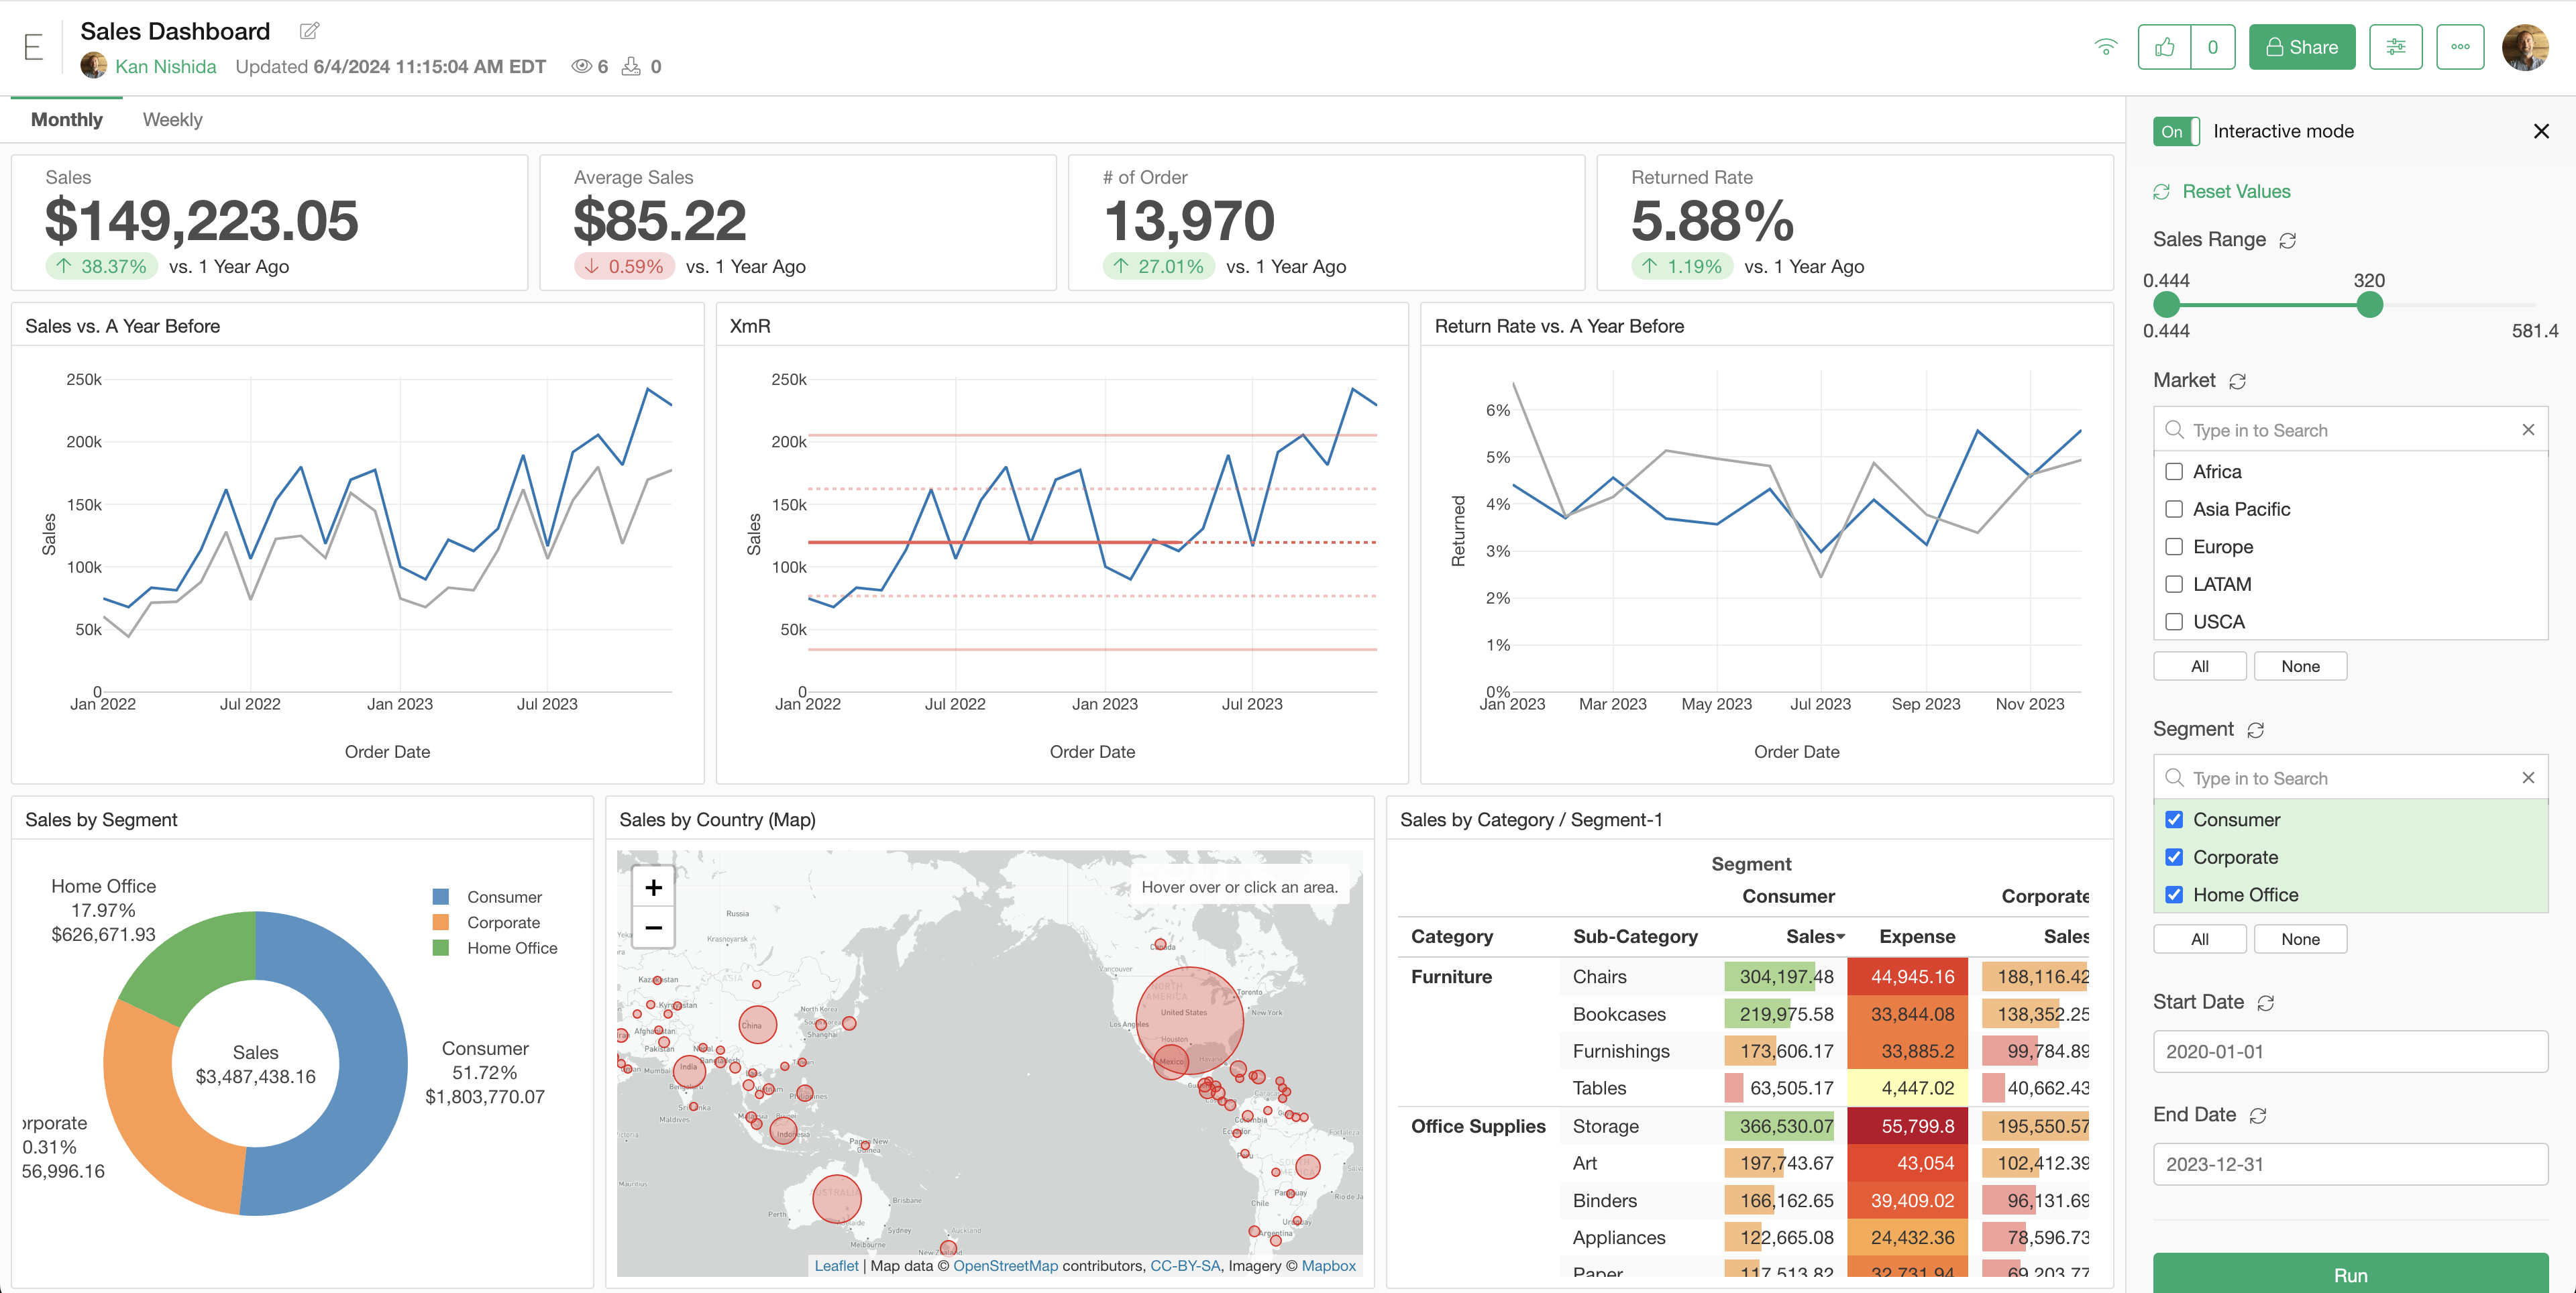
Notes
Exploratory’s Note Editor’s simple and intuitive user experience helps you write your stories about insights you discover from data in an interactive and effective way.
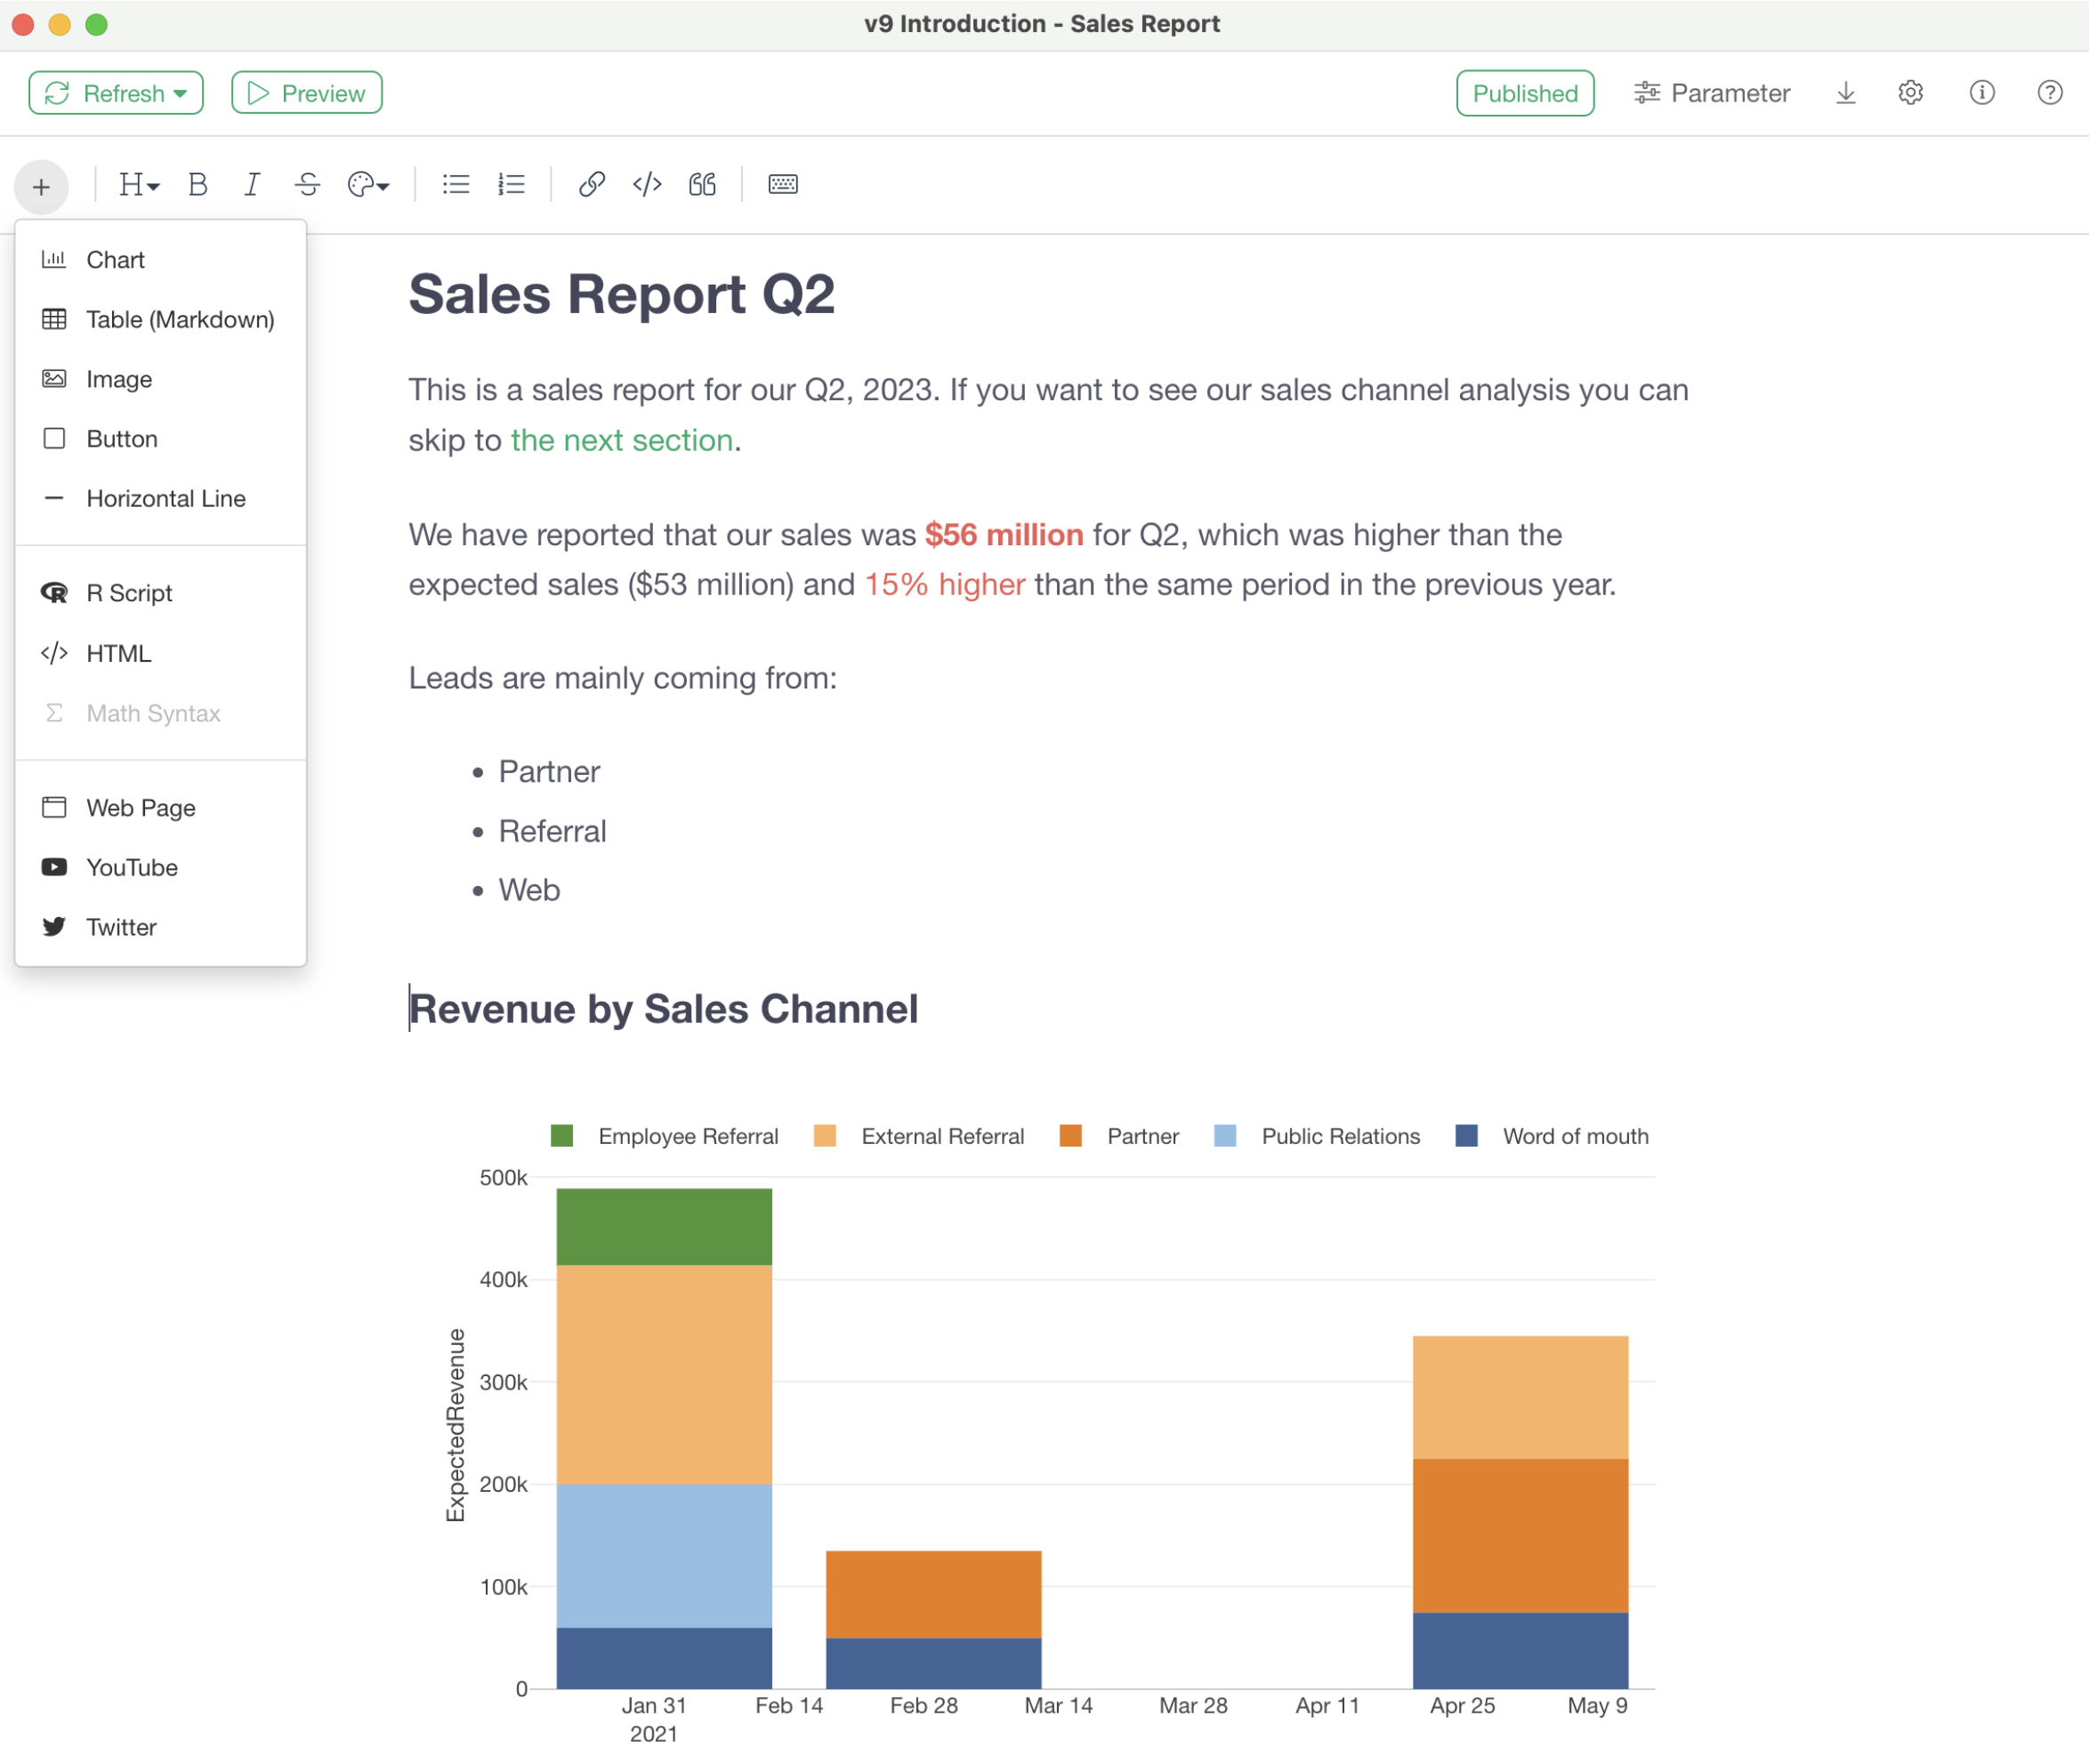
Extend Beyond Exploratory
Exploratory is built on top of R. This means you have access to more than 15,000 data science related open source packages. Extend Exploratory by bringing in your favorite R packages, creating your own custom functions, GeoJSON Map files, data sources, and more.
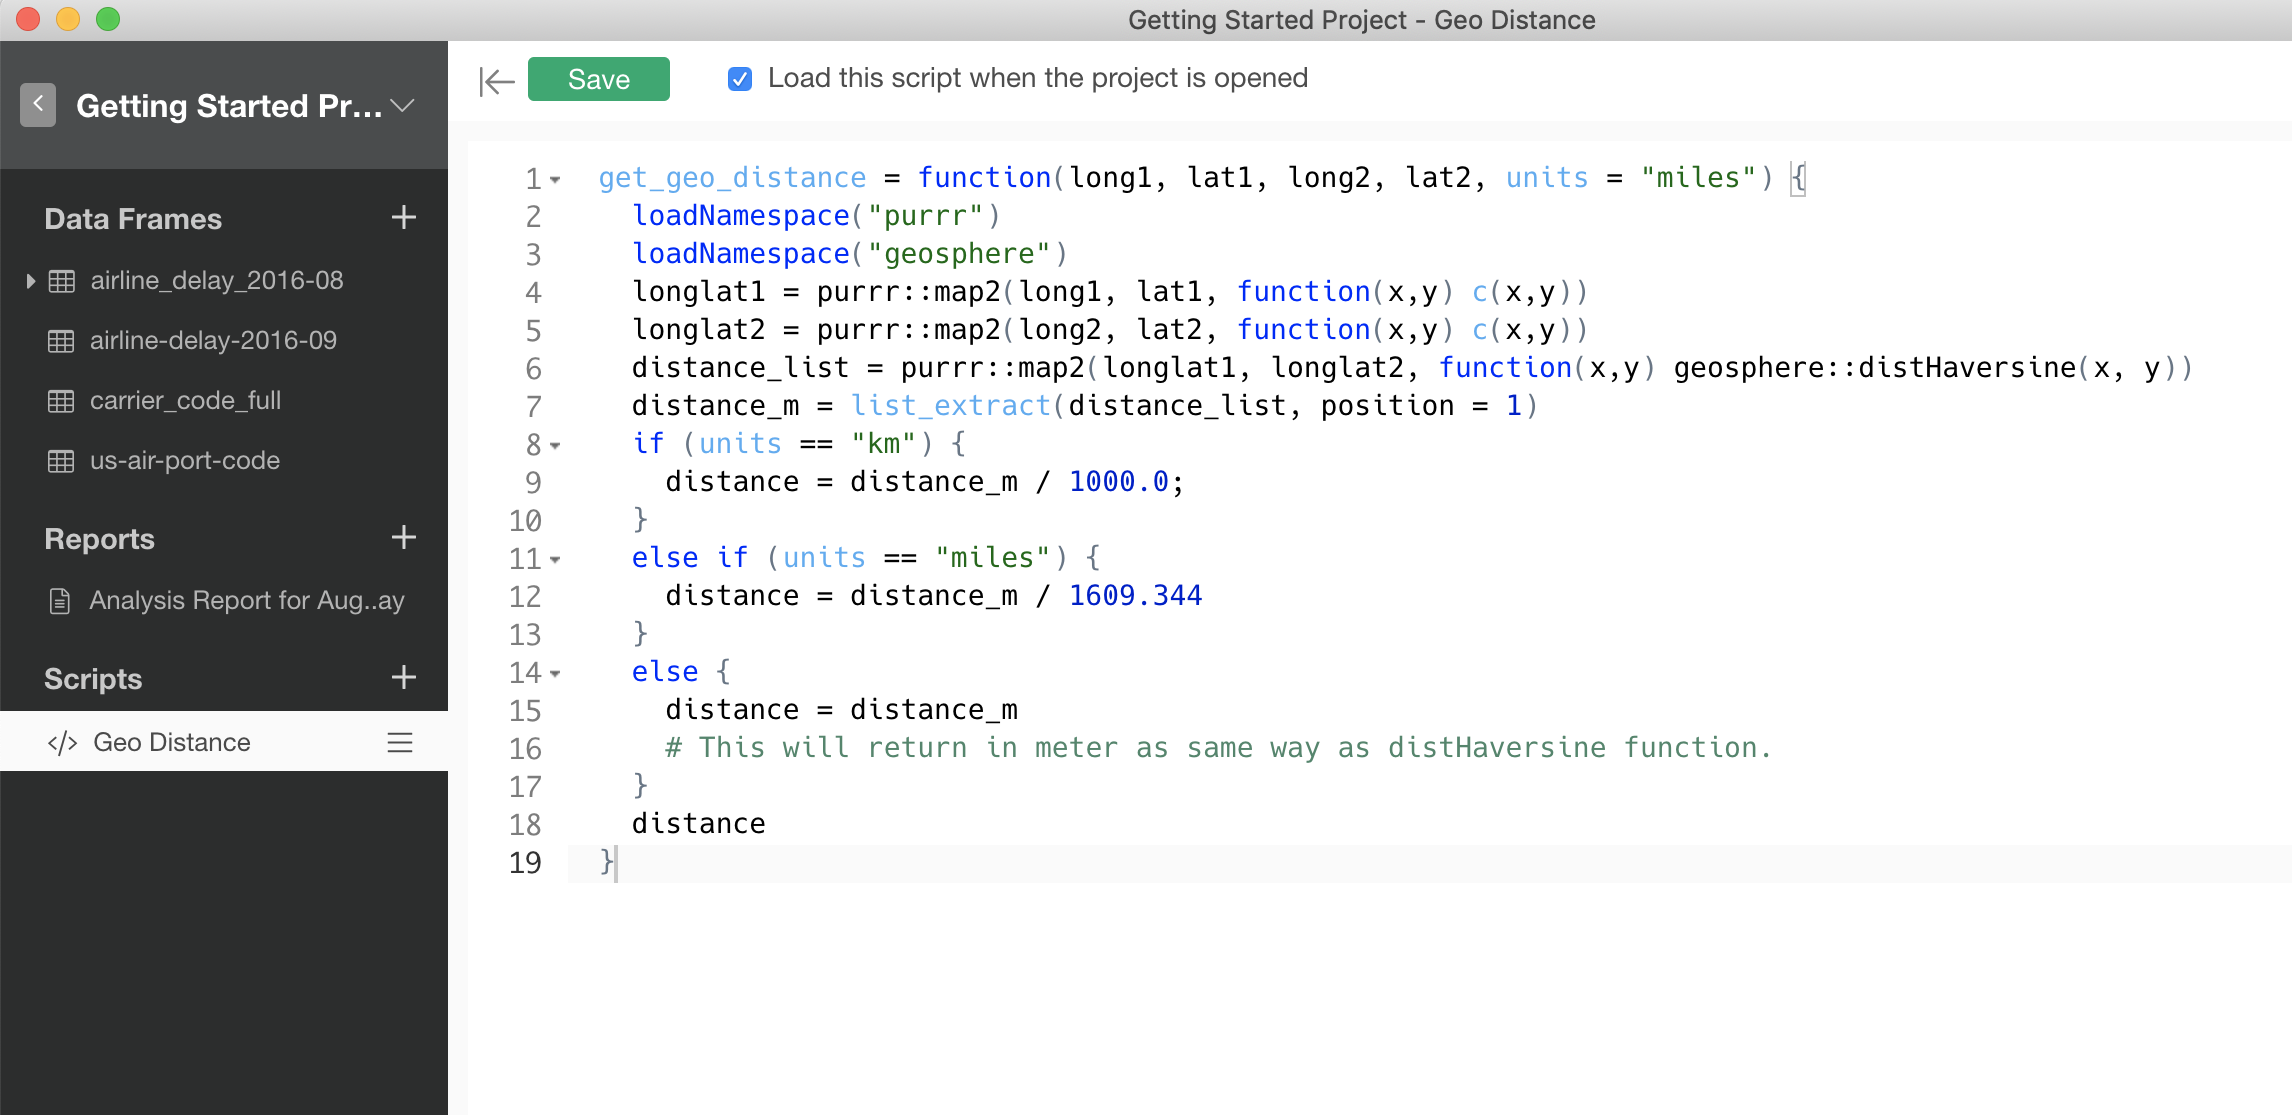
R Script Editor
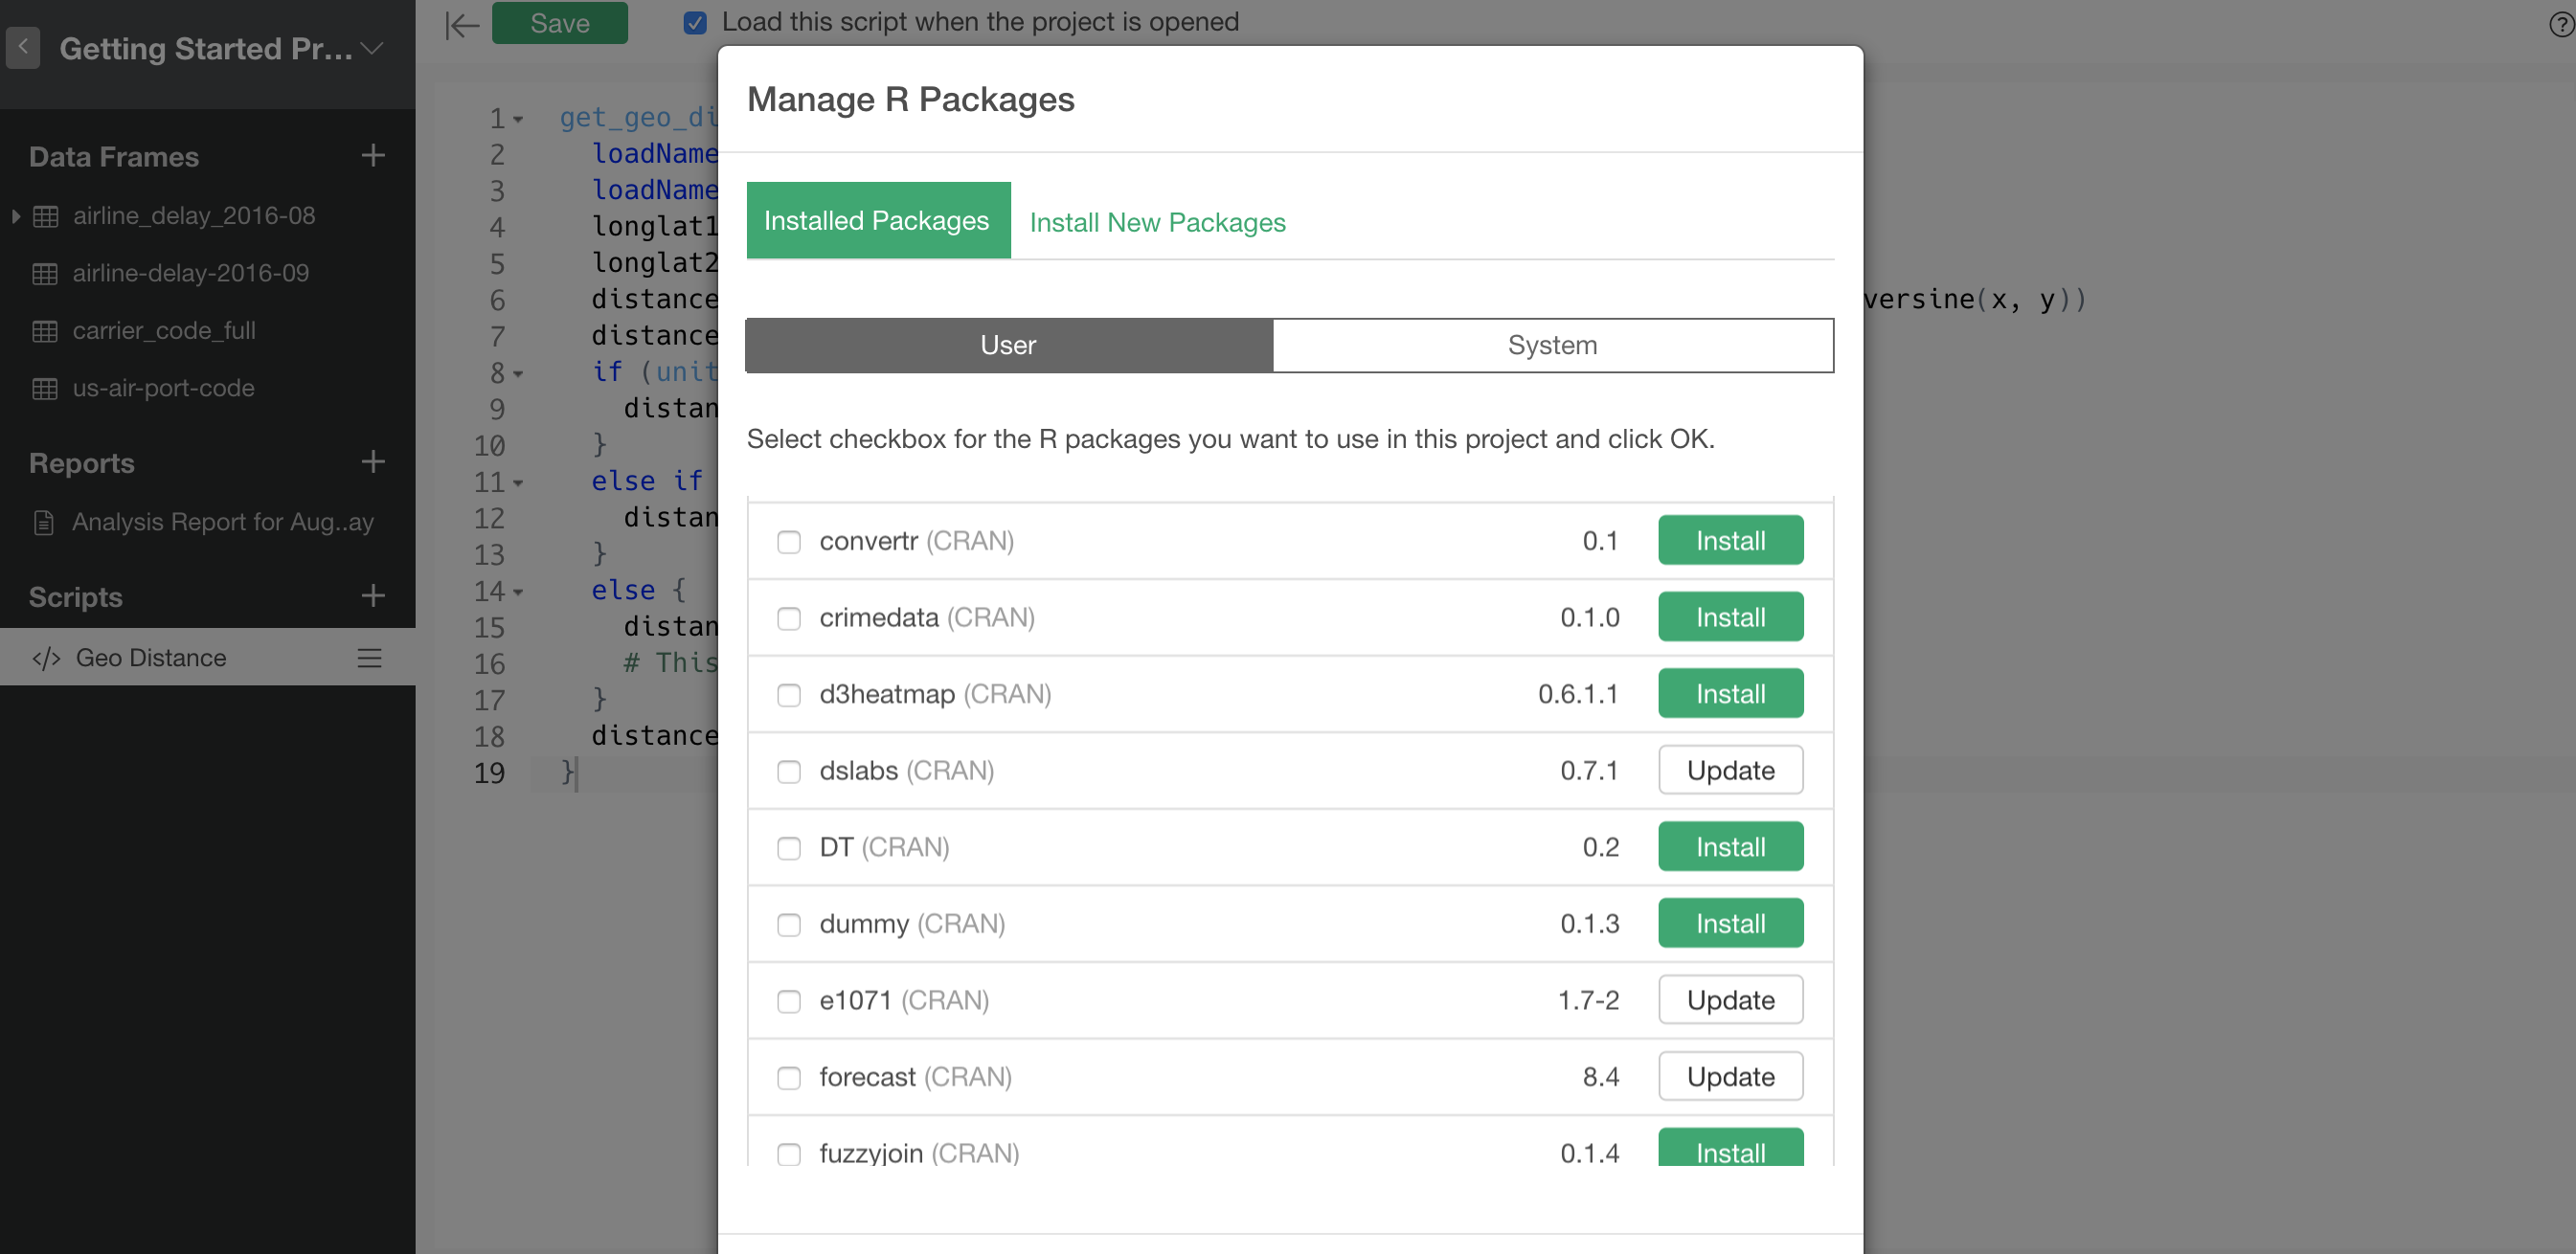
R Package Install
Collaborative Data Science Platform
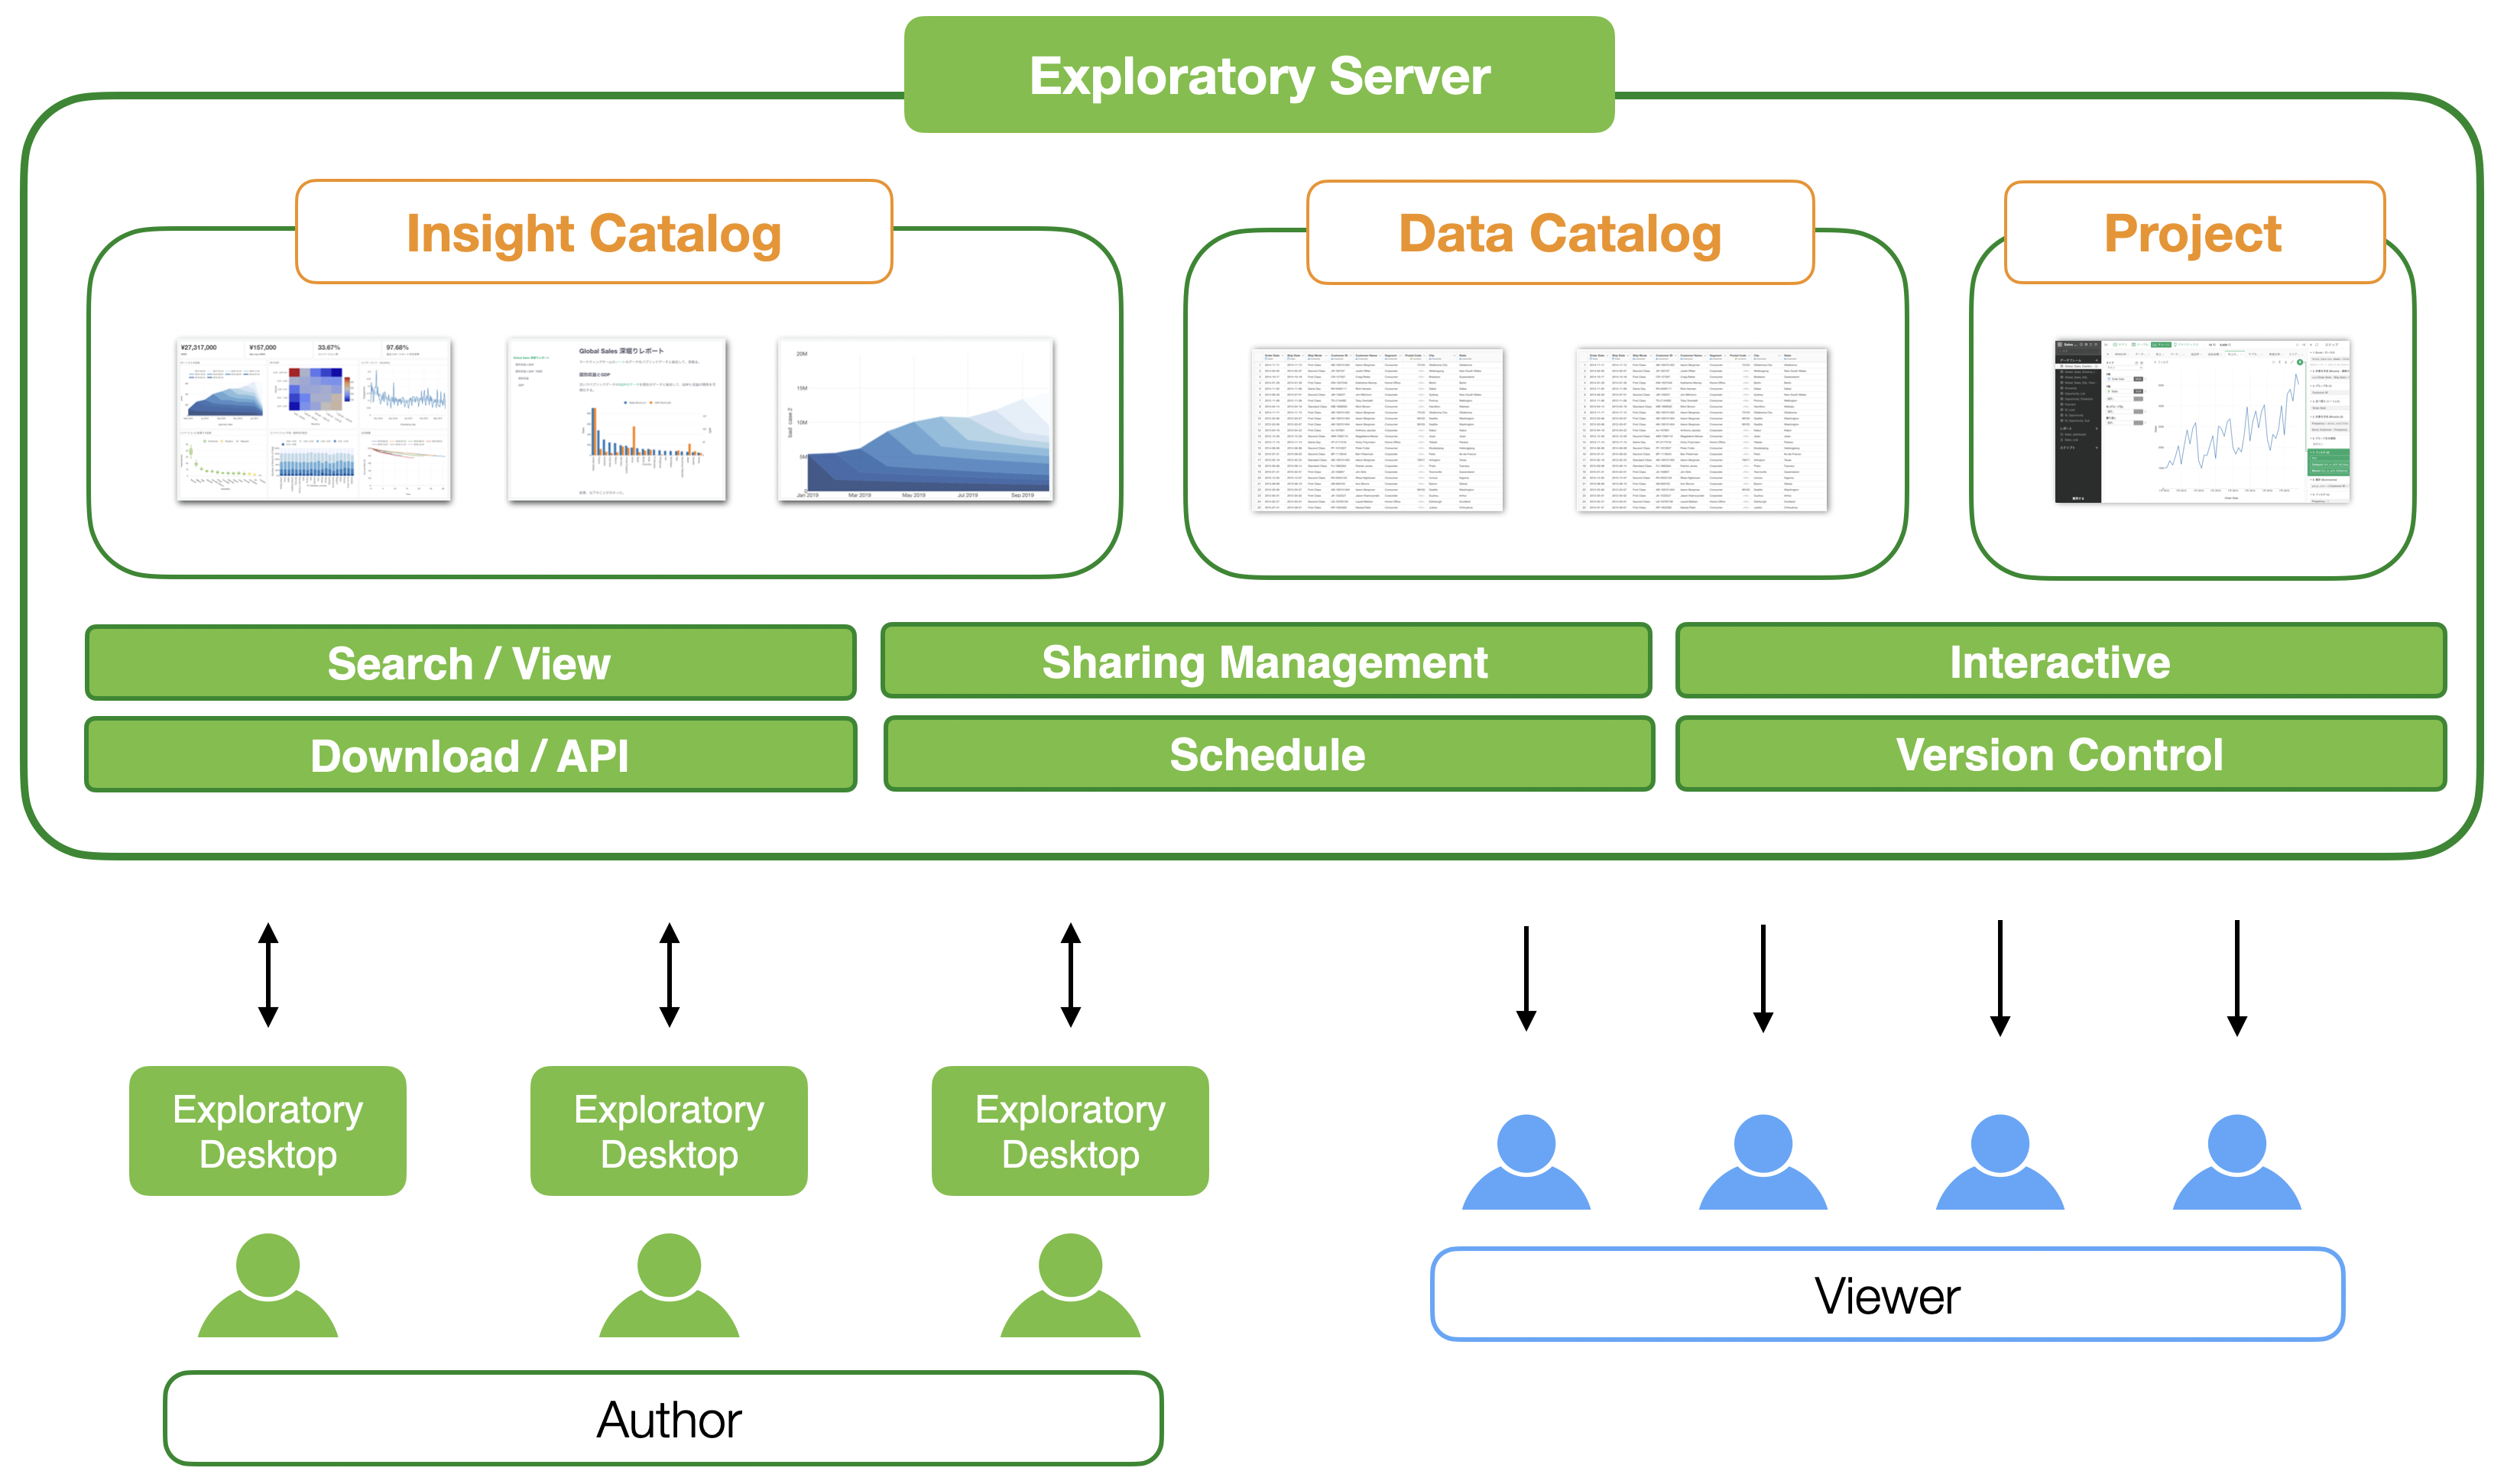
Any data science project requires multiple people to work together. Exploratory provides the best platform where Exploratory users can work together to discover useful insights from data and communicate with others effectively.
Learn by Doing
Are you new to Data Science? No worry!
Exploratory Desktop’s simple and modern UI experience lets you focus on learning various data science methods by using them rather than figuring out how to set up or writing codes.
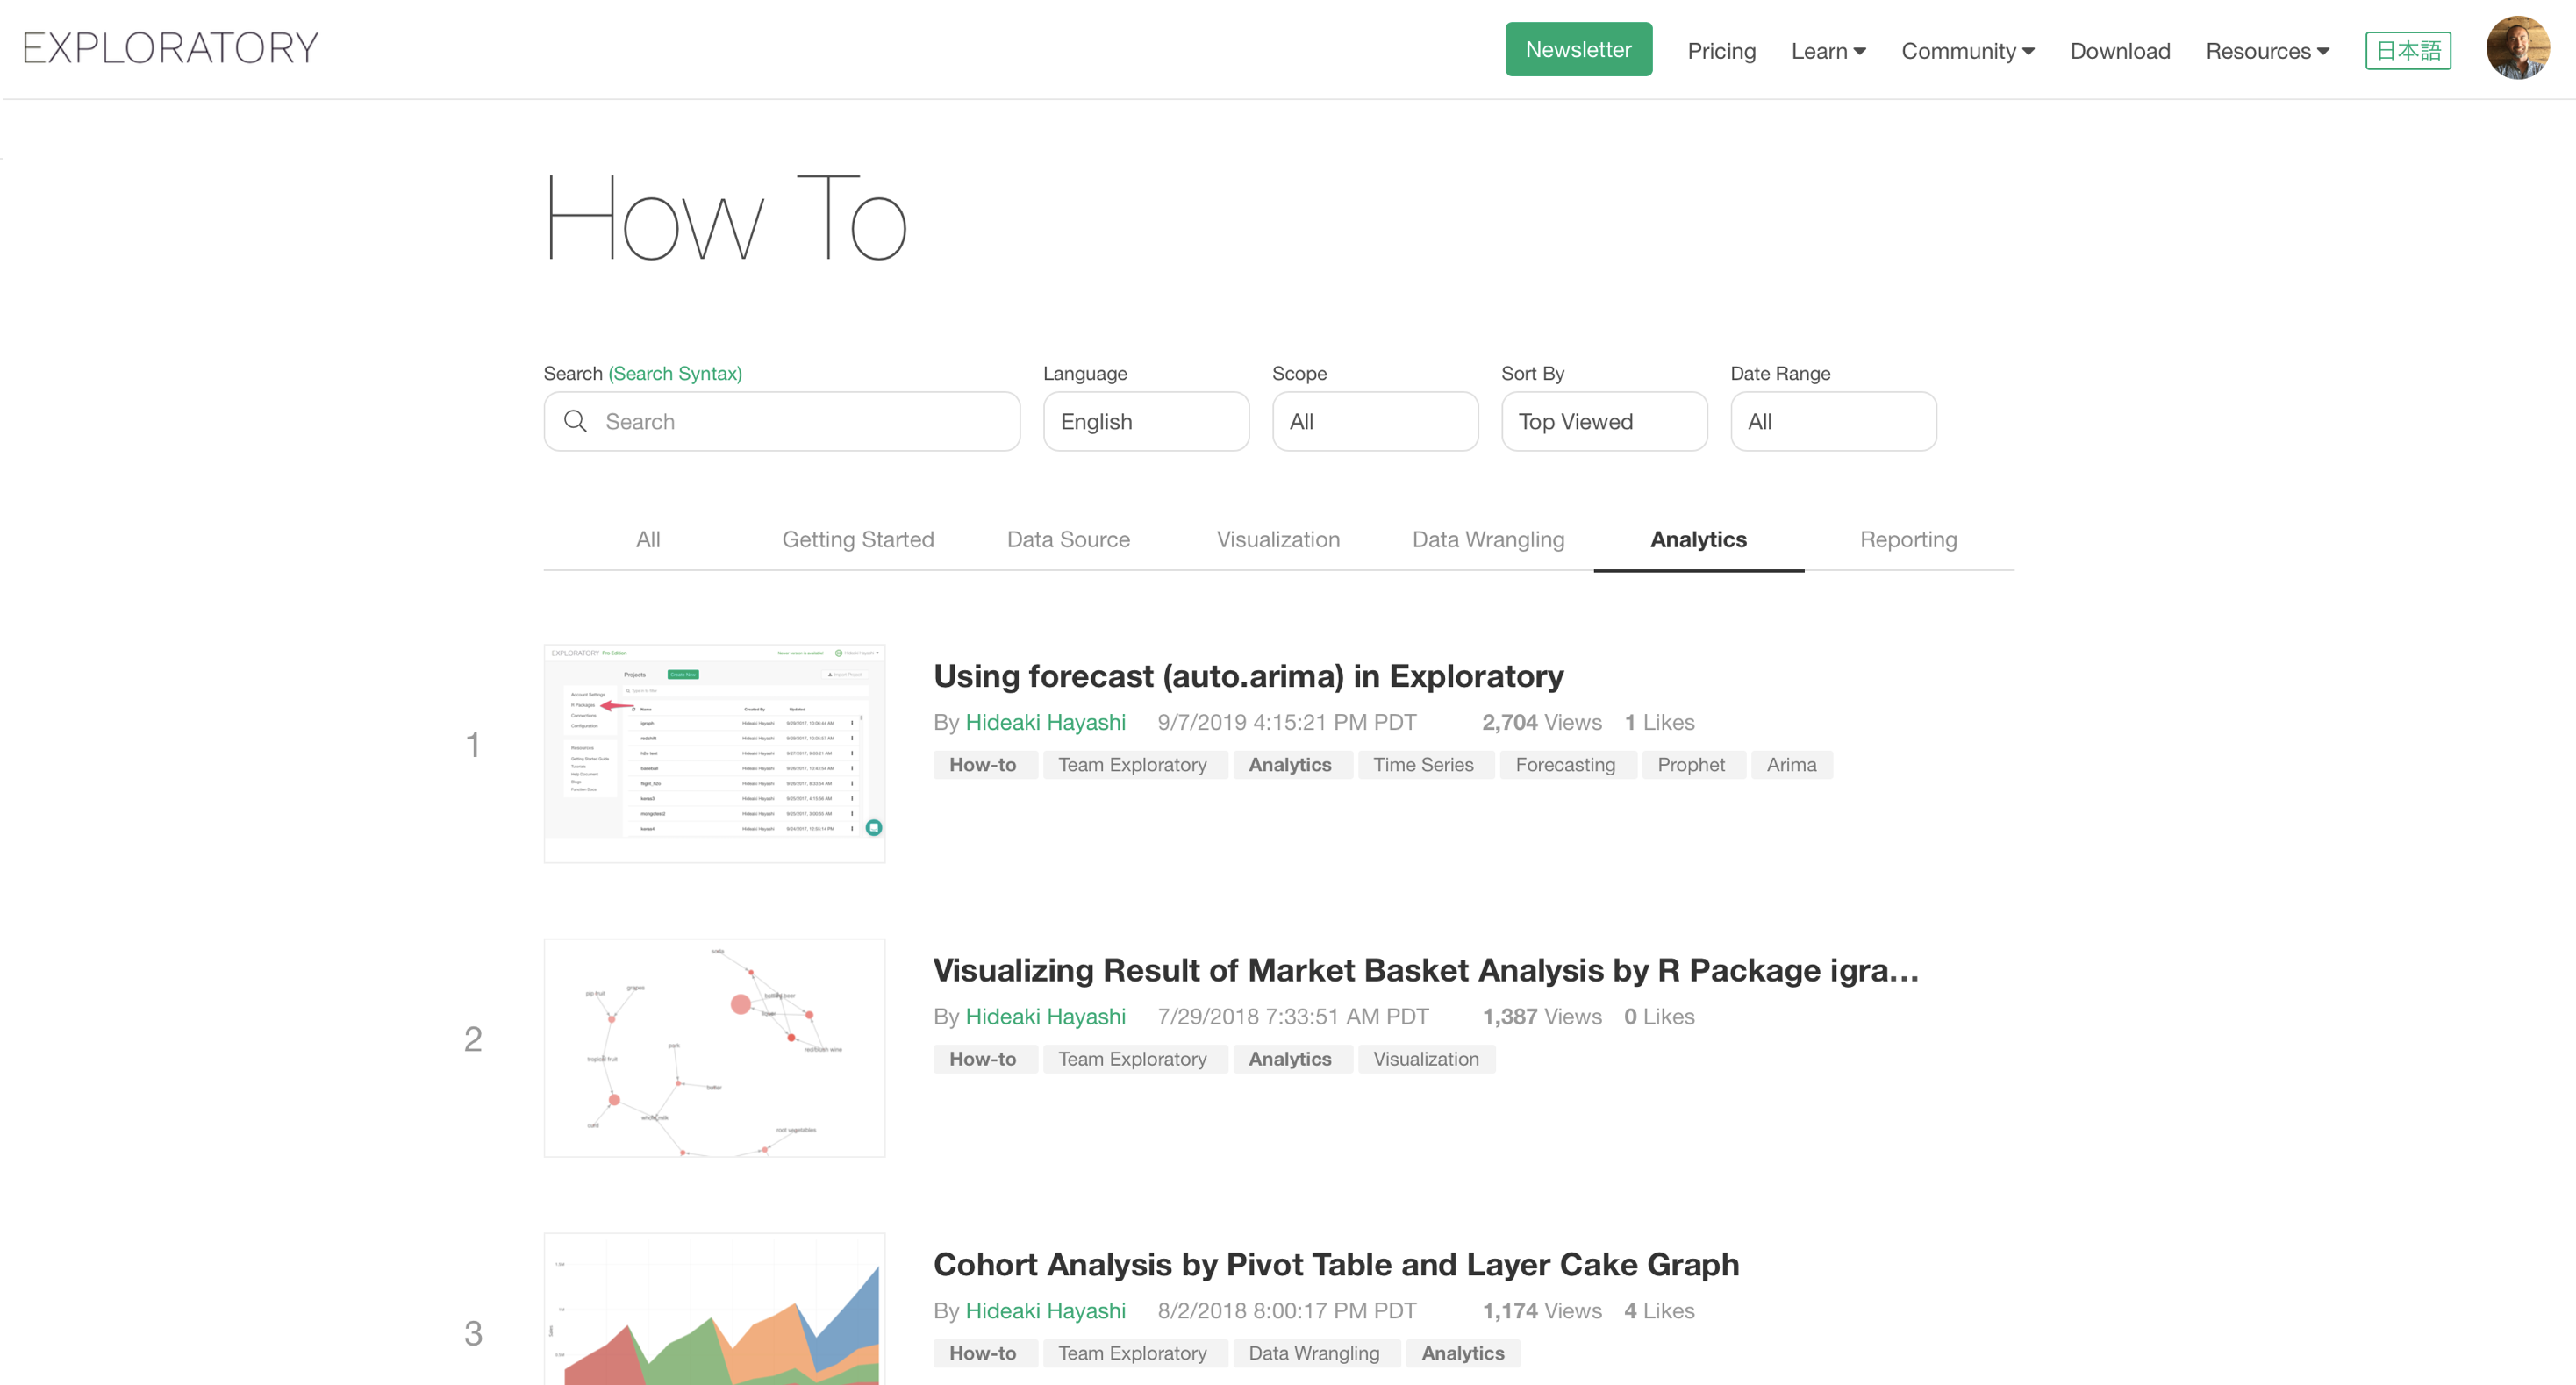
With Exploratory Insight Page, you can find many step-by-step and easy-to-follow tutorials to learn various Data Science methods including Data Wrangling, Data Visualization, Statistics, Machine Learning, etc.
Exploratory Desktop’s simple and modern UI experience lets you focus on learning various data science methods by using them rather than figuring out how to set up or writing codes.
With Exploratory Insight Page, you can find many step-by-step and easy-to-follow tutorials to learn various Data Science methods including Data Wrangling, Data Visualization, Statistics, Machine Learning, etc.