Drawing Trend Line for Chart
I’m going to use Line chart to demonstrate how to draw the Trend Line.
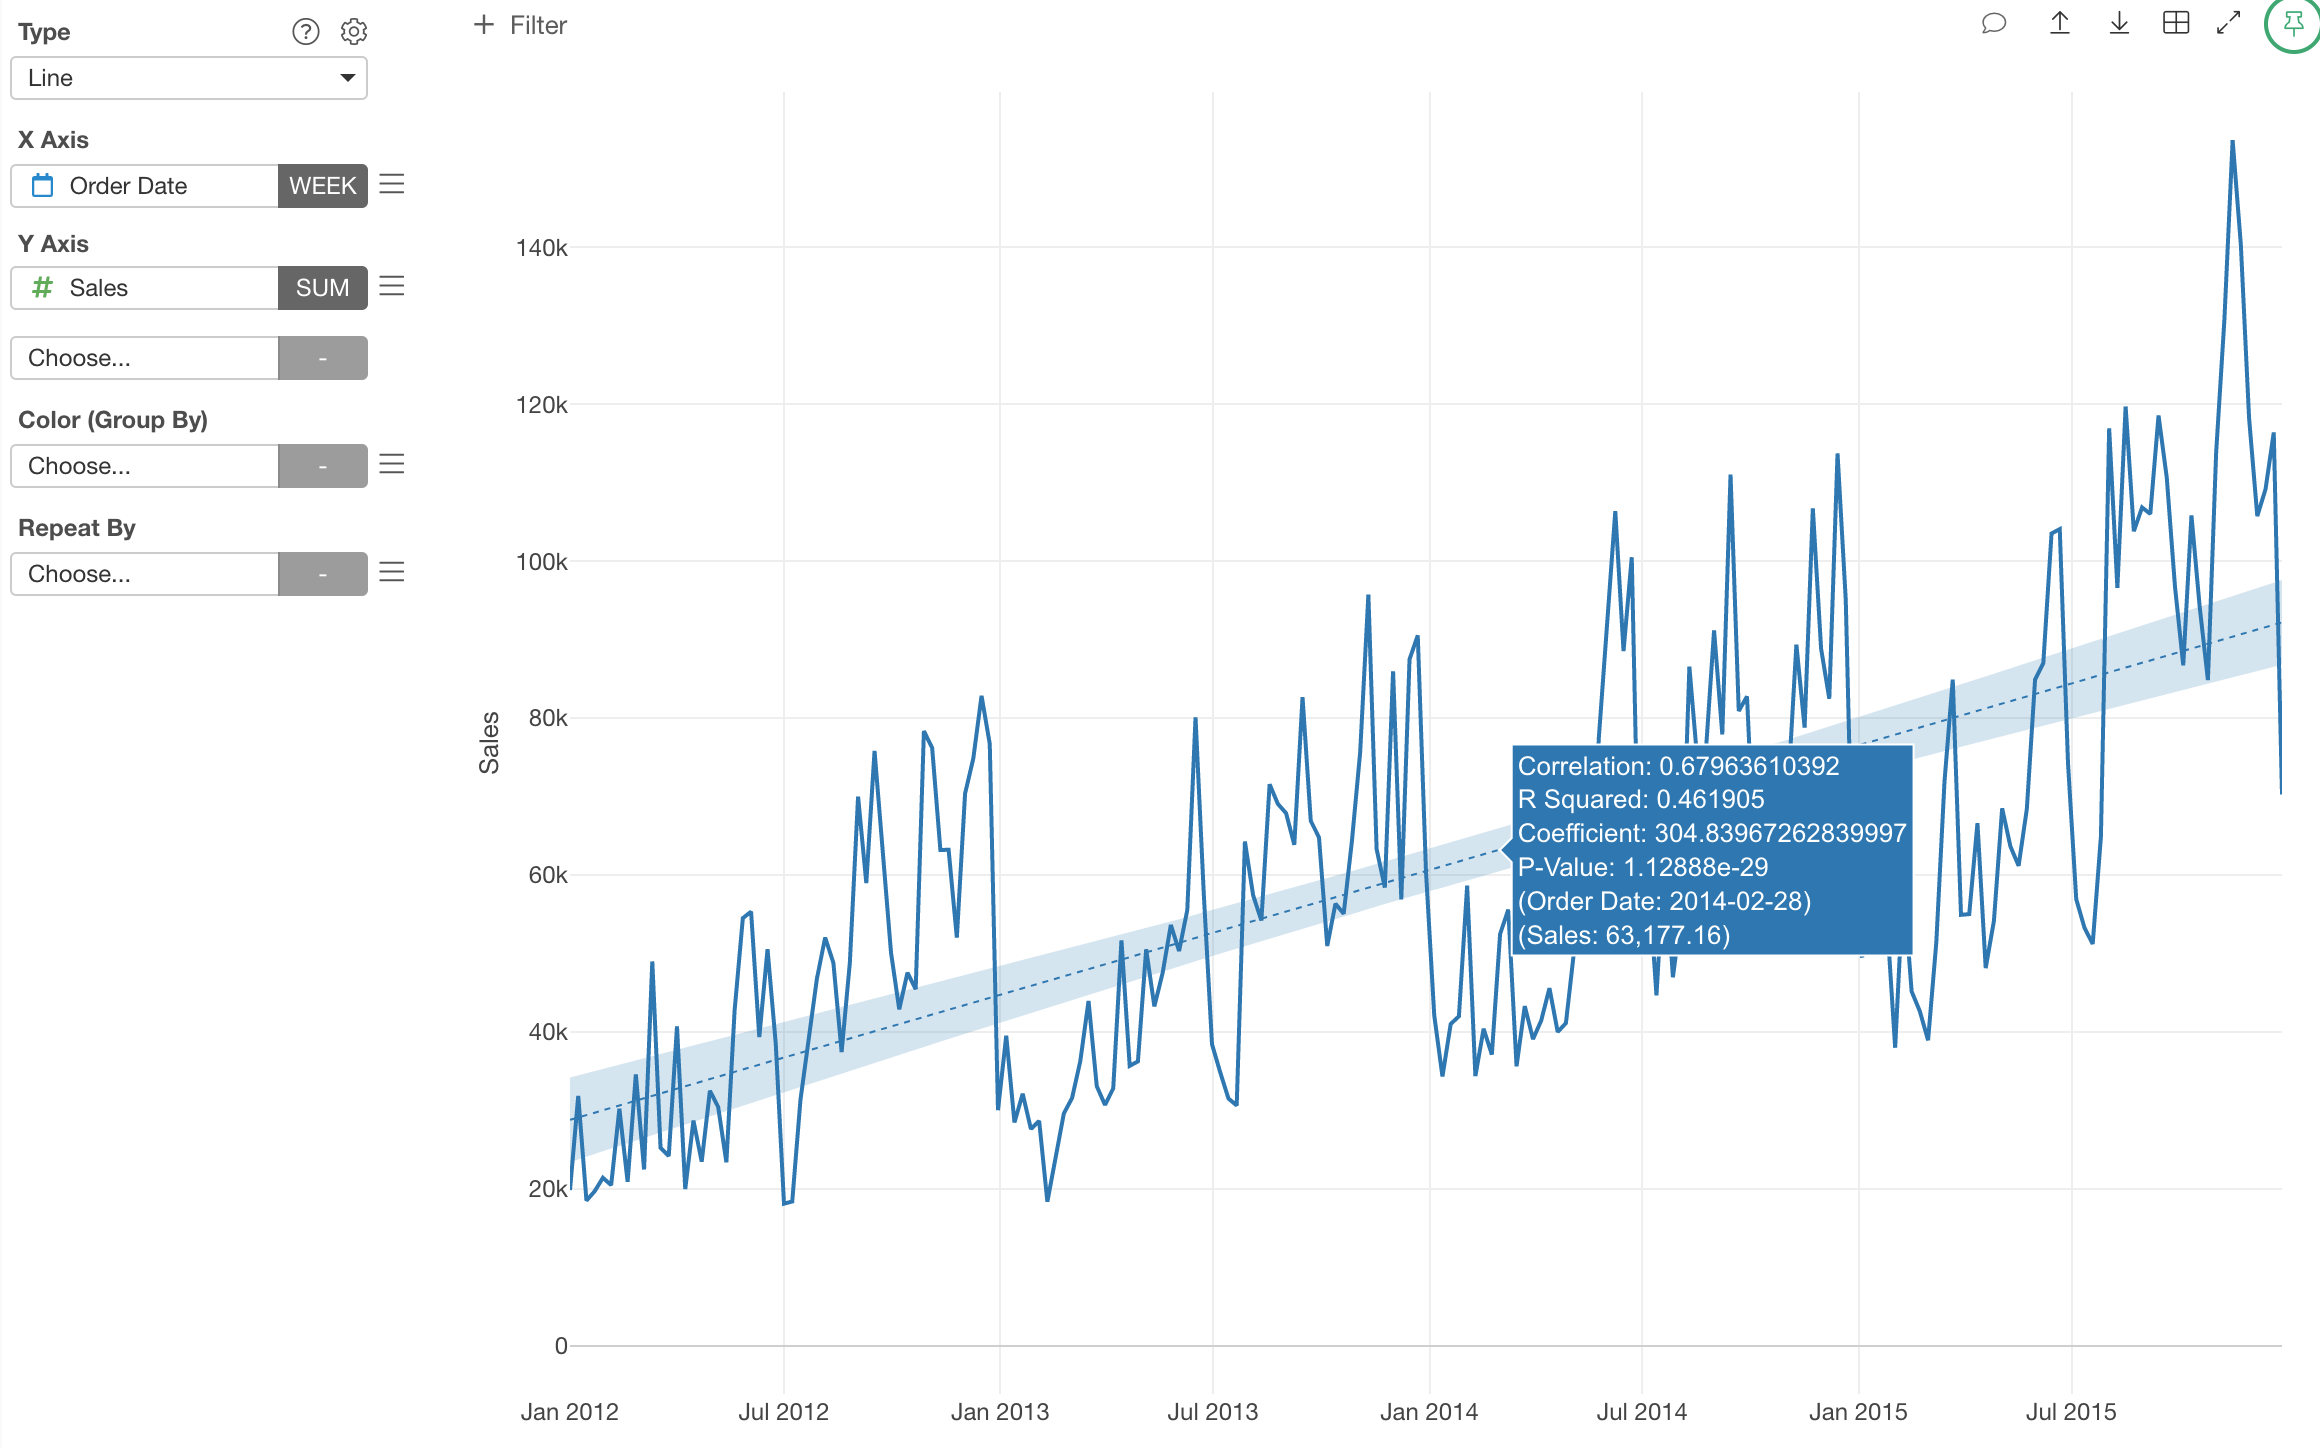
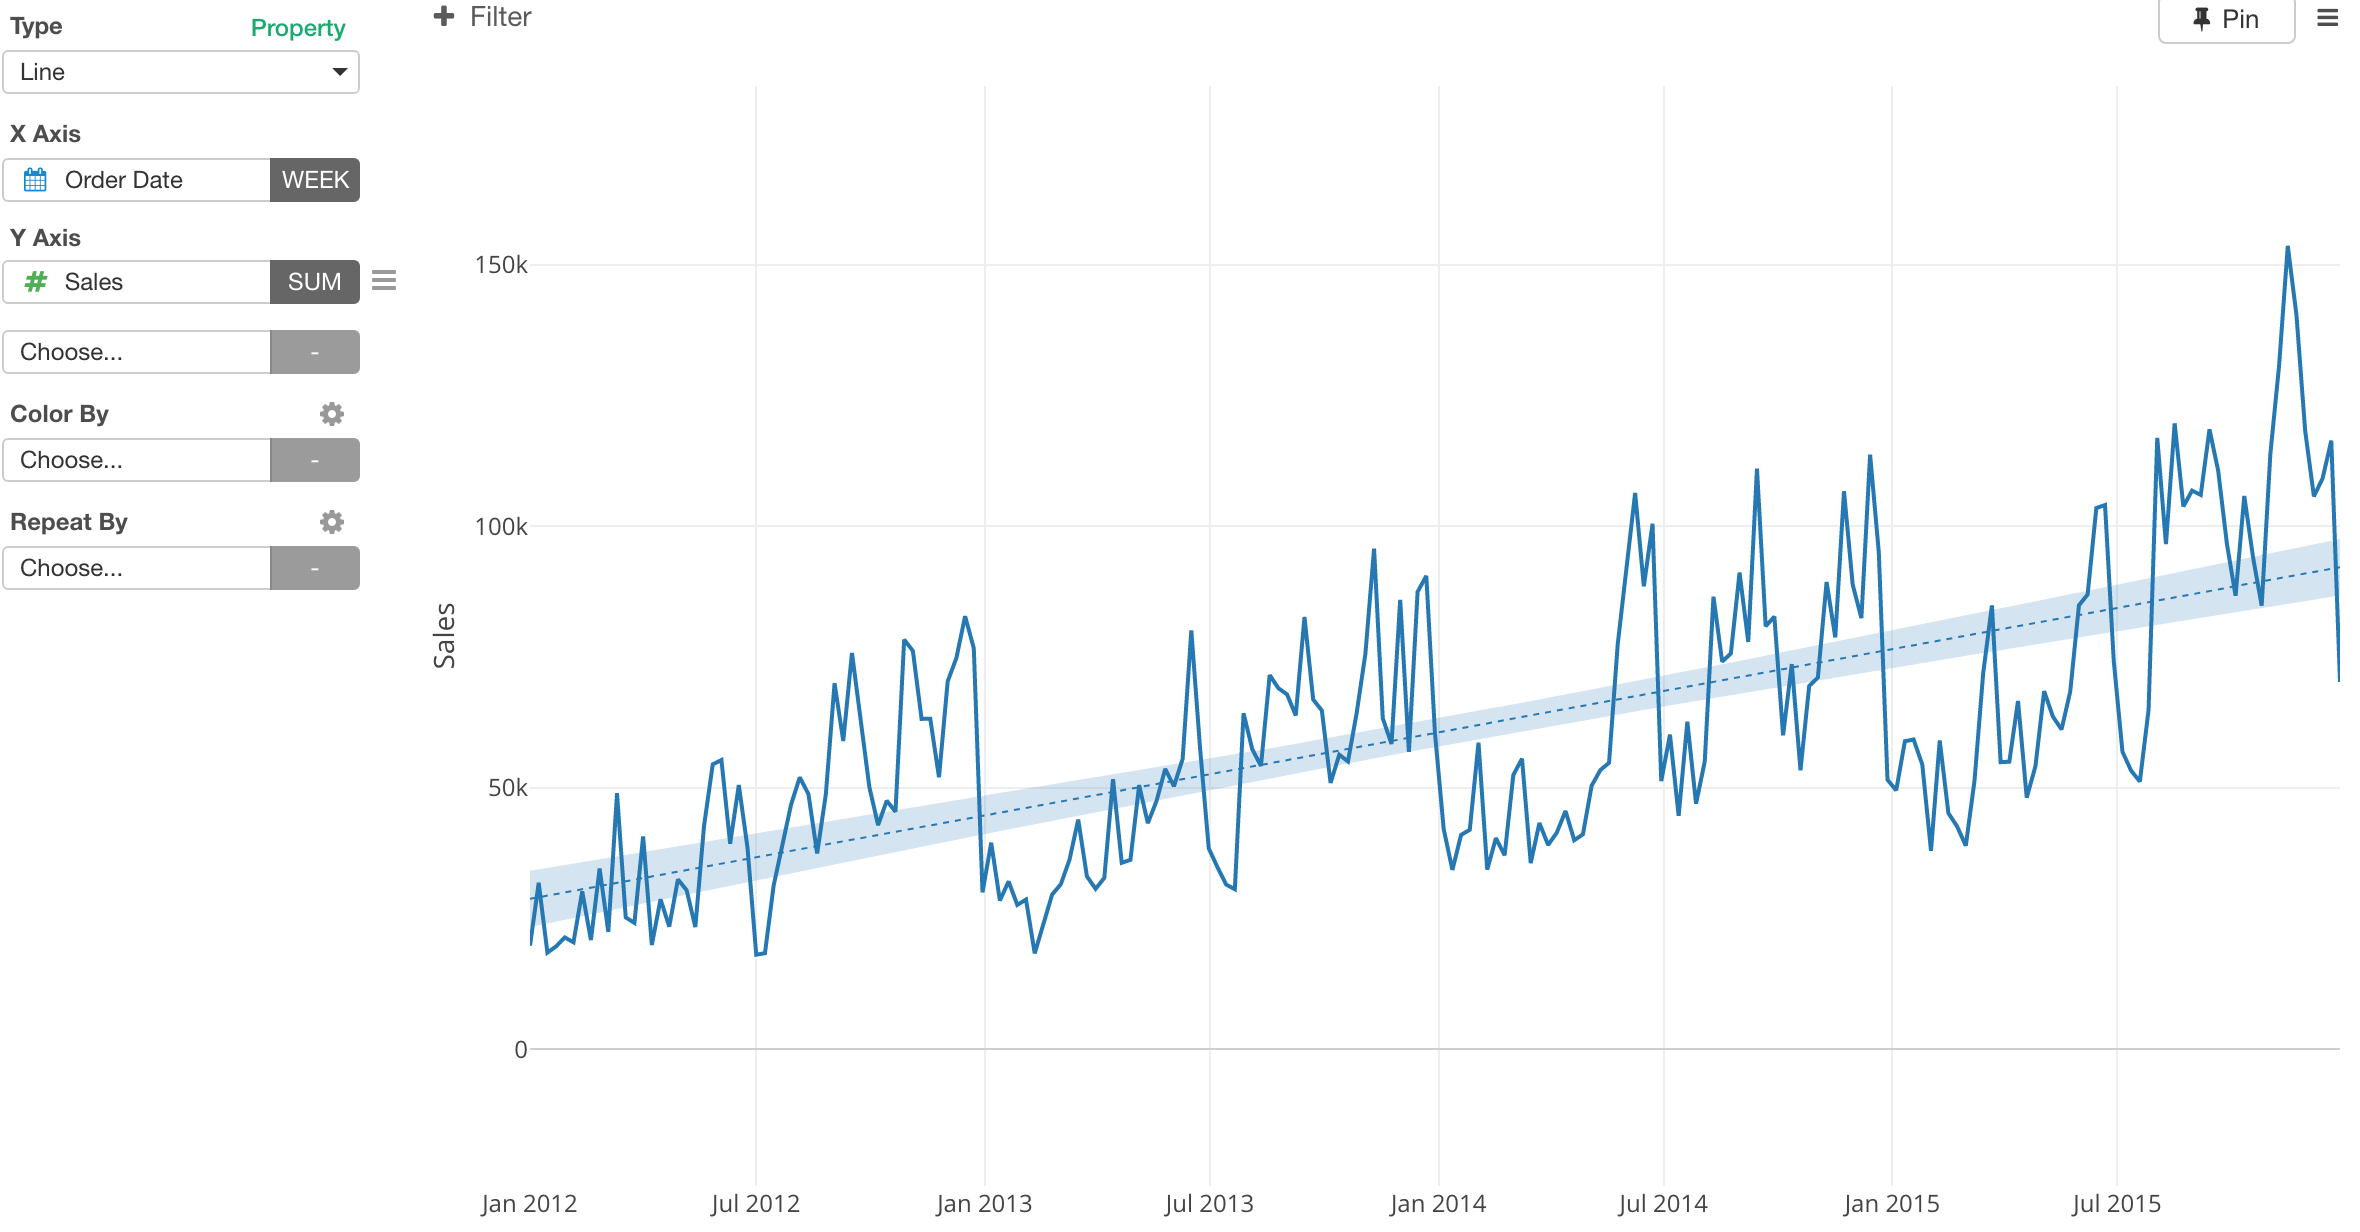
You can show a trend line for Line chart (and Scatter/Bubble) like below.
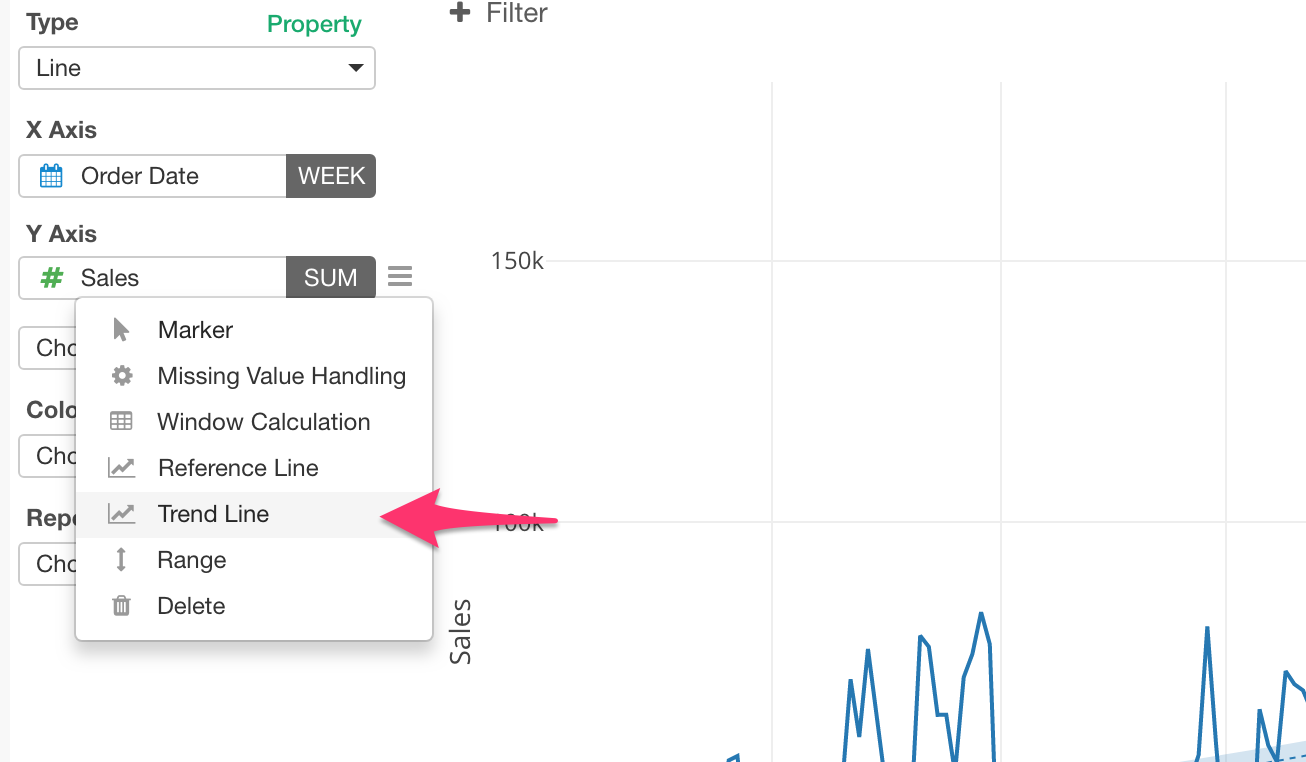
You can access to Trend Line Setting dialog from Y Axis menu.
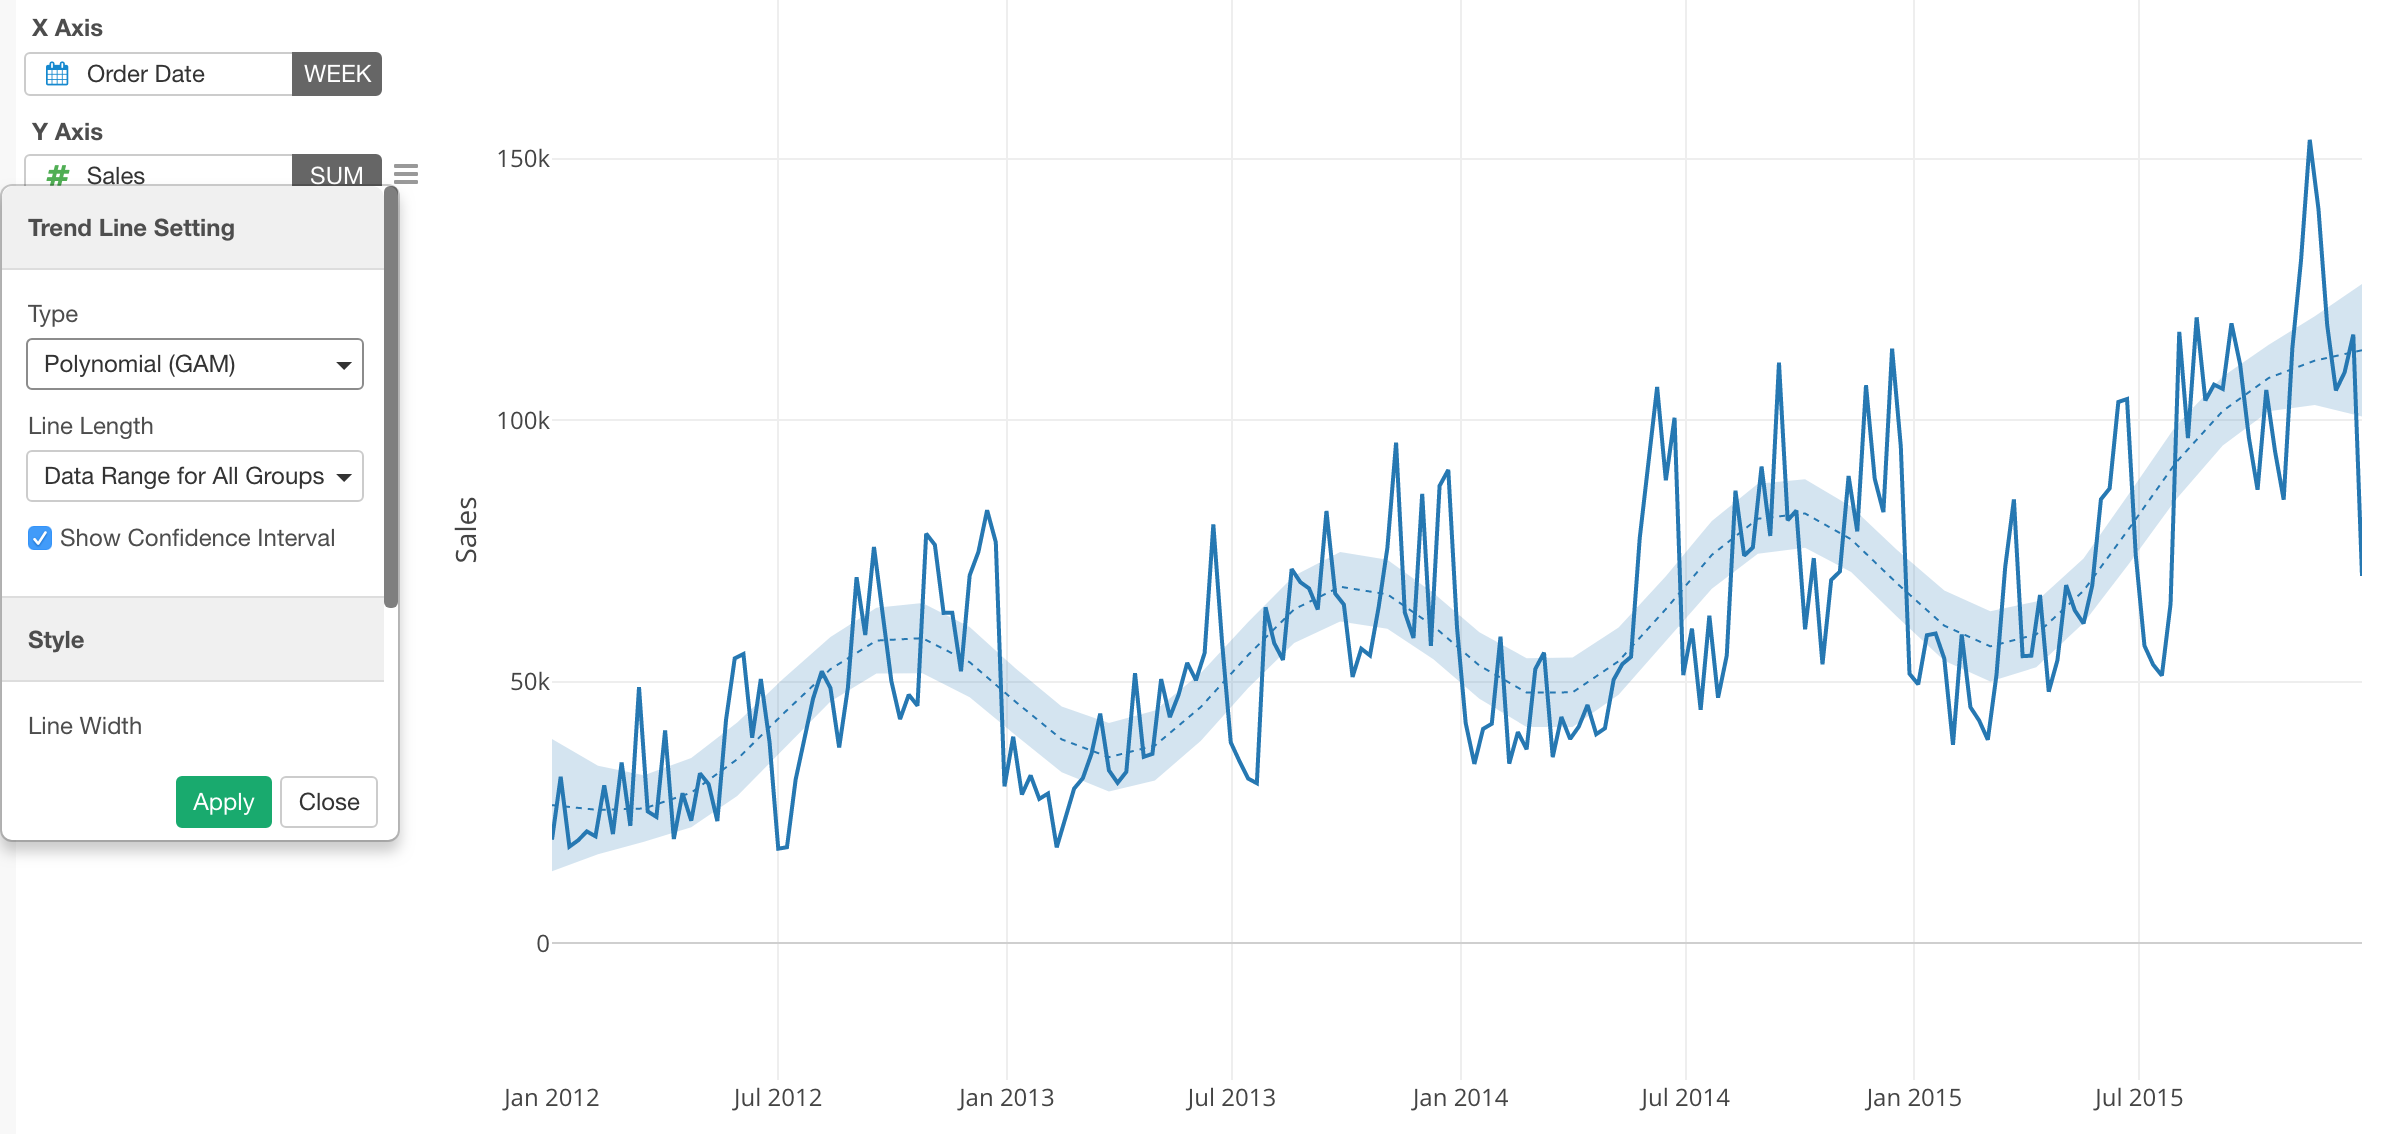
There are different methods to calculate the trend line. Exploratory supports the following three.
- Linear Regression
- GAM
- Polynomial
GAM and Polynomial tend to make the line more smooth along the base line while Linear Regression always draw a straight line.
Regardless of the methods, it builds a predication model behind the scene to draw the trend line. This means that you can see some of the model quality metrics in the pop-up when you move the mouse over on the line.