Batch Calculation Processing for Multiple Columns Using AI Prompt
Exploratory’s “AI Prompt” feature dramatically improves efficiency in data wrangling (data processing and formatting), which is often the most time-consuming part of the data analysis workflow. Traditional data processing required complex UI operations or specialized code writing for batch calculation processing across columns. Depending on the processing required, you might have needed to modify each column individually, which was not only inefficient but also prone to errors.
The innovative aspect of the AI Prompt feature is that it can execute batch processing across multiple columns with simple natural language instructions in English, such as “normalize all numeric columns.” By simply communicating what you want to do in words, AI generates appropriate R commands and executes the processing. This significantly reduces the time spent on data processing, allowing you to dedicate more time to discovering insights from your data and making decisions, which is the true purpose of data analysis.
1. When Can This Be Used?
The batch calculation processing with AI Prompt is useful in various data analysis scenarios.
For example, it can streamline fundamental data analysis tasks such as normalizing values during data preprocessing, handling outliers, and cleaning text data. By processing these with AI Prompts, you can substantially reduce the time spent on preliminary stages of analysis and focus on more valuable analytical work.
The AI Prompt feature is particularly effective with the following types of data when executing processing across multiple columns:
- Sales data or analytical datasets containing multiple numeric columns
- Measurement data or survey data that may contain outliers
- Customer information or survey data containing mixed full-width/half-width characters or unnecessary spaces in string data
2. Utilizing AI Prompts in Exploratory
Normalize All Numeric Columns
In this example, we’ll use “Order Data.”
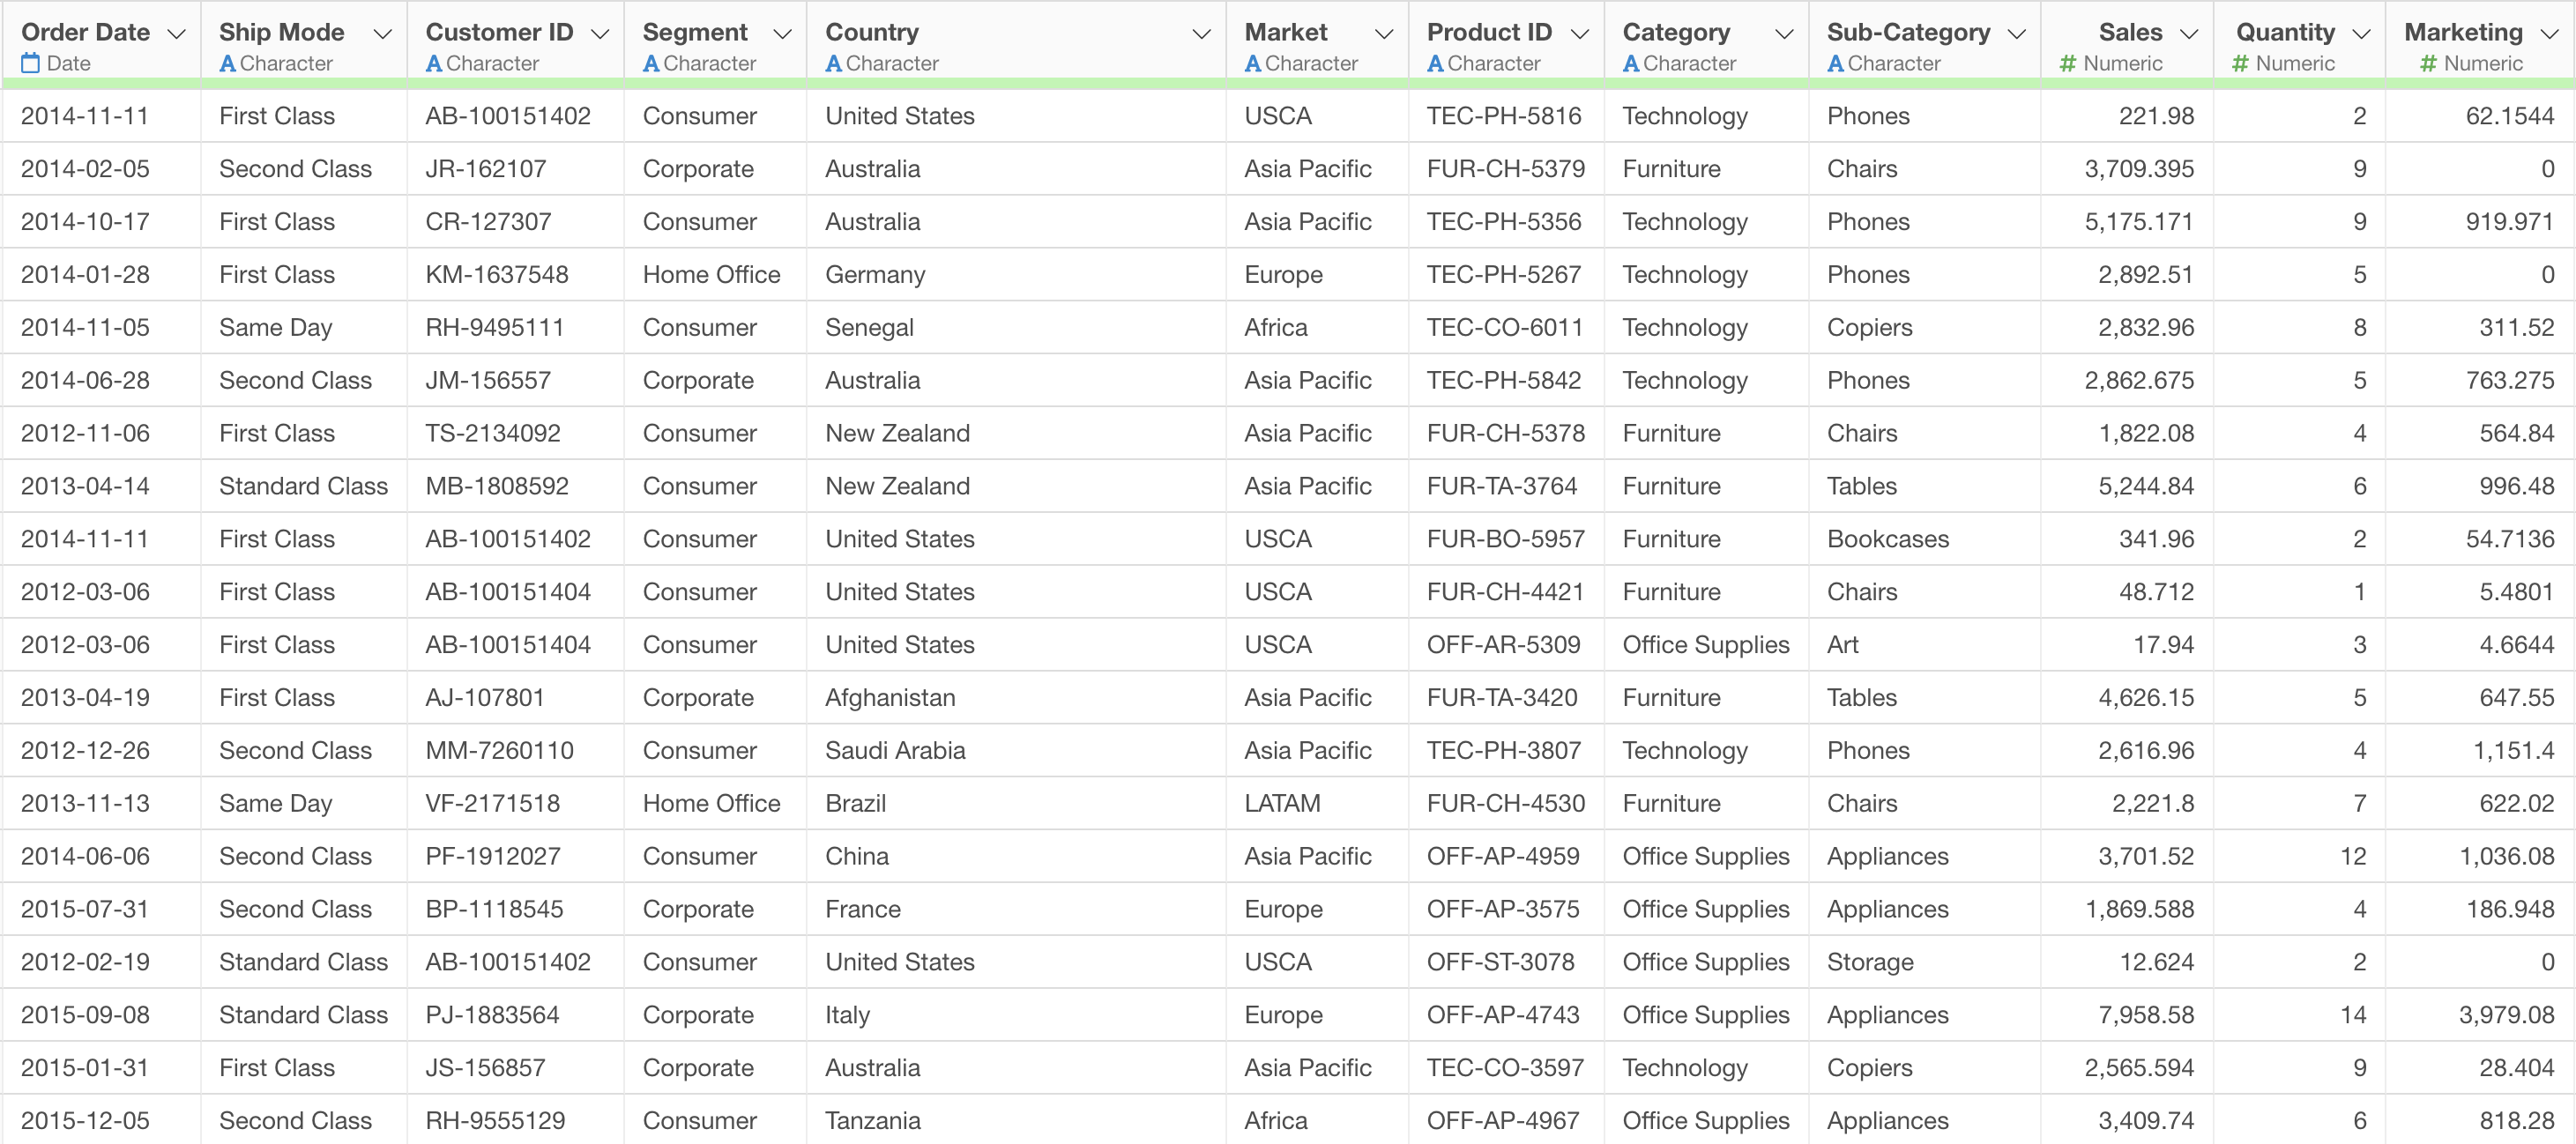 This
data contains customer order information with numeric columns such as
sales, quantity, direct mail costs, etc. We want to normalize these
numeric columns at once to make it easier to compare different
units.
This
data contains customer order information with numeric columns such as
sales, quantity, direct mail costs, etc. We want to normalize these
numeric columns at once to make it easier to compare different
units.
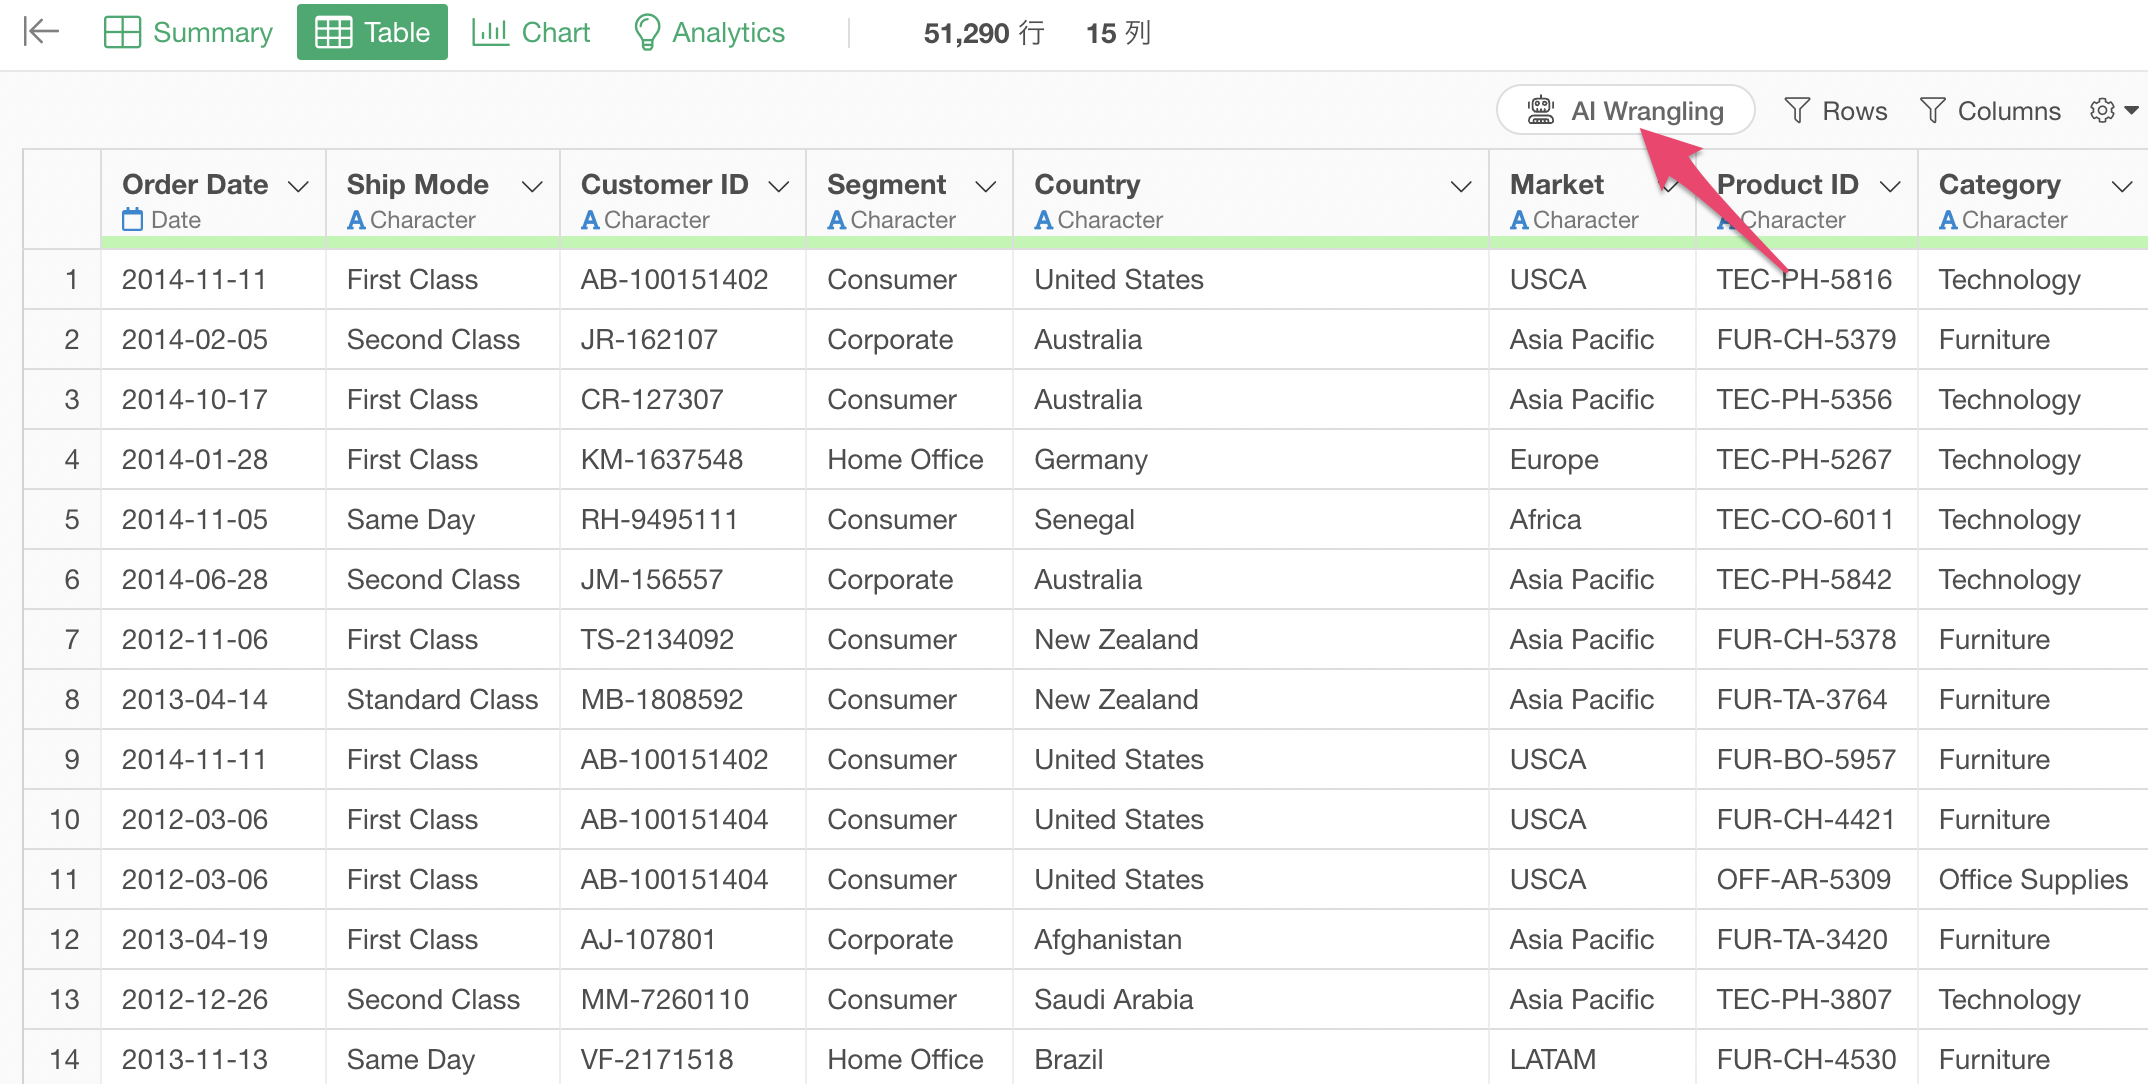
Click the “AI Wrangling” button from the table view to open the AI Prompt feature.
Enter the following prompt in the prompt input field:
Normalize all numeric columns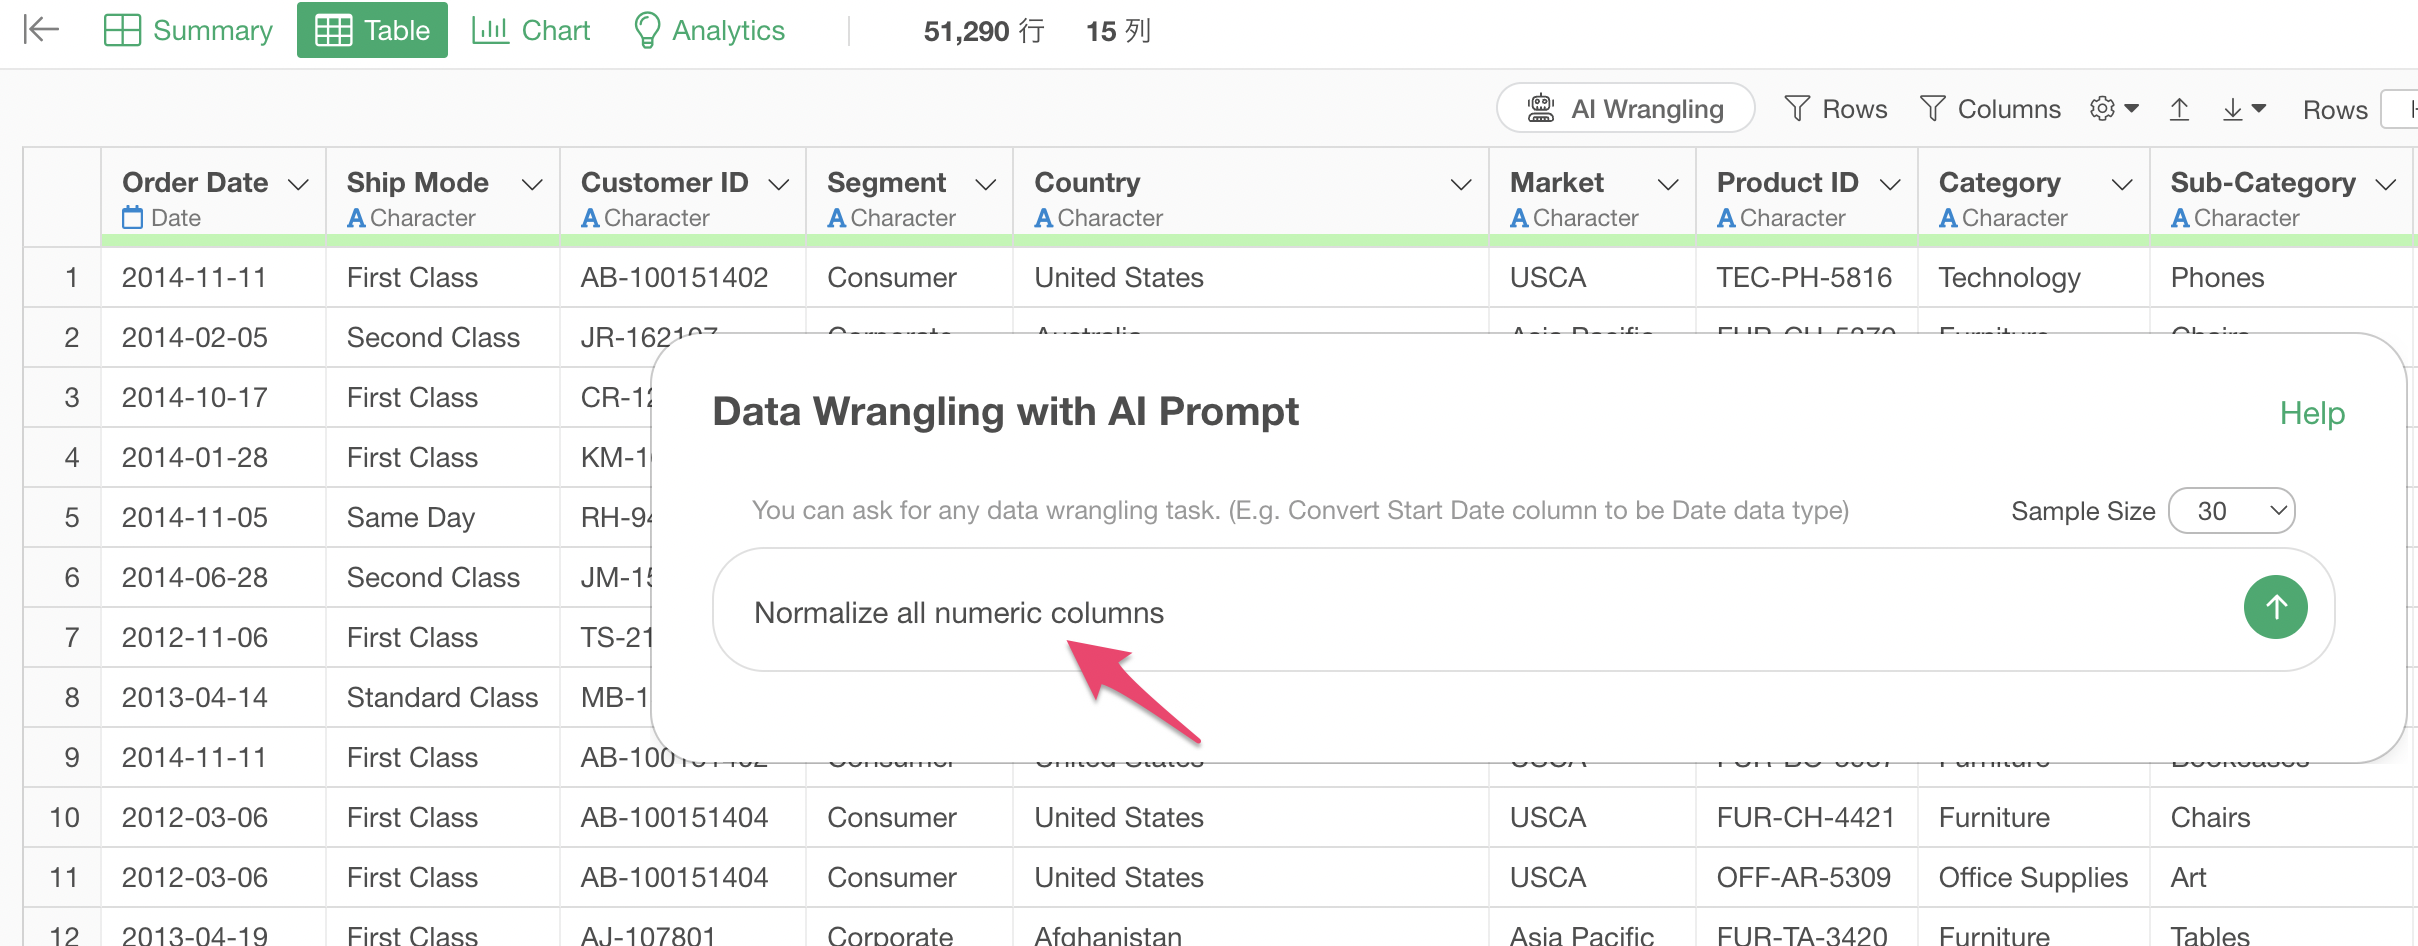
When you execute the prompt, AI automatically generates the following R script:
mutate(
  `Sales` = normalize(`Sales`),
  `Quantity` = normalize(`Quantity`),
  `Marketing` = normalize(`Marketing`),
  `Sales Comp` = normalize(`Sales Comp`)
)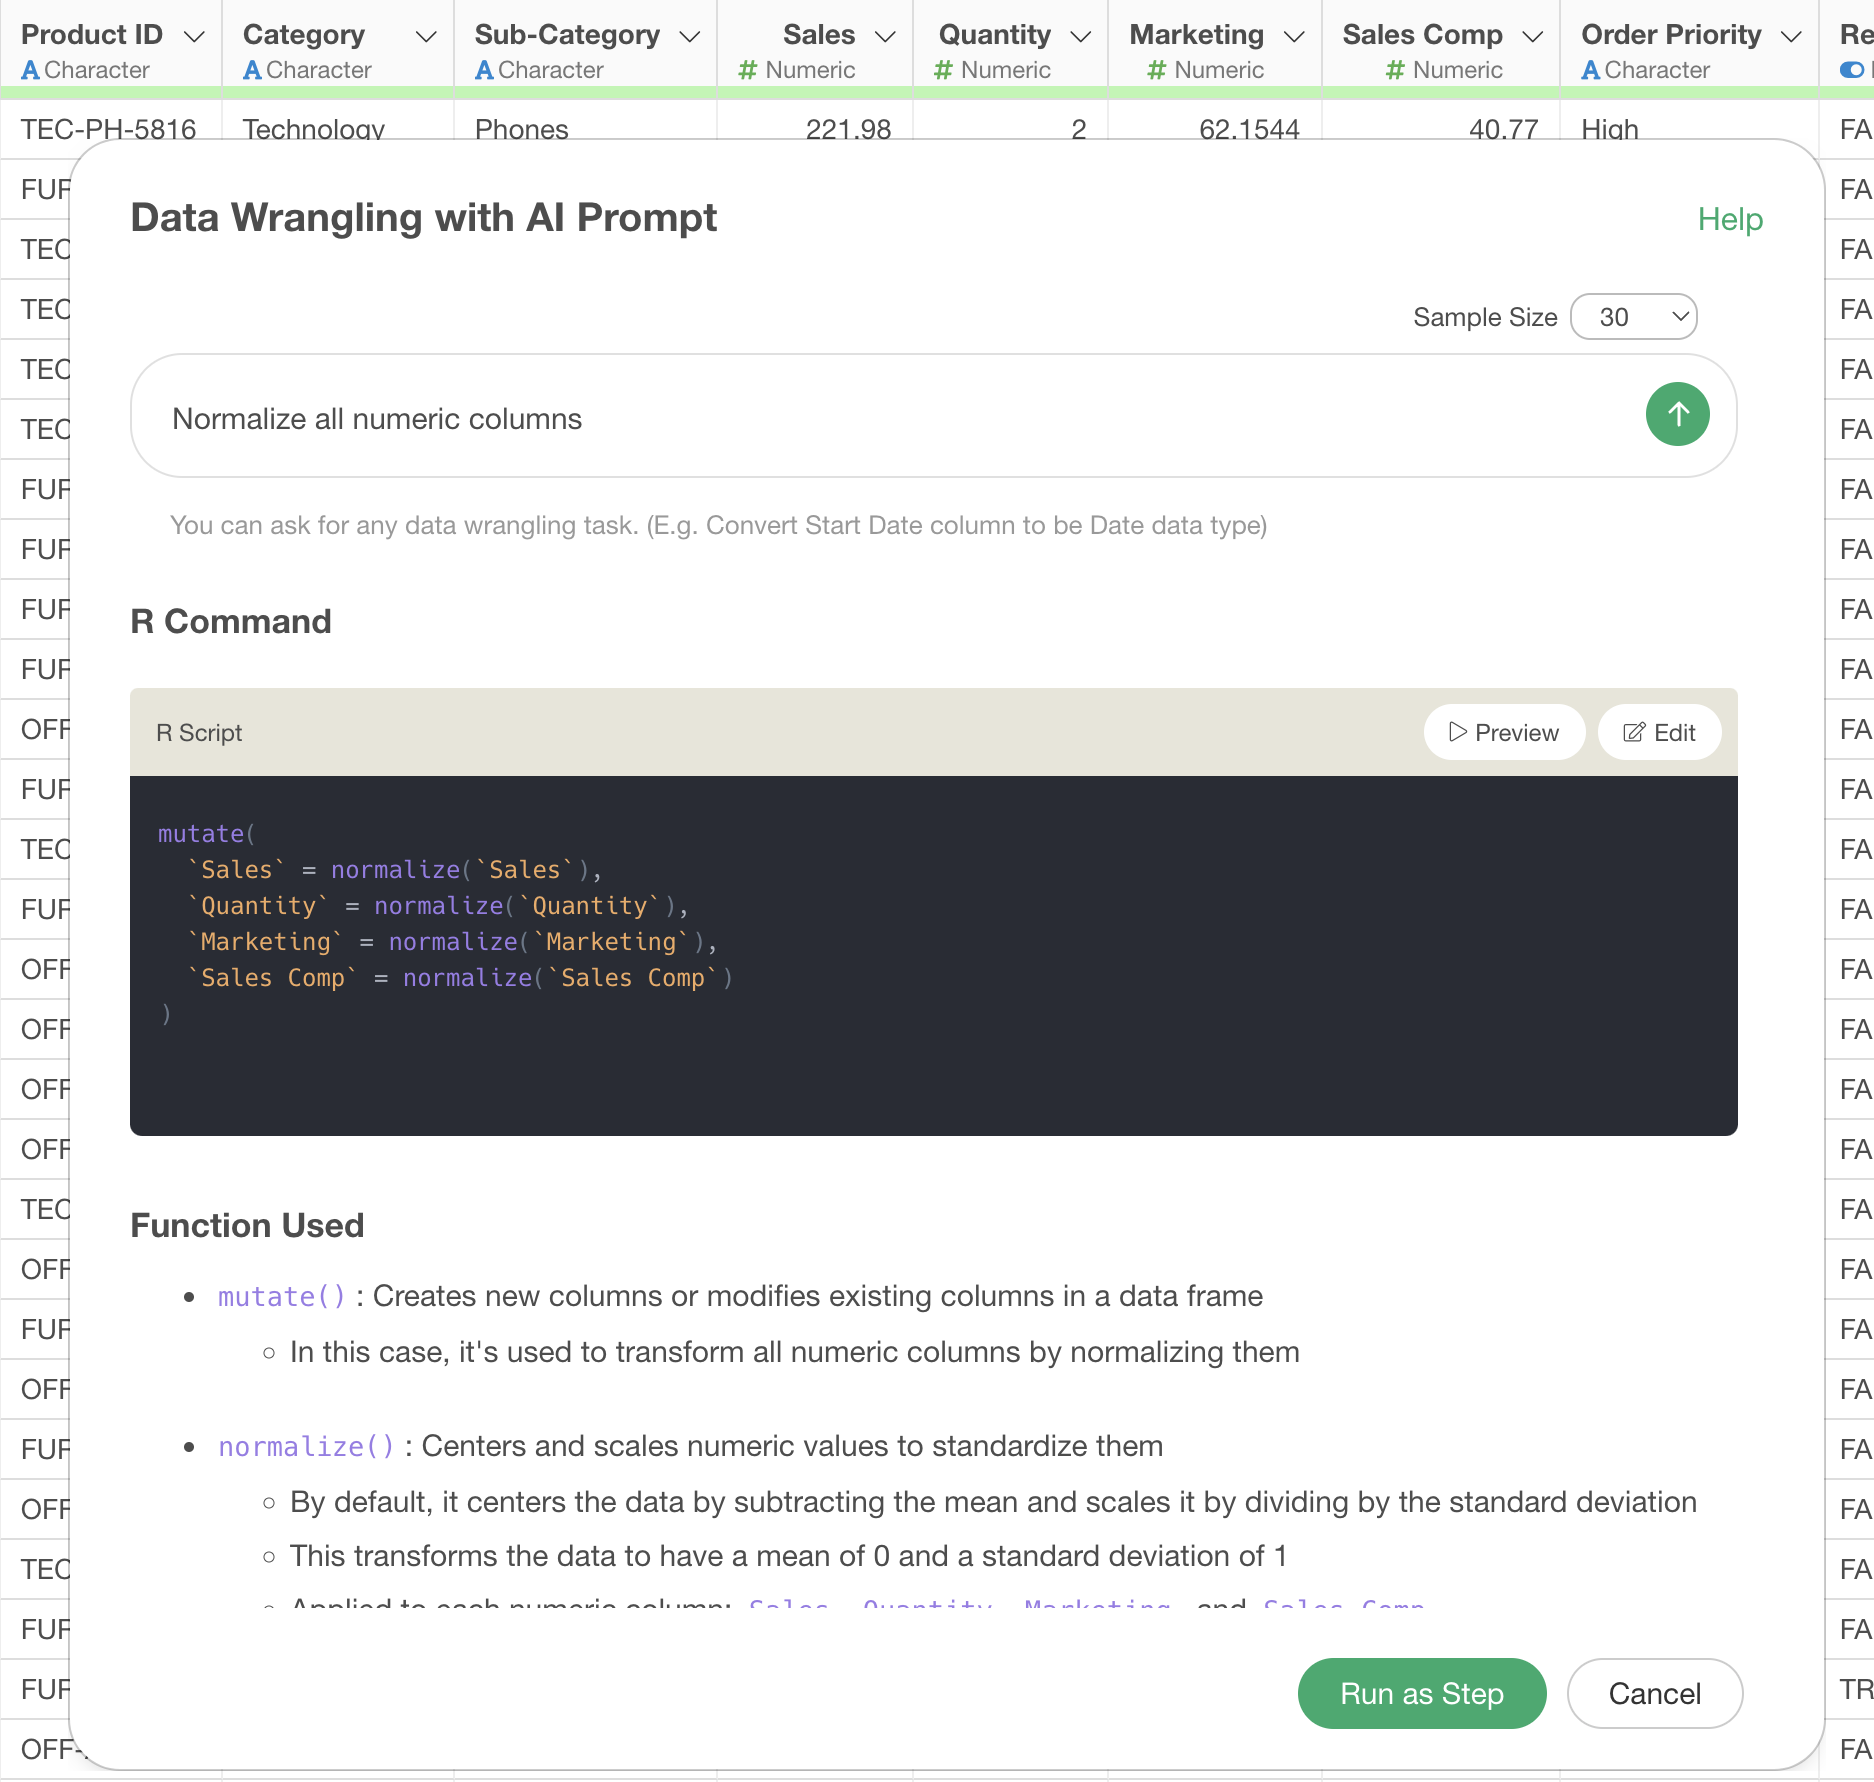
This code applies the normalize() function to each
numeric column, converting the data to normalized data with a mean of 0
and a standard deviation of 1. This allows you to compare numeric
columns with different scales on the same scale.
Click the “Run as Step” button to run the processing and see the results.
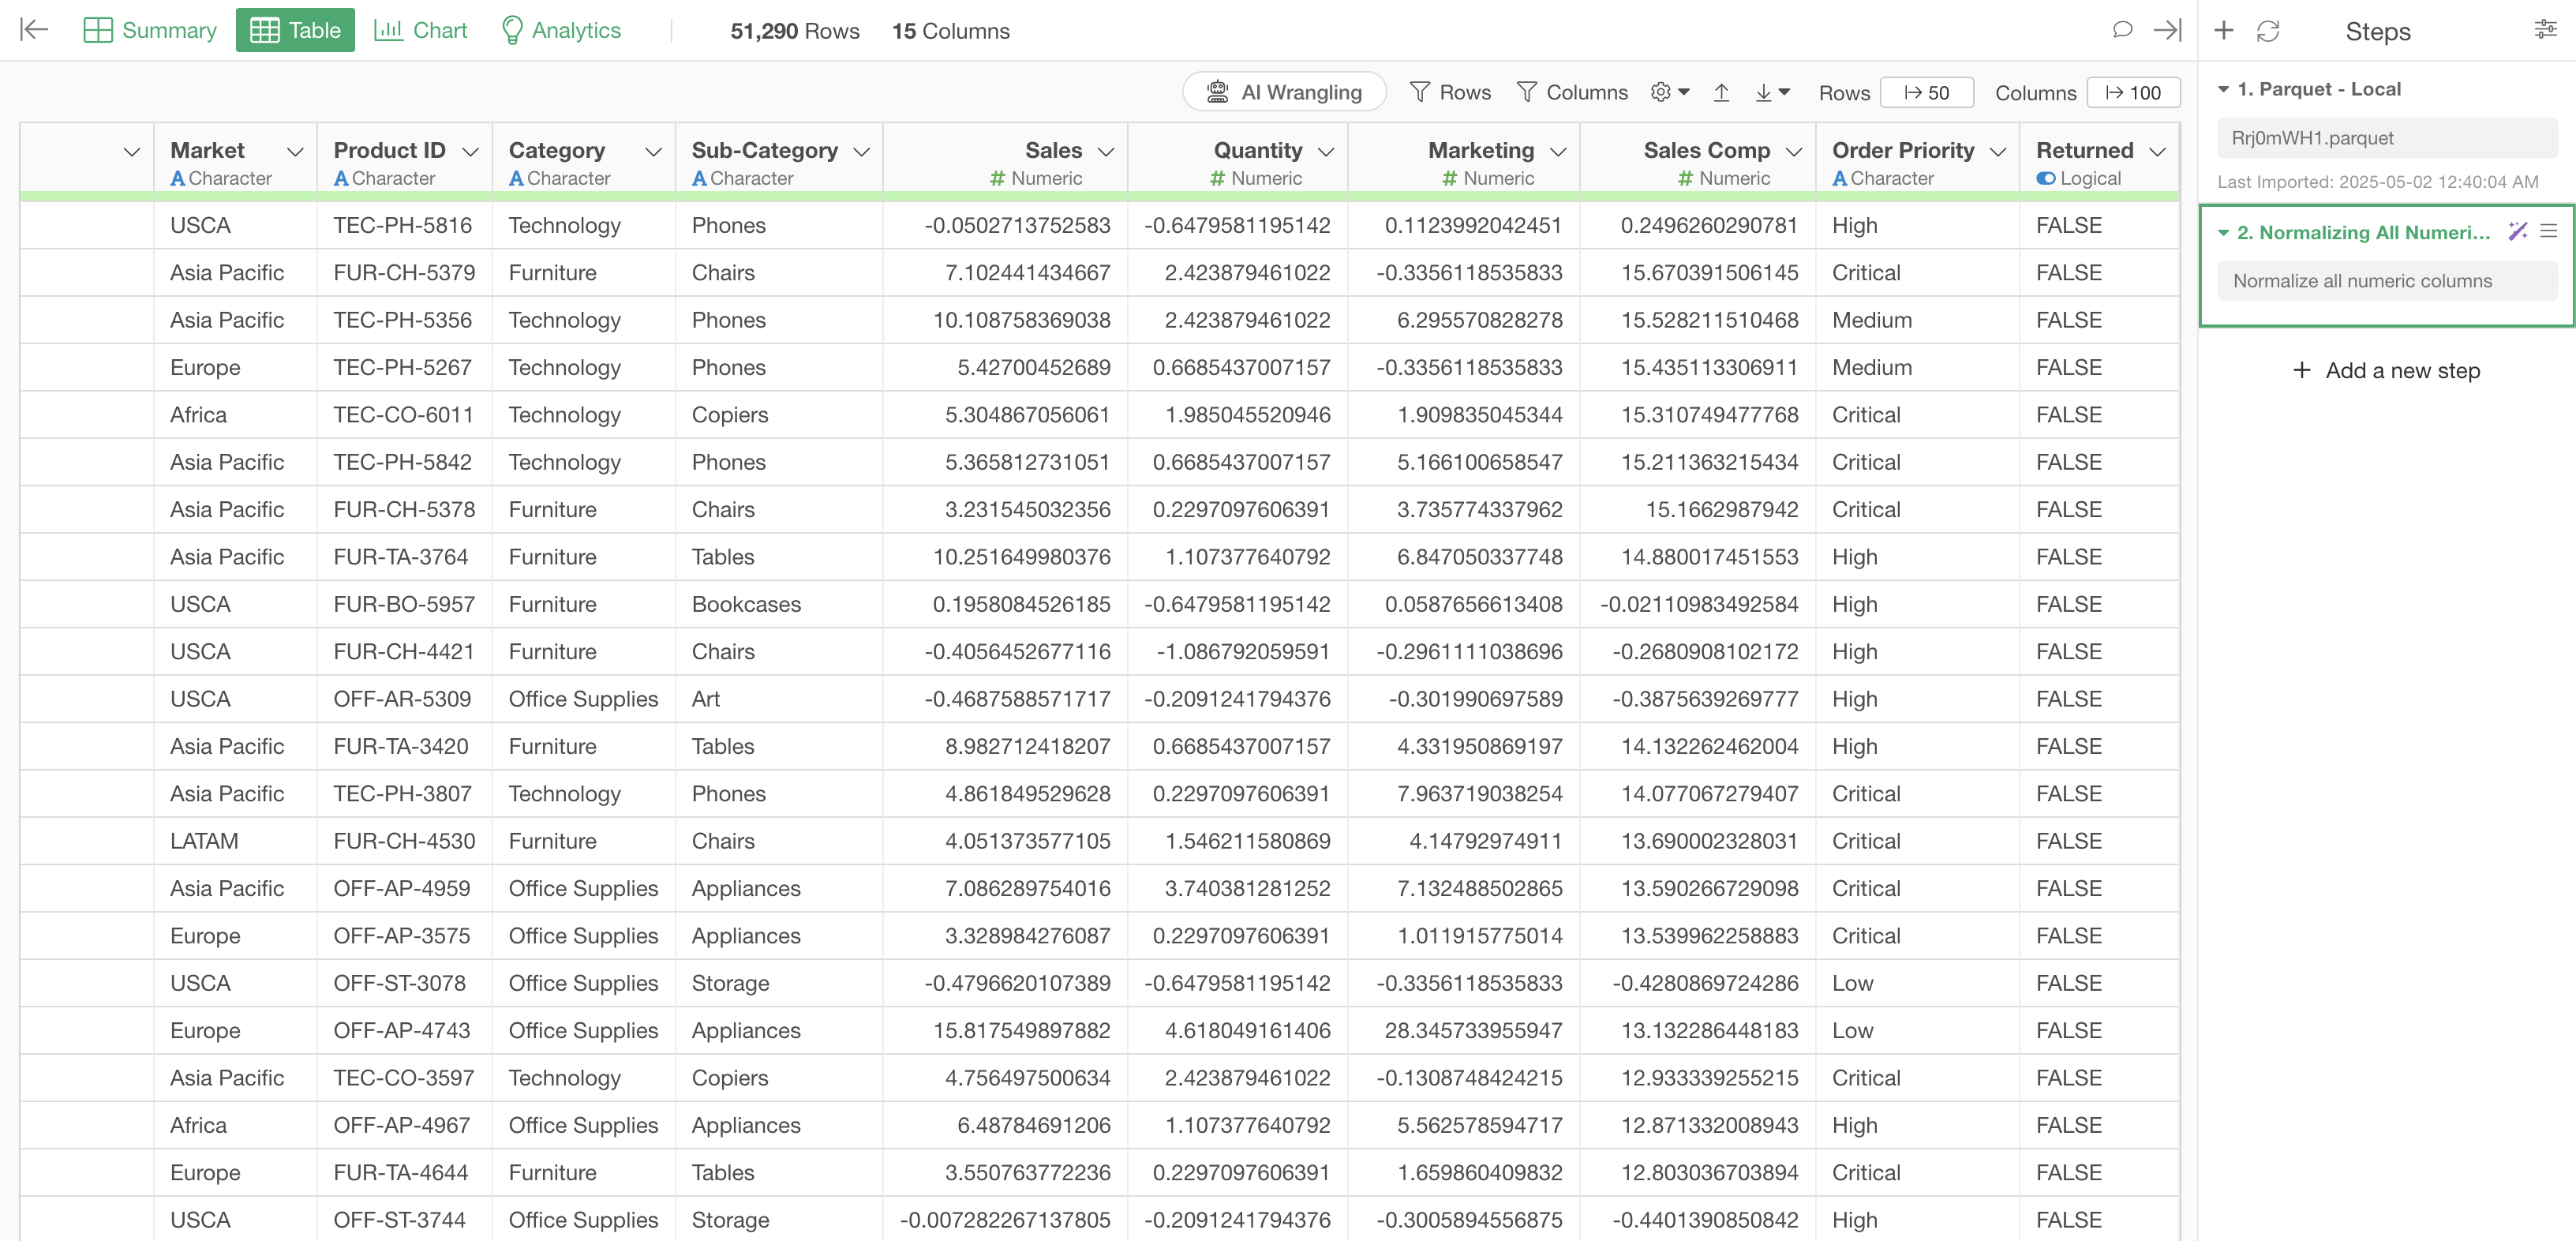
This normalizes all numeric columns, making it easier to compare variables.
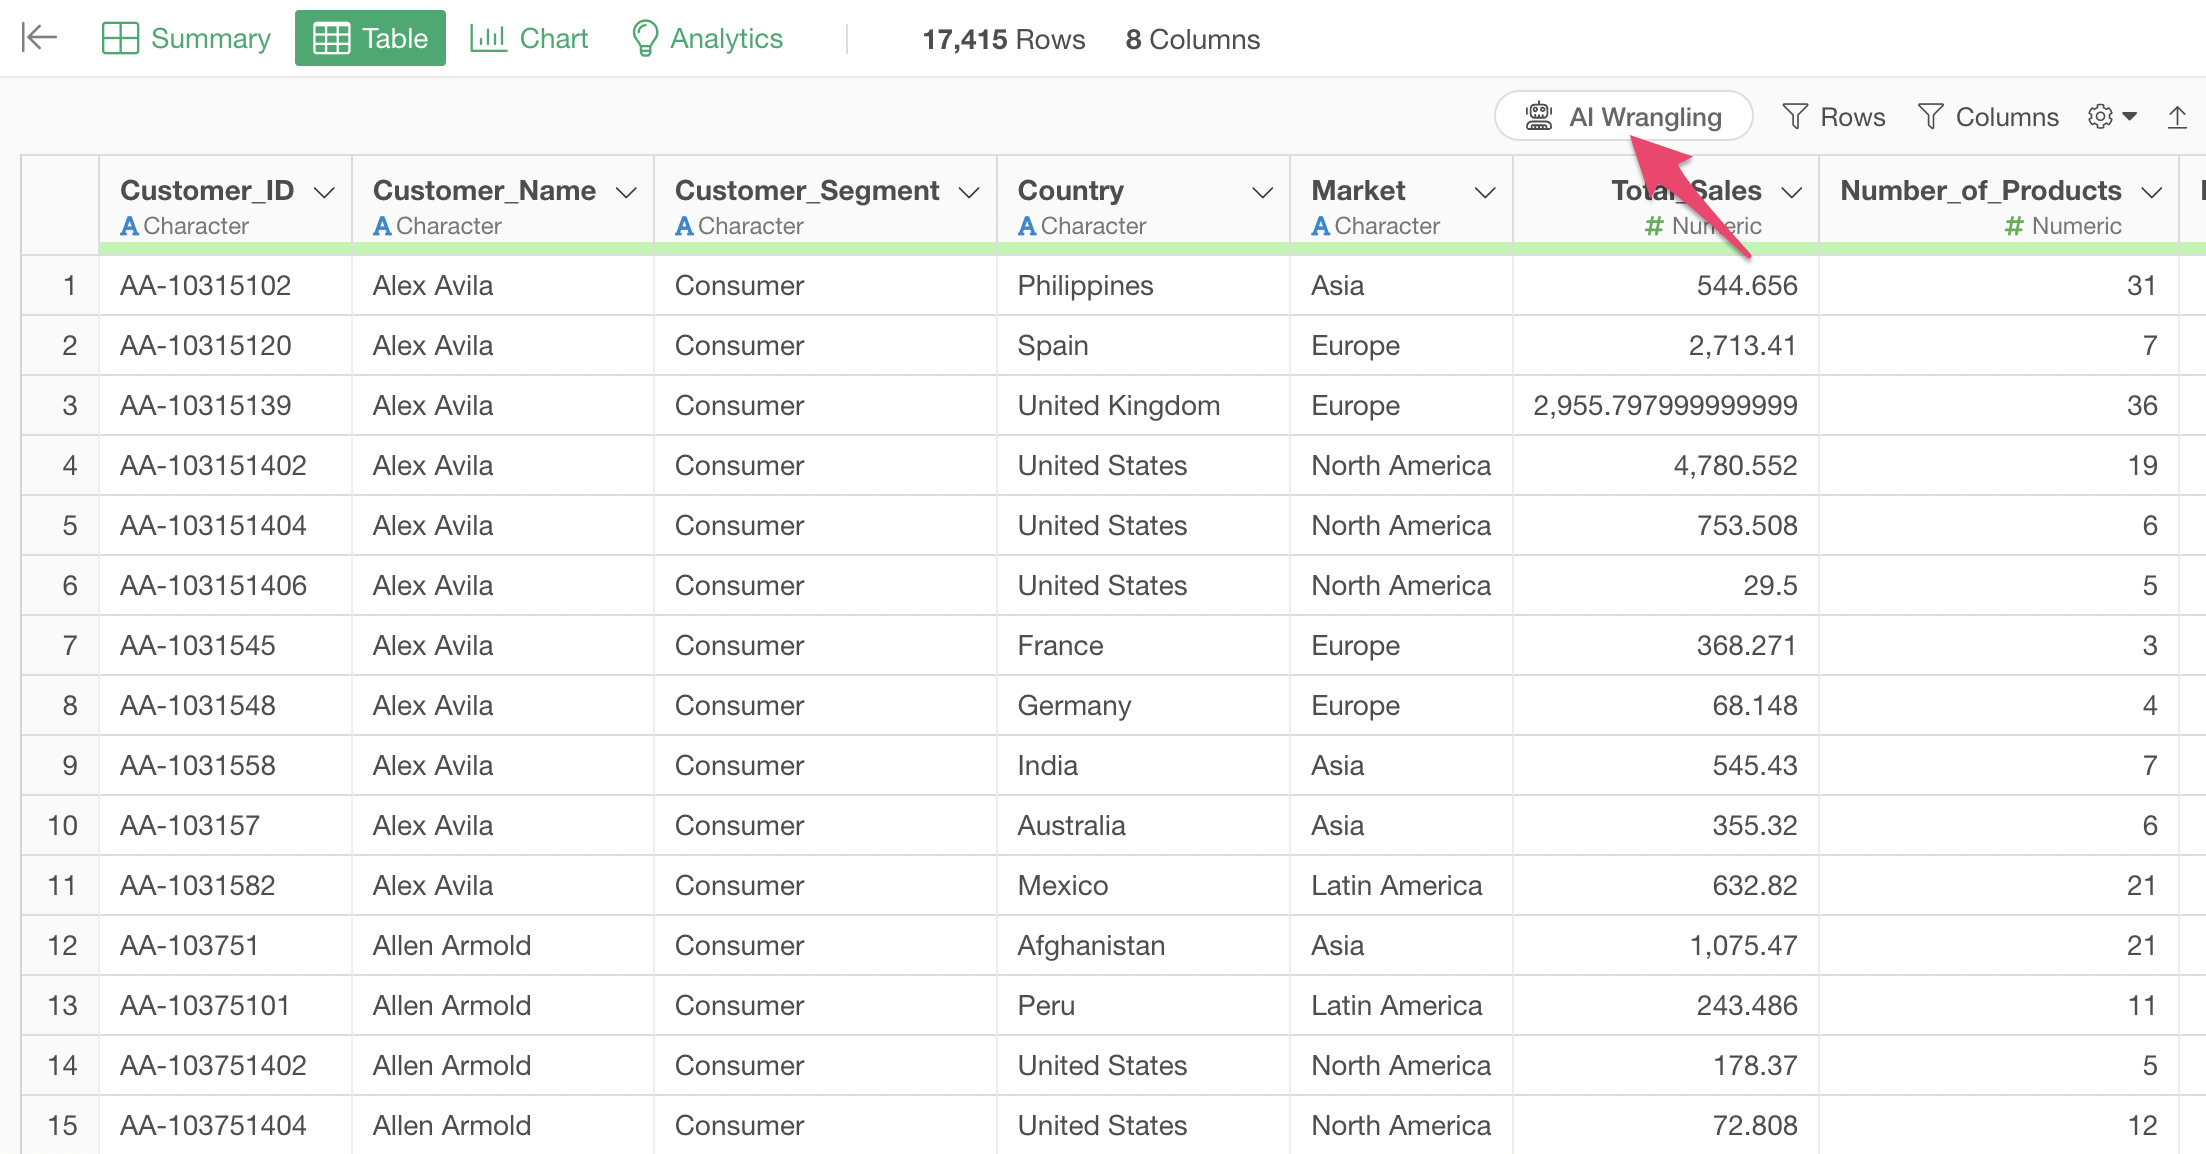
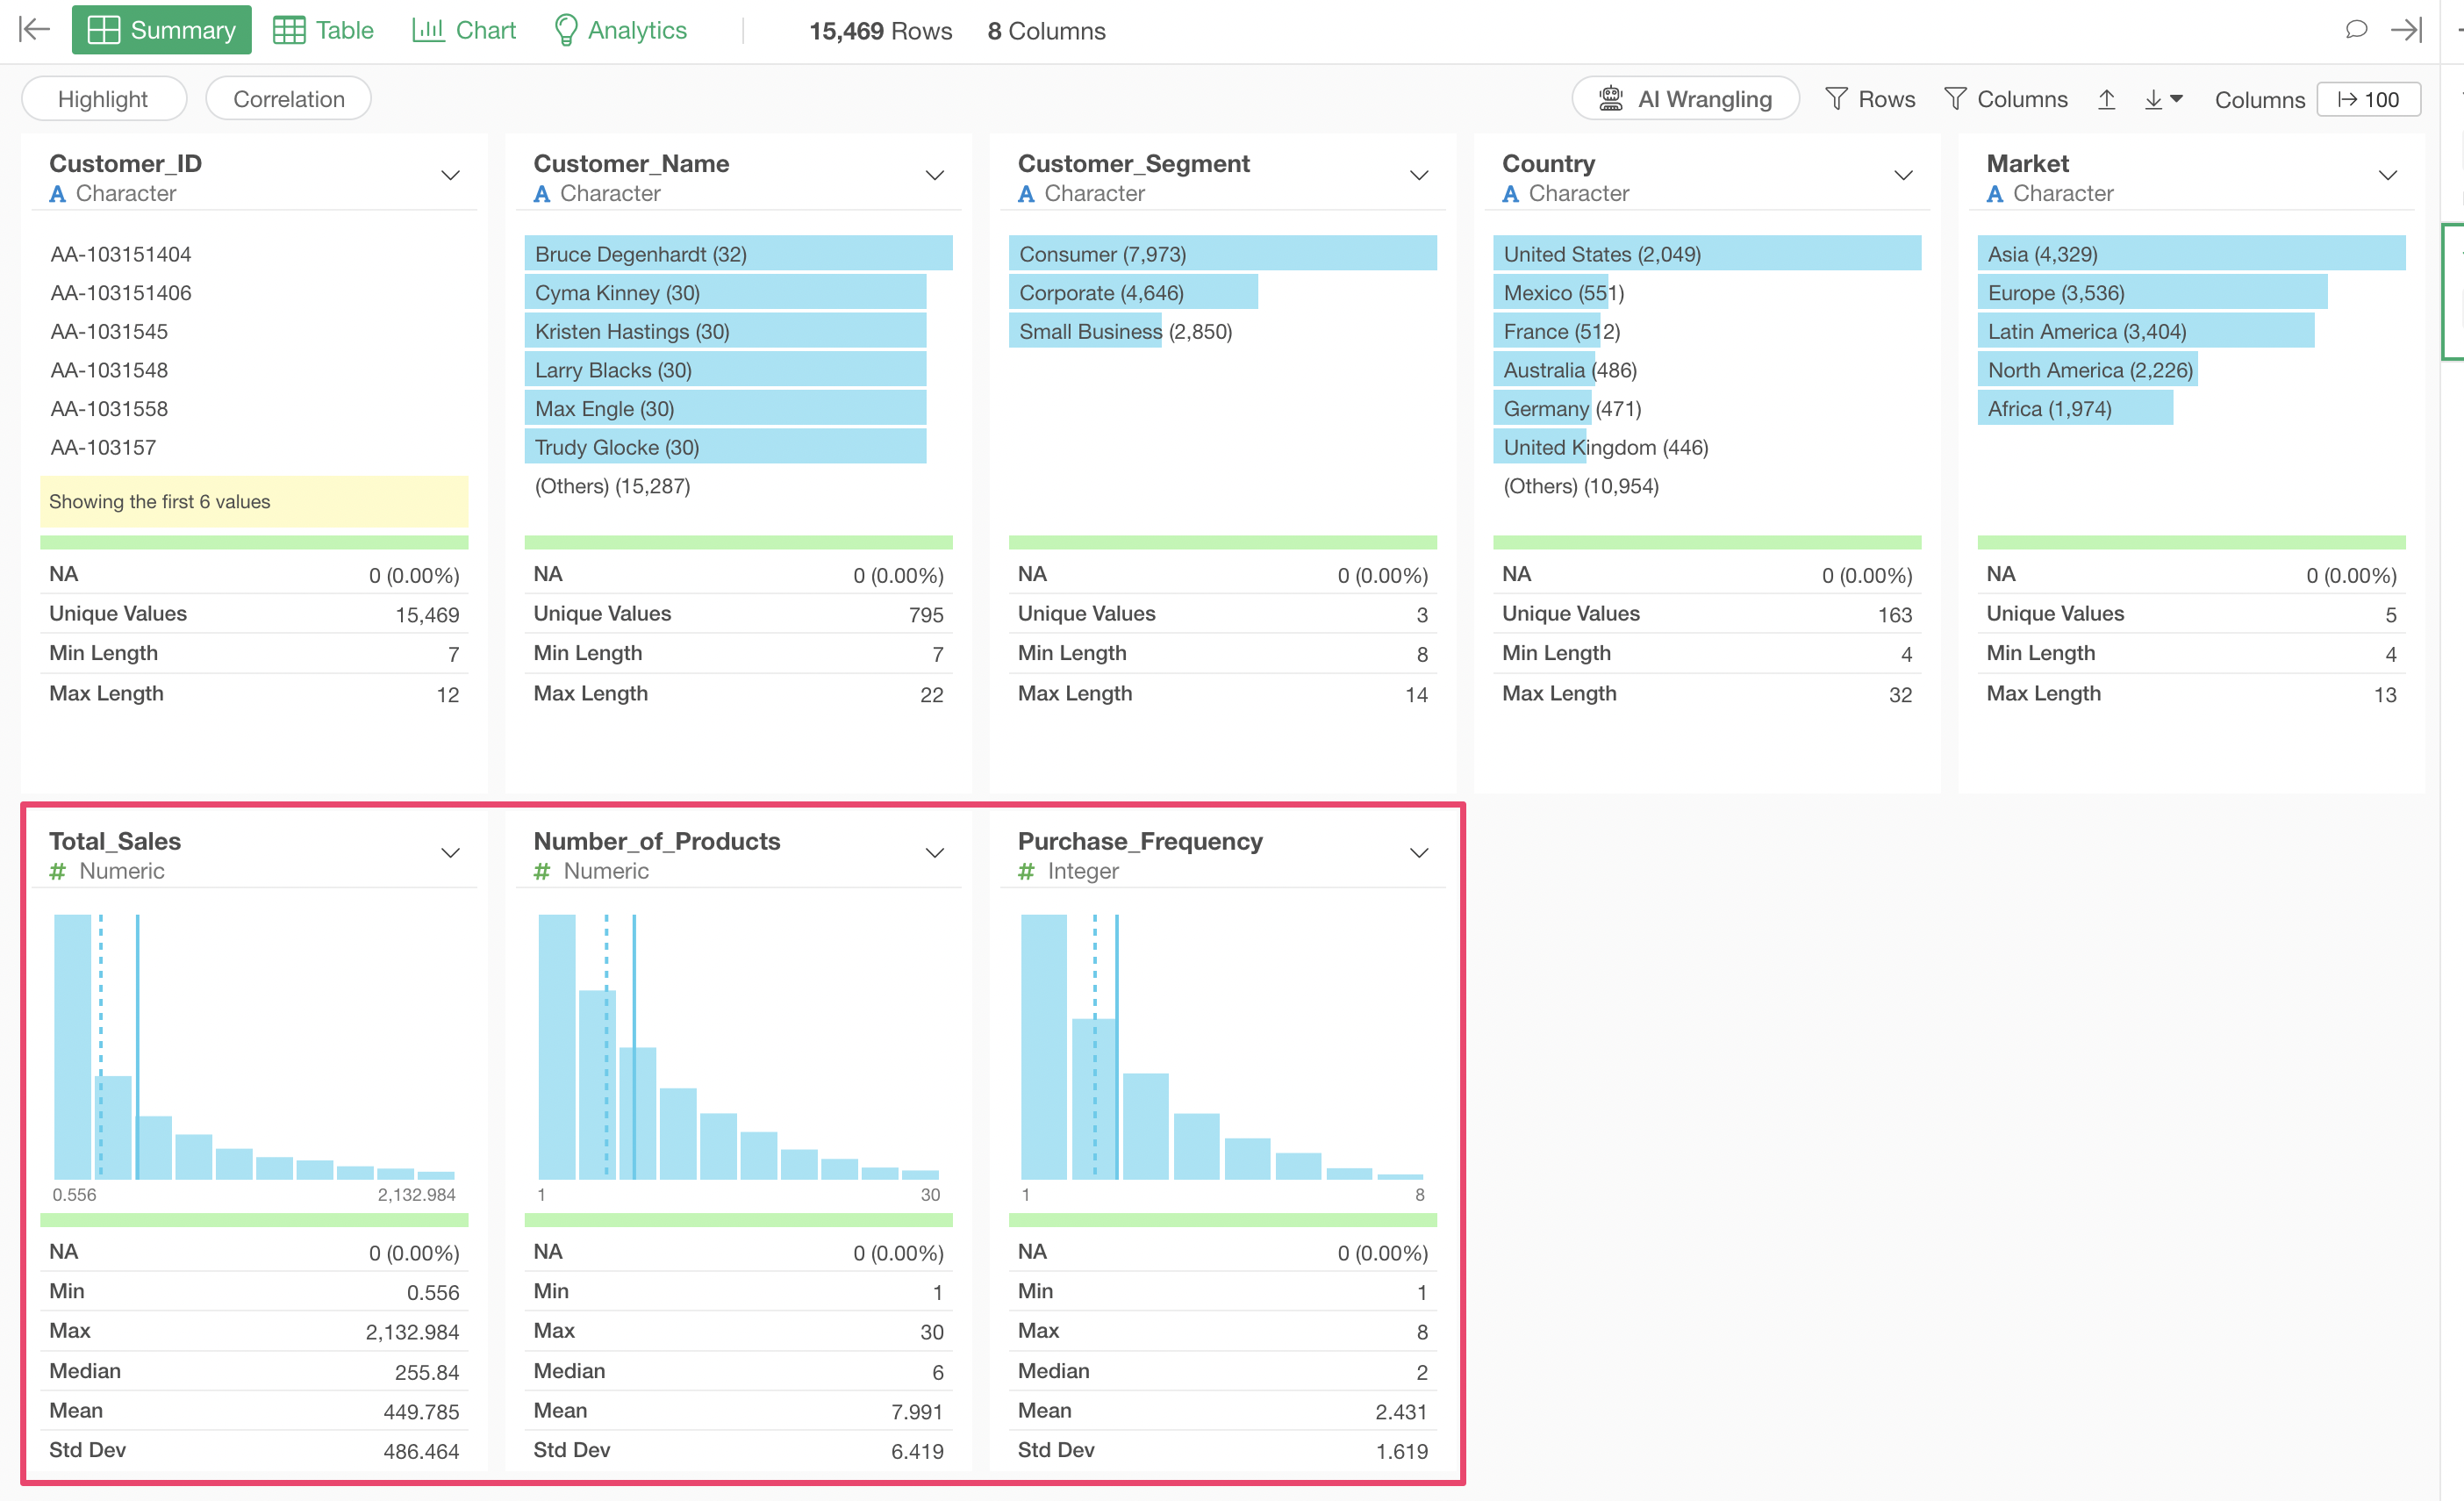
Remove Outliers from All Numeric Columns
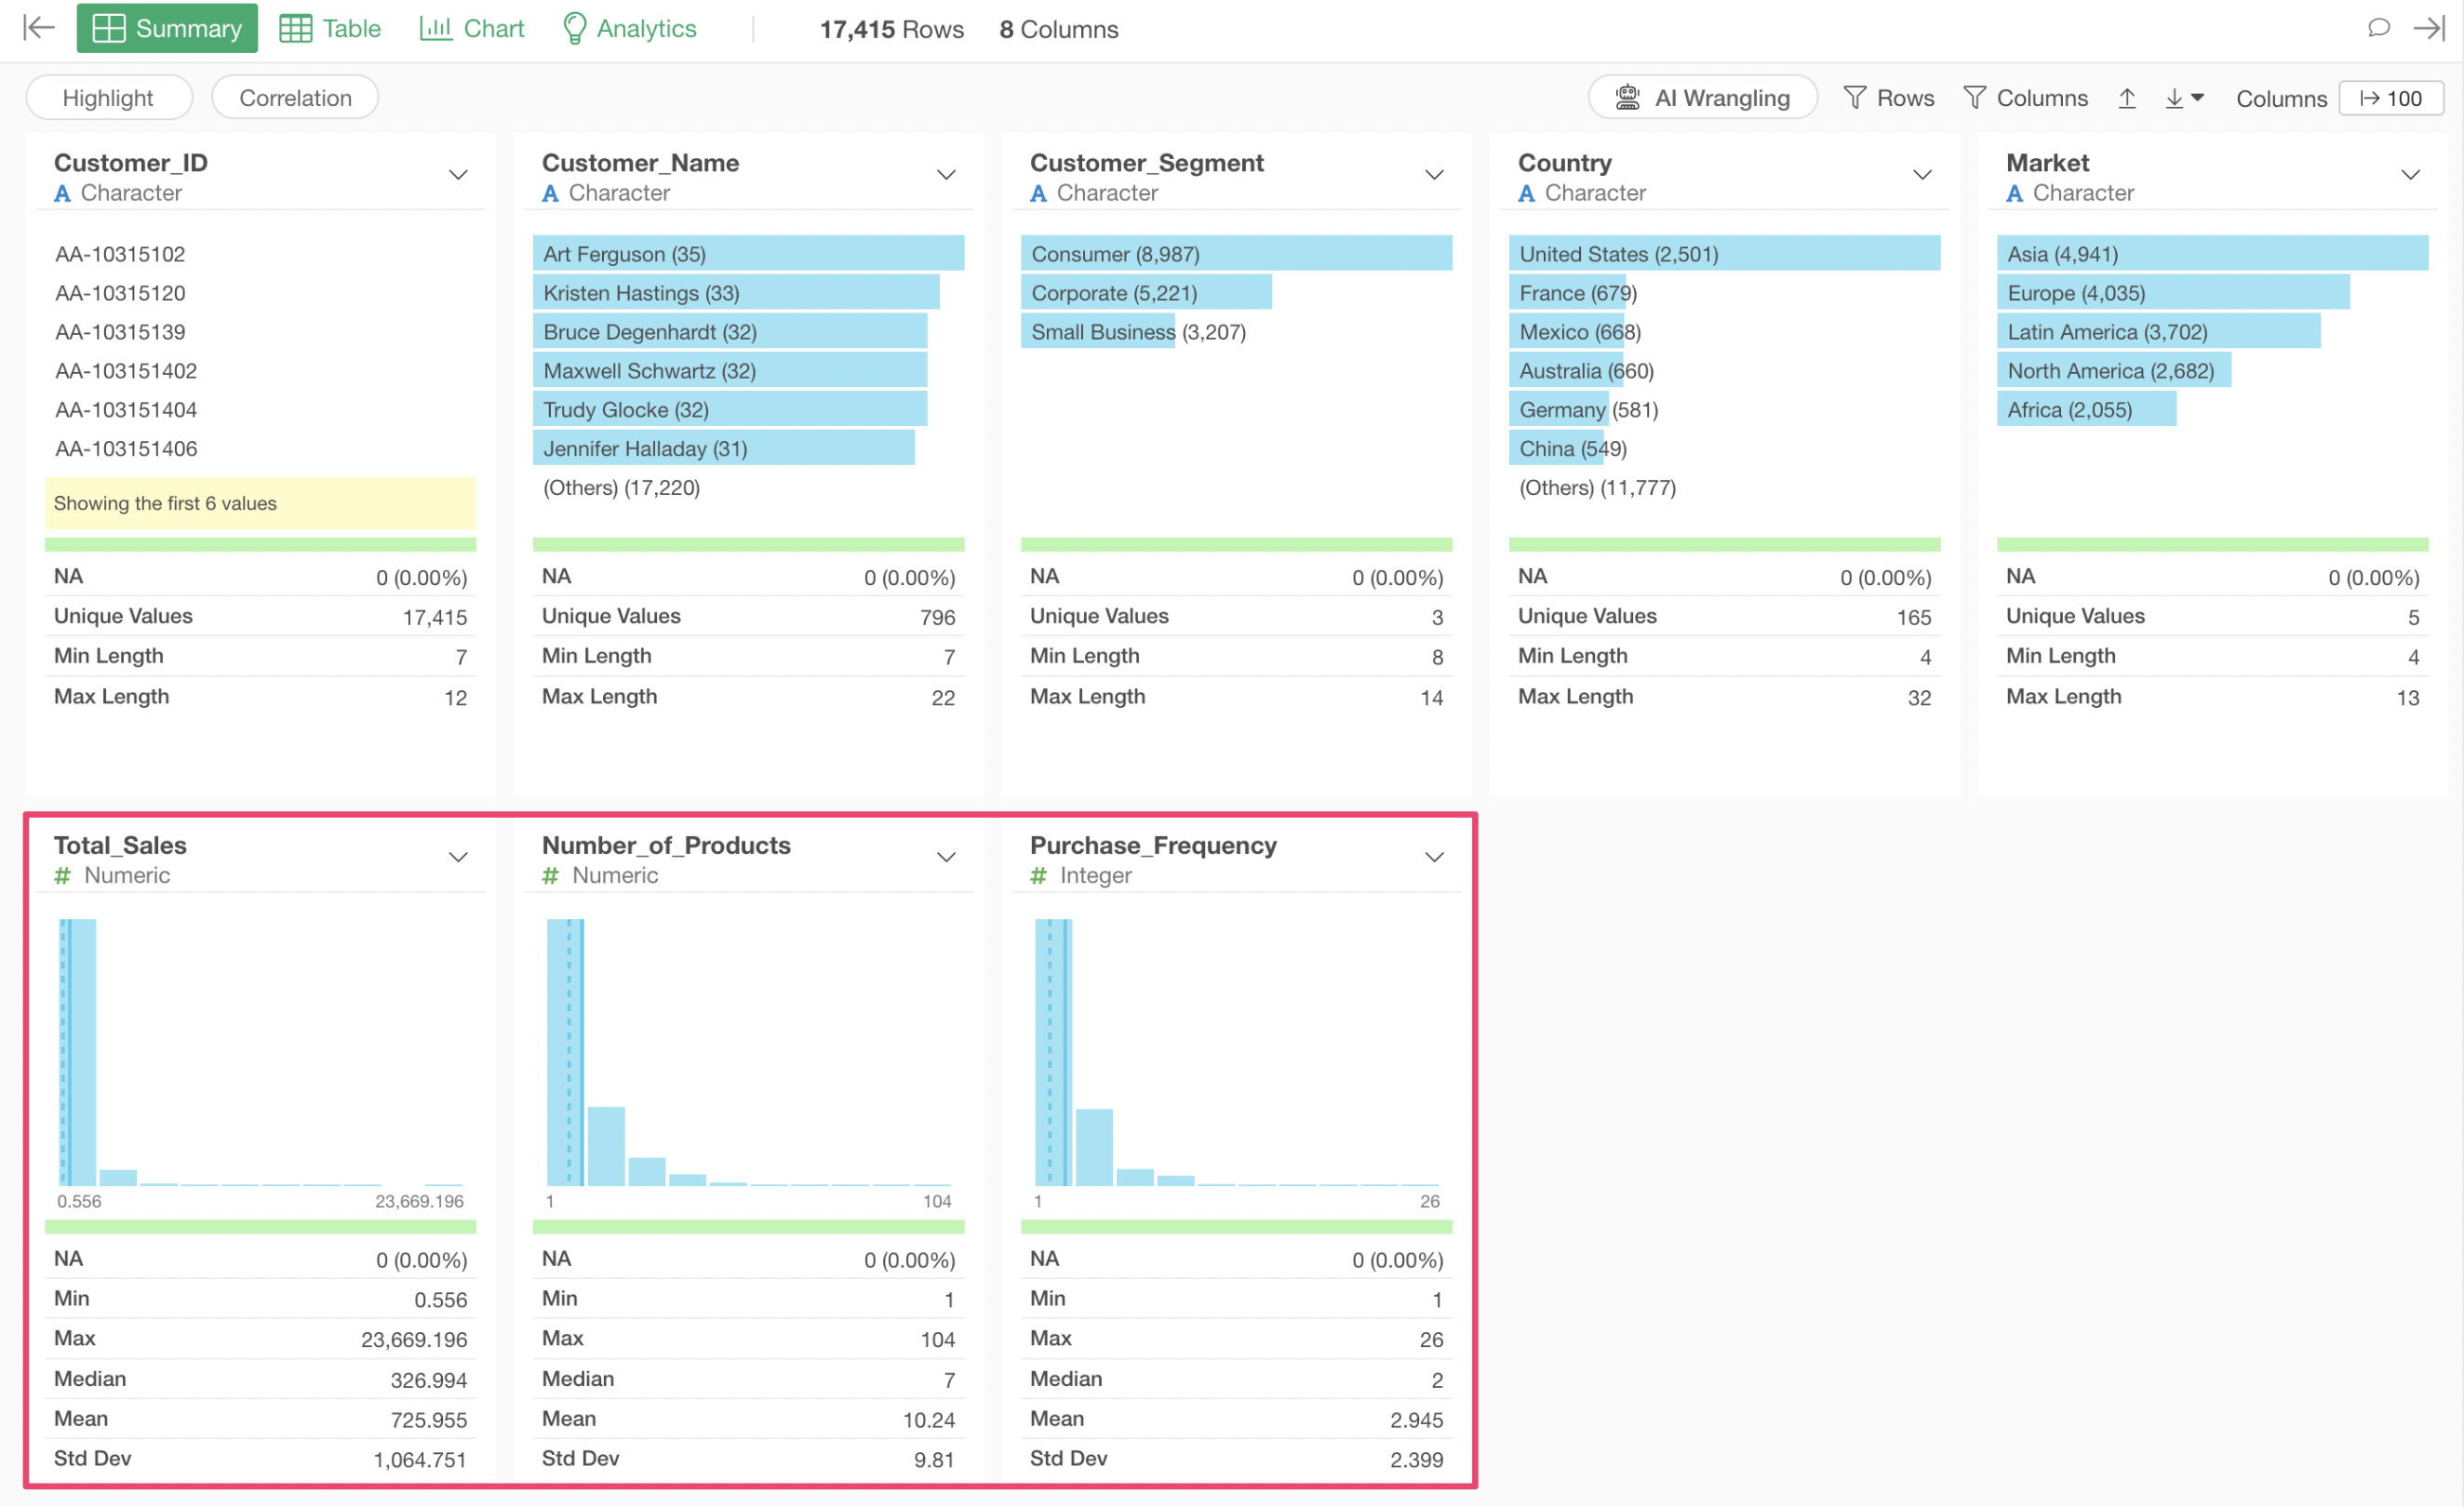
In this example, we’ll use “Sales Data by Customer.”
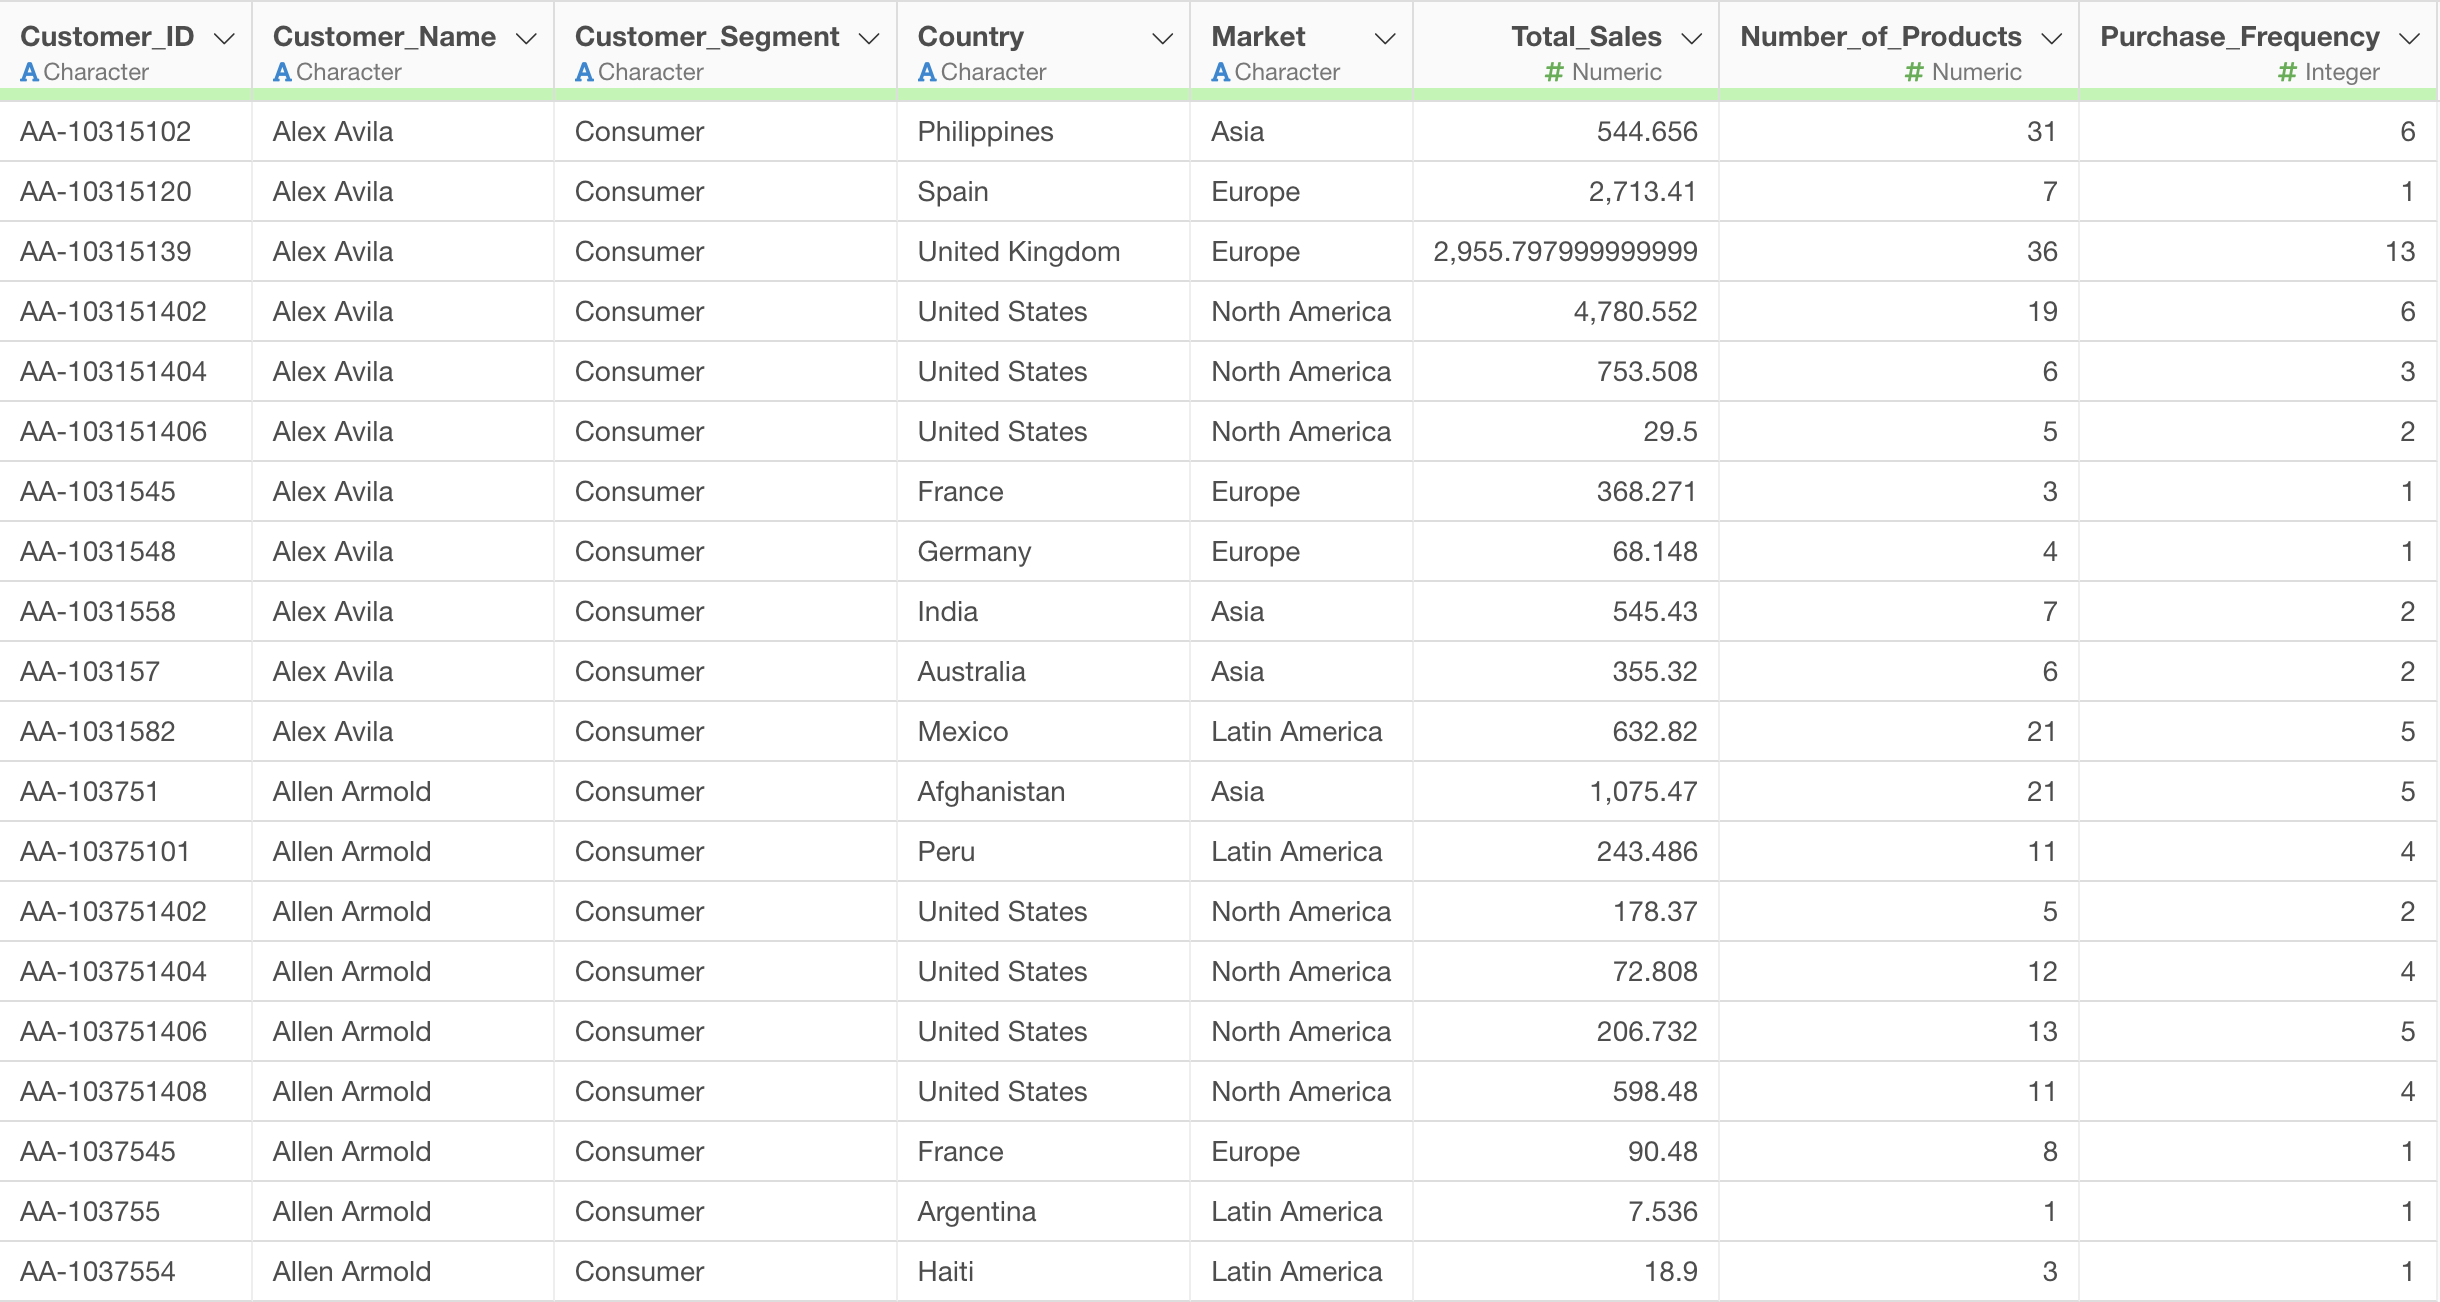
This data contains extreme outliers in fields such as Total Sales and Number of Products. We want to detect and remove these outliers using the IQR (Interquartile Range) method.
Click the “AI Wrangling” button from the table view to open the AI Prompt feature.
Enter the following prompt in the prompt input field:
Remove outliers from all numeric columns using IQR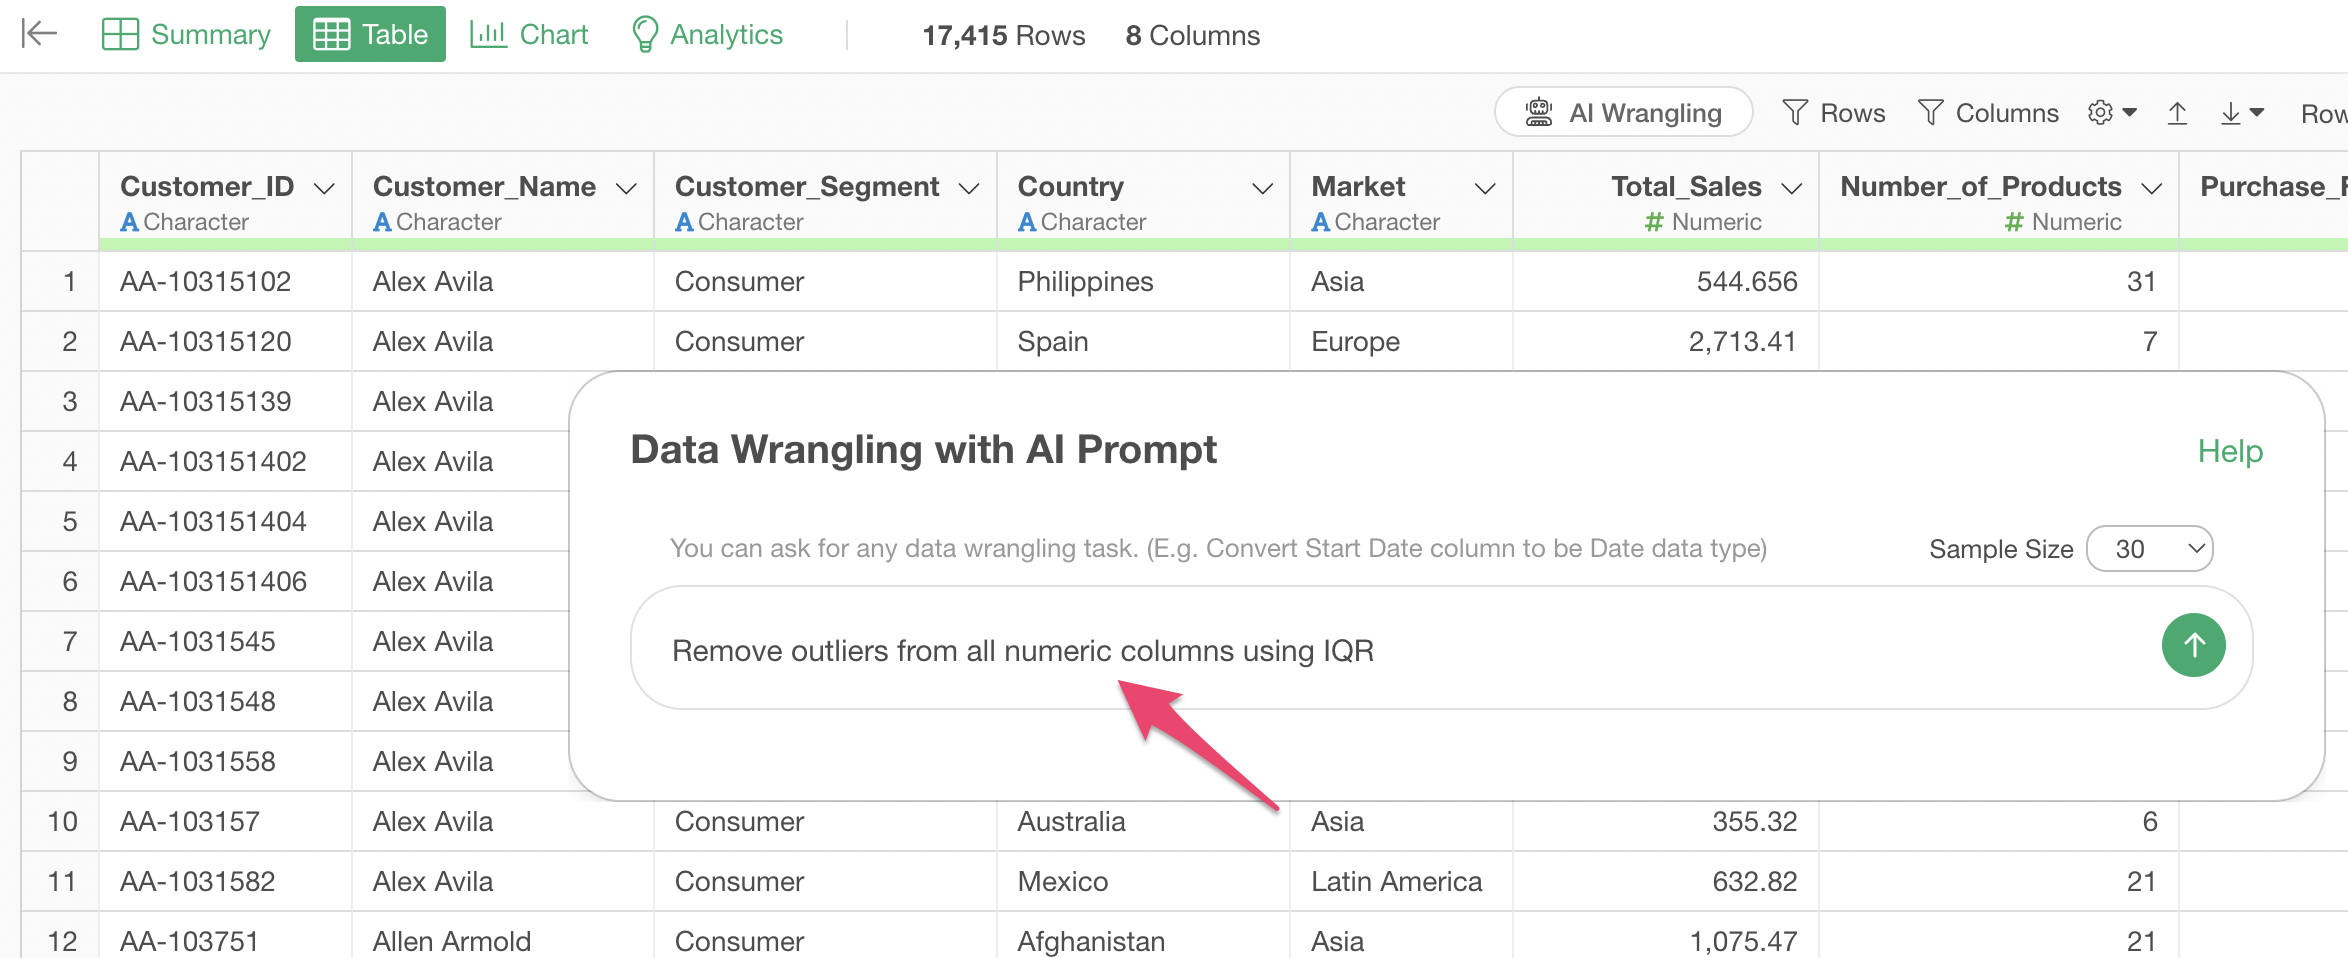
When you execute the prompt, AI automatically generates the following R script:
mutate(
  `Total_Sales_outlier` = detect_outlier(`Total_Sales`, type = "iqr"),
  `Number_of_Products_outlier` = detect_outlier(`Number_of_Products`, type = "iqr"),
  `Purchase_Frequency_outlier` = detect_outlier(`Purchase_Frequency`, type = "iqr")
) %>%
filter(
  `Total_Sales_outlier` == "Normal",
  `Number_of_Products_outlier` == "Normal",
  `Purchase_Frequency_outlier` == "Normal"
) %>%
select(-ends_with("_outlier"))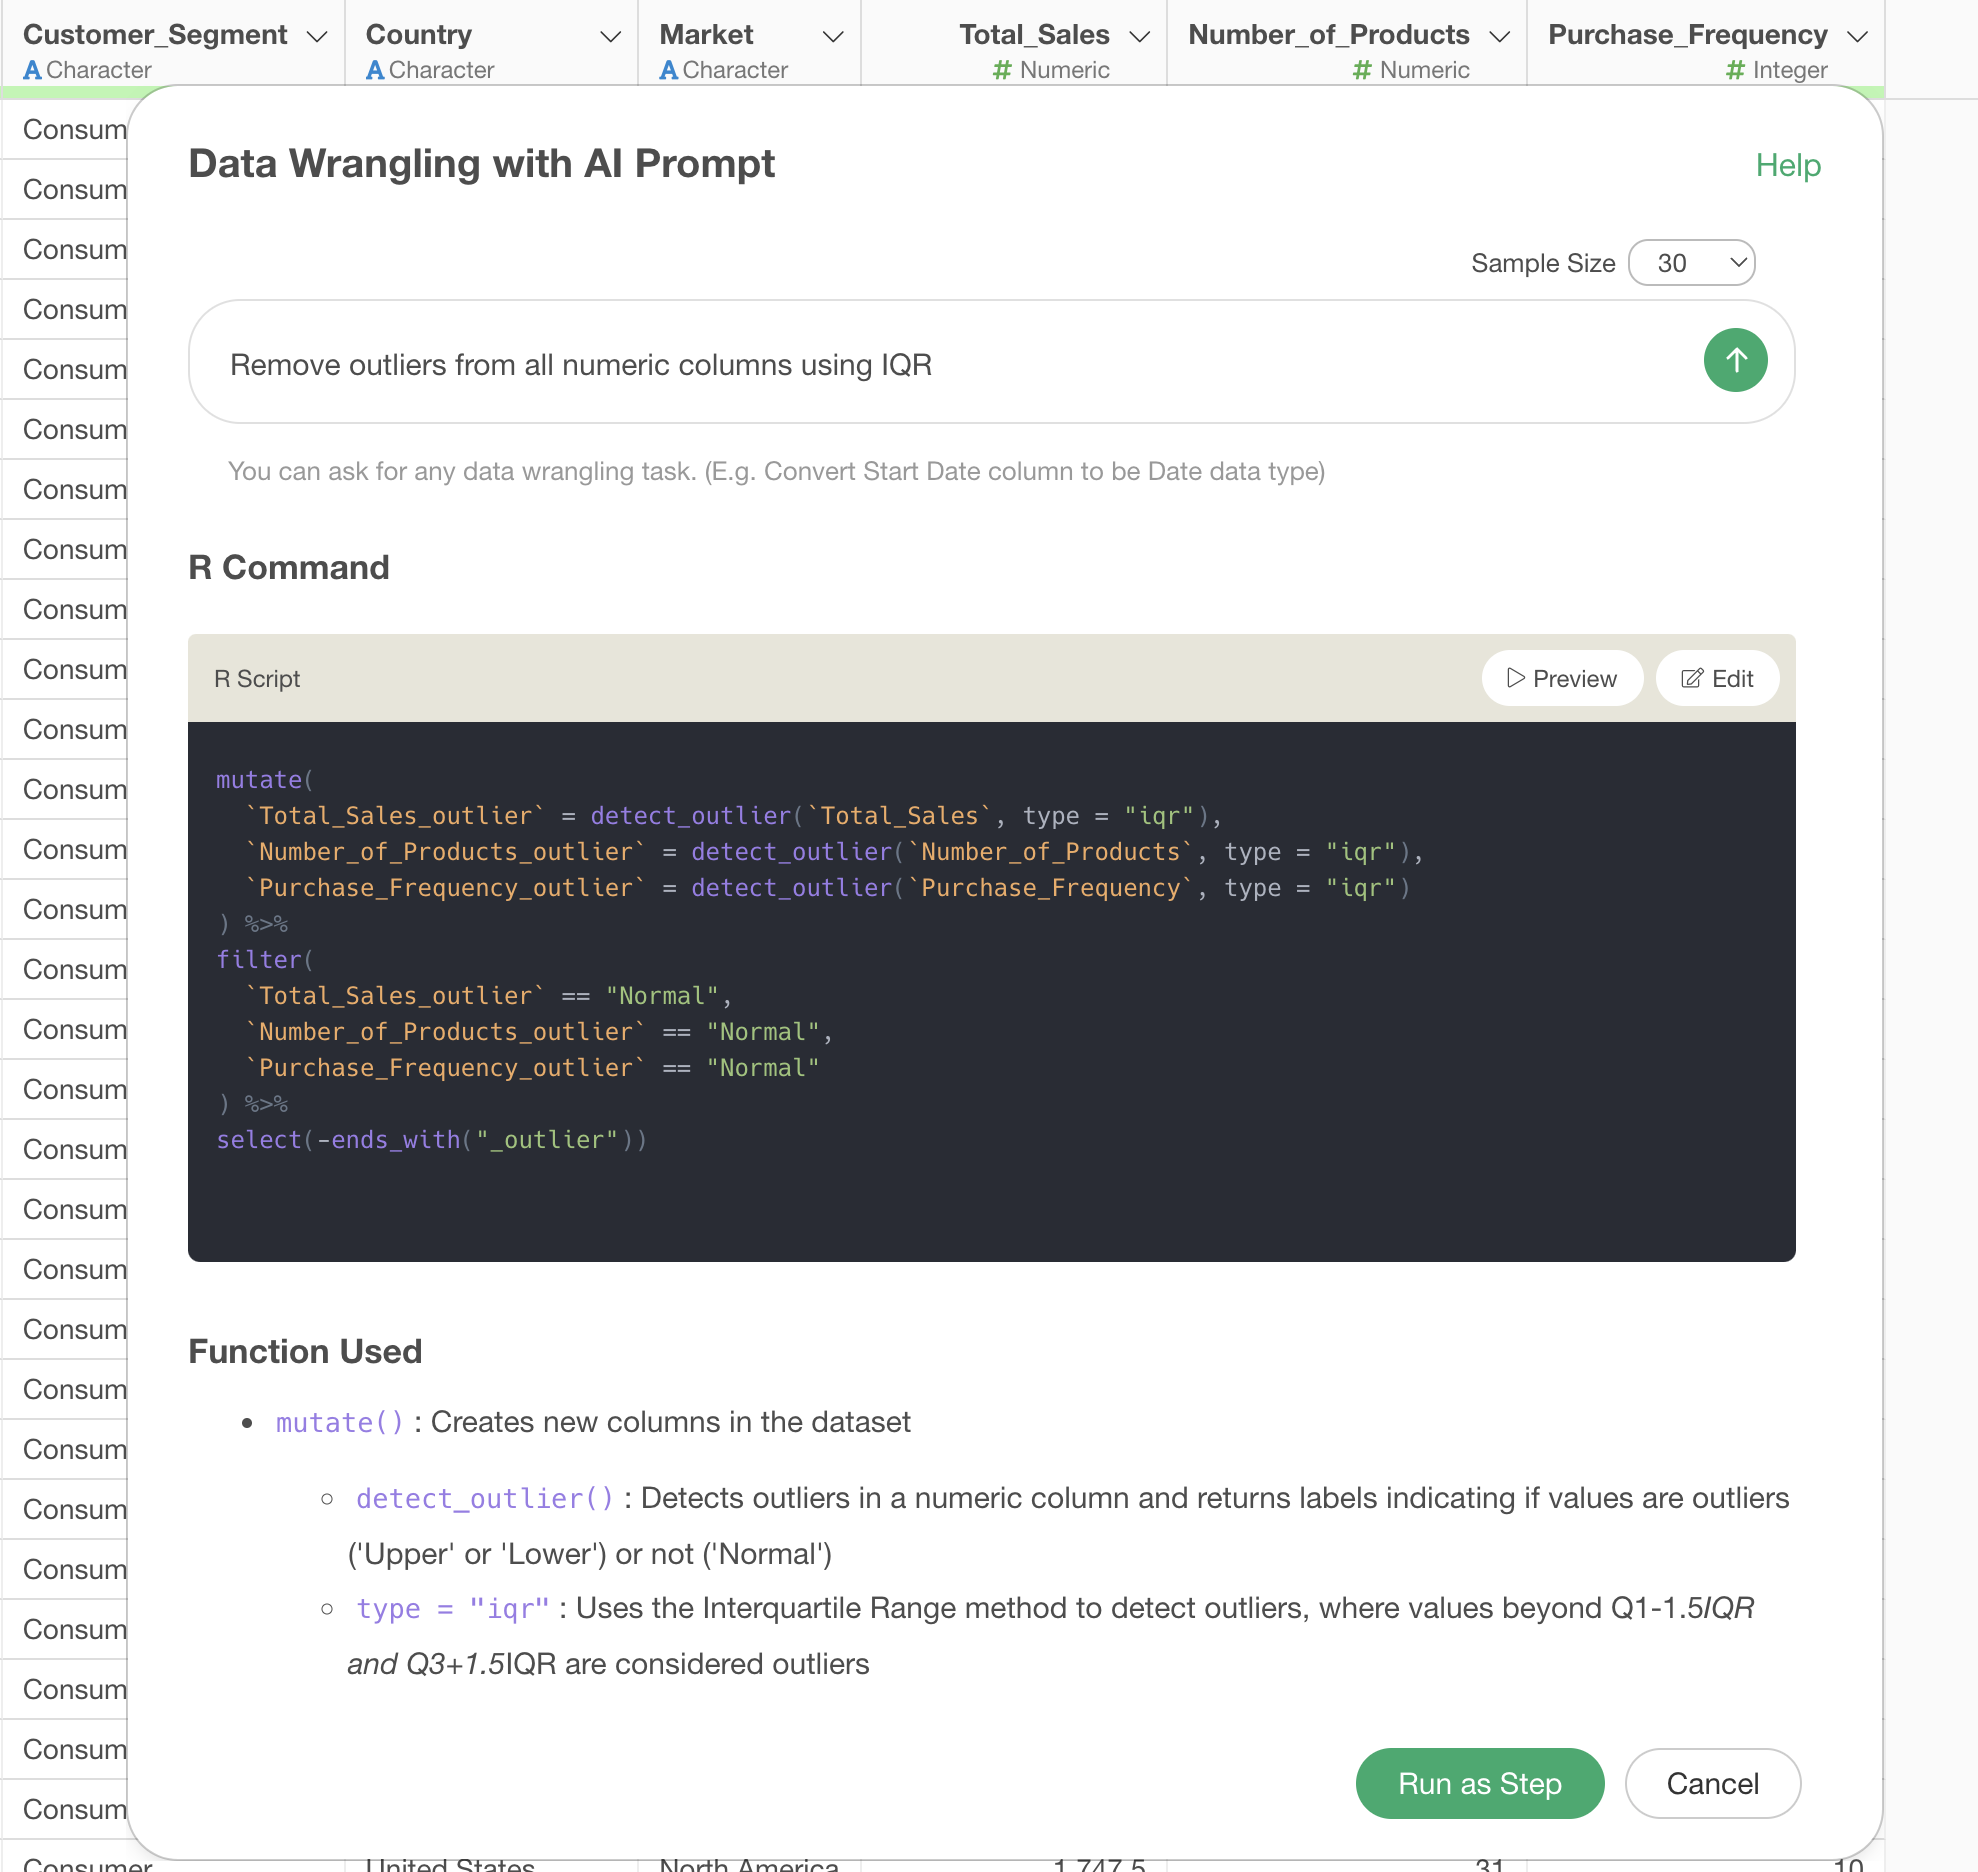
This code first uses the detect_outlier function with
the IQR method to detect outliers in all numeric columns. Outliers are
flagged as “Lower” or “Upper,” while non-outliers are flagged as
“Normal.”
Therefore, it filters to keep only the “Normal” values.
Click the “Run as Step” button to run the processing and see the results.
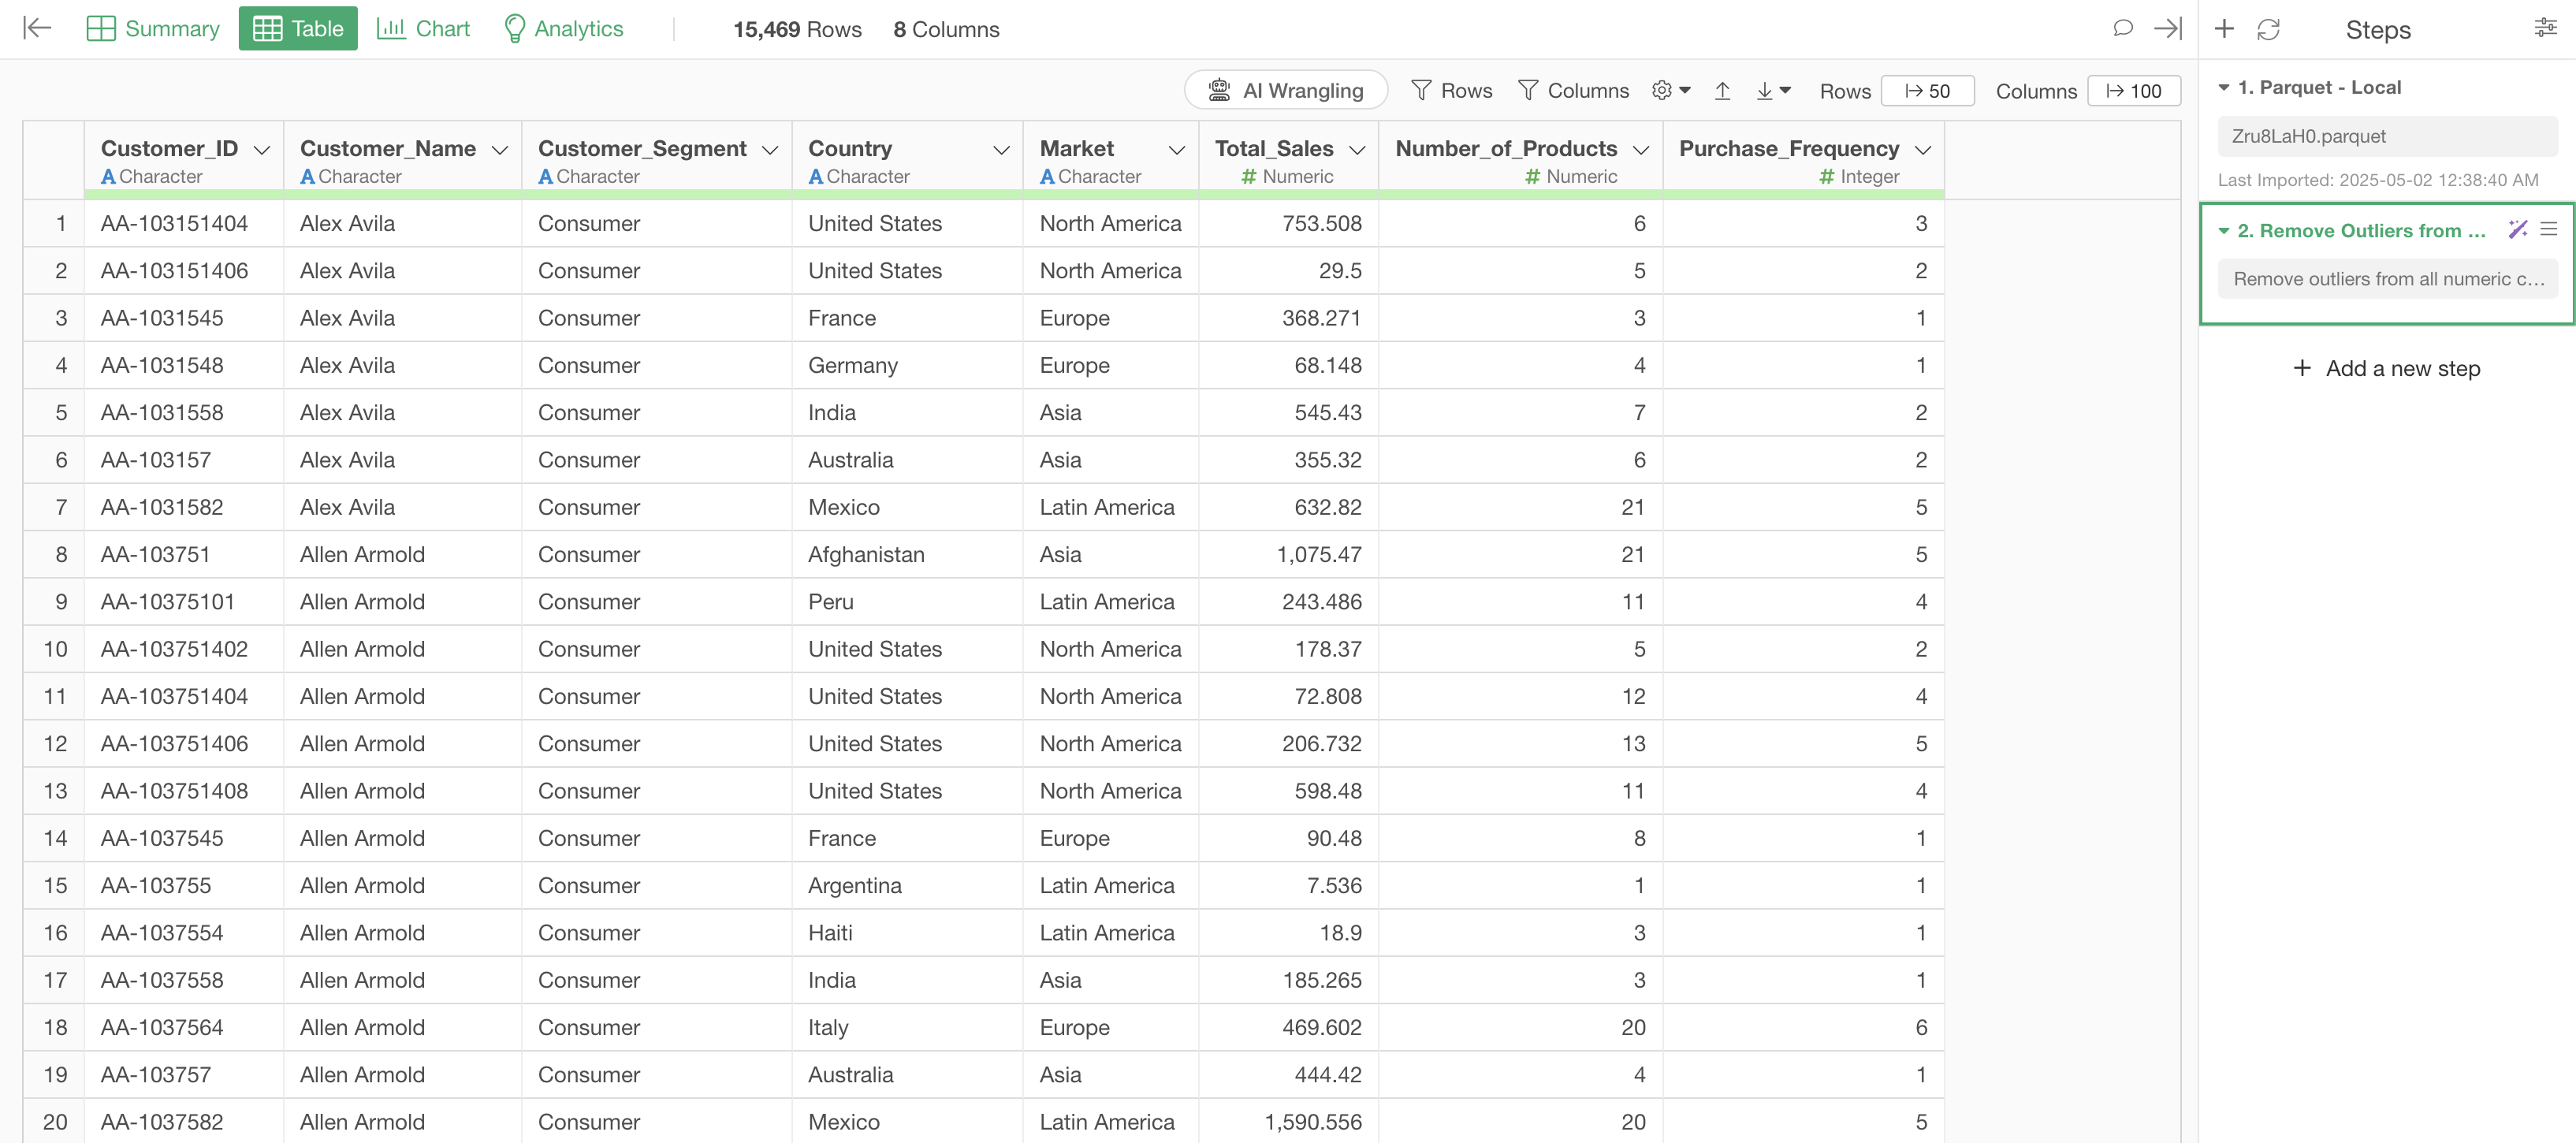
With this, we have successfully removed outliers from all numeric columns using the IQR (Interquartile Range) method.
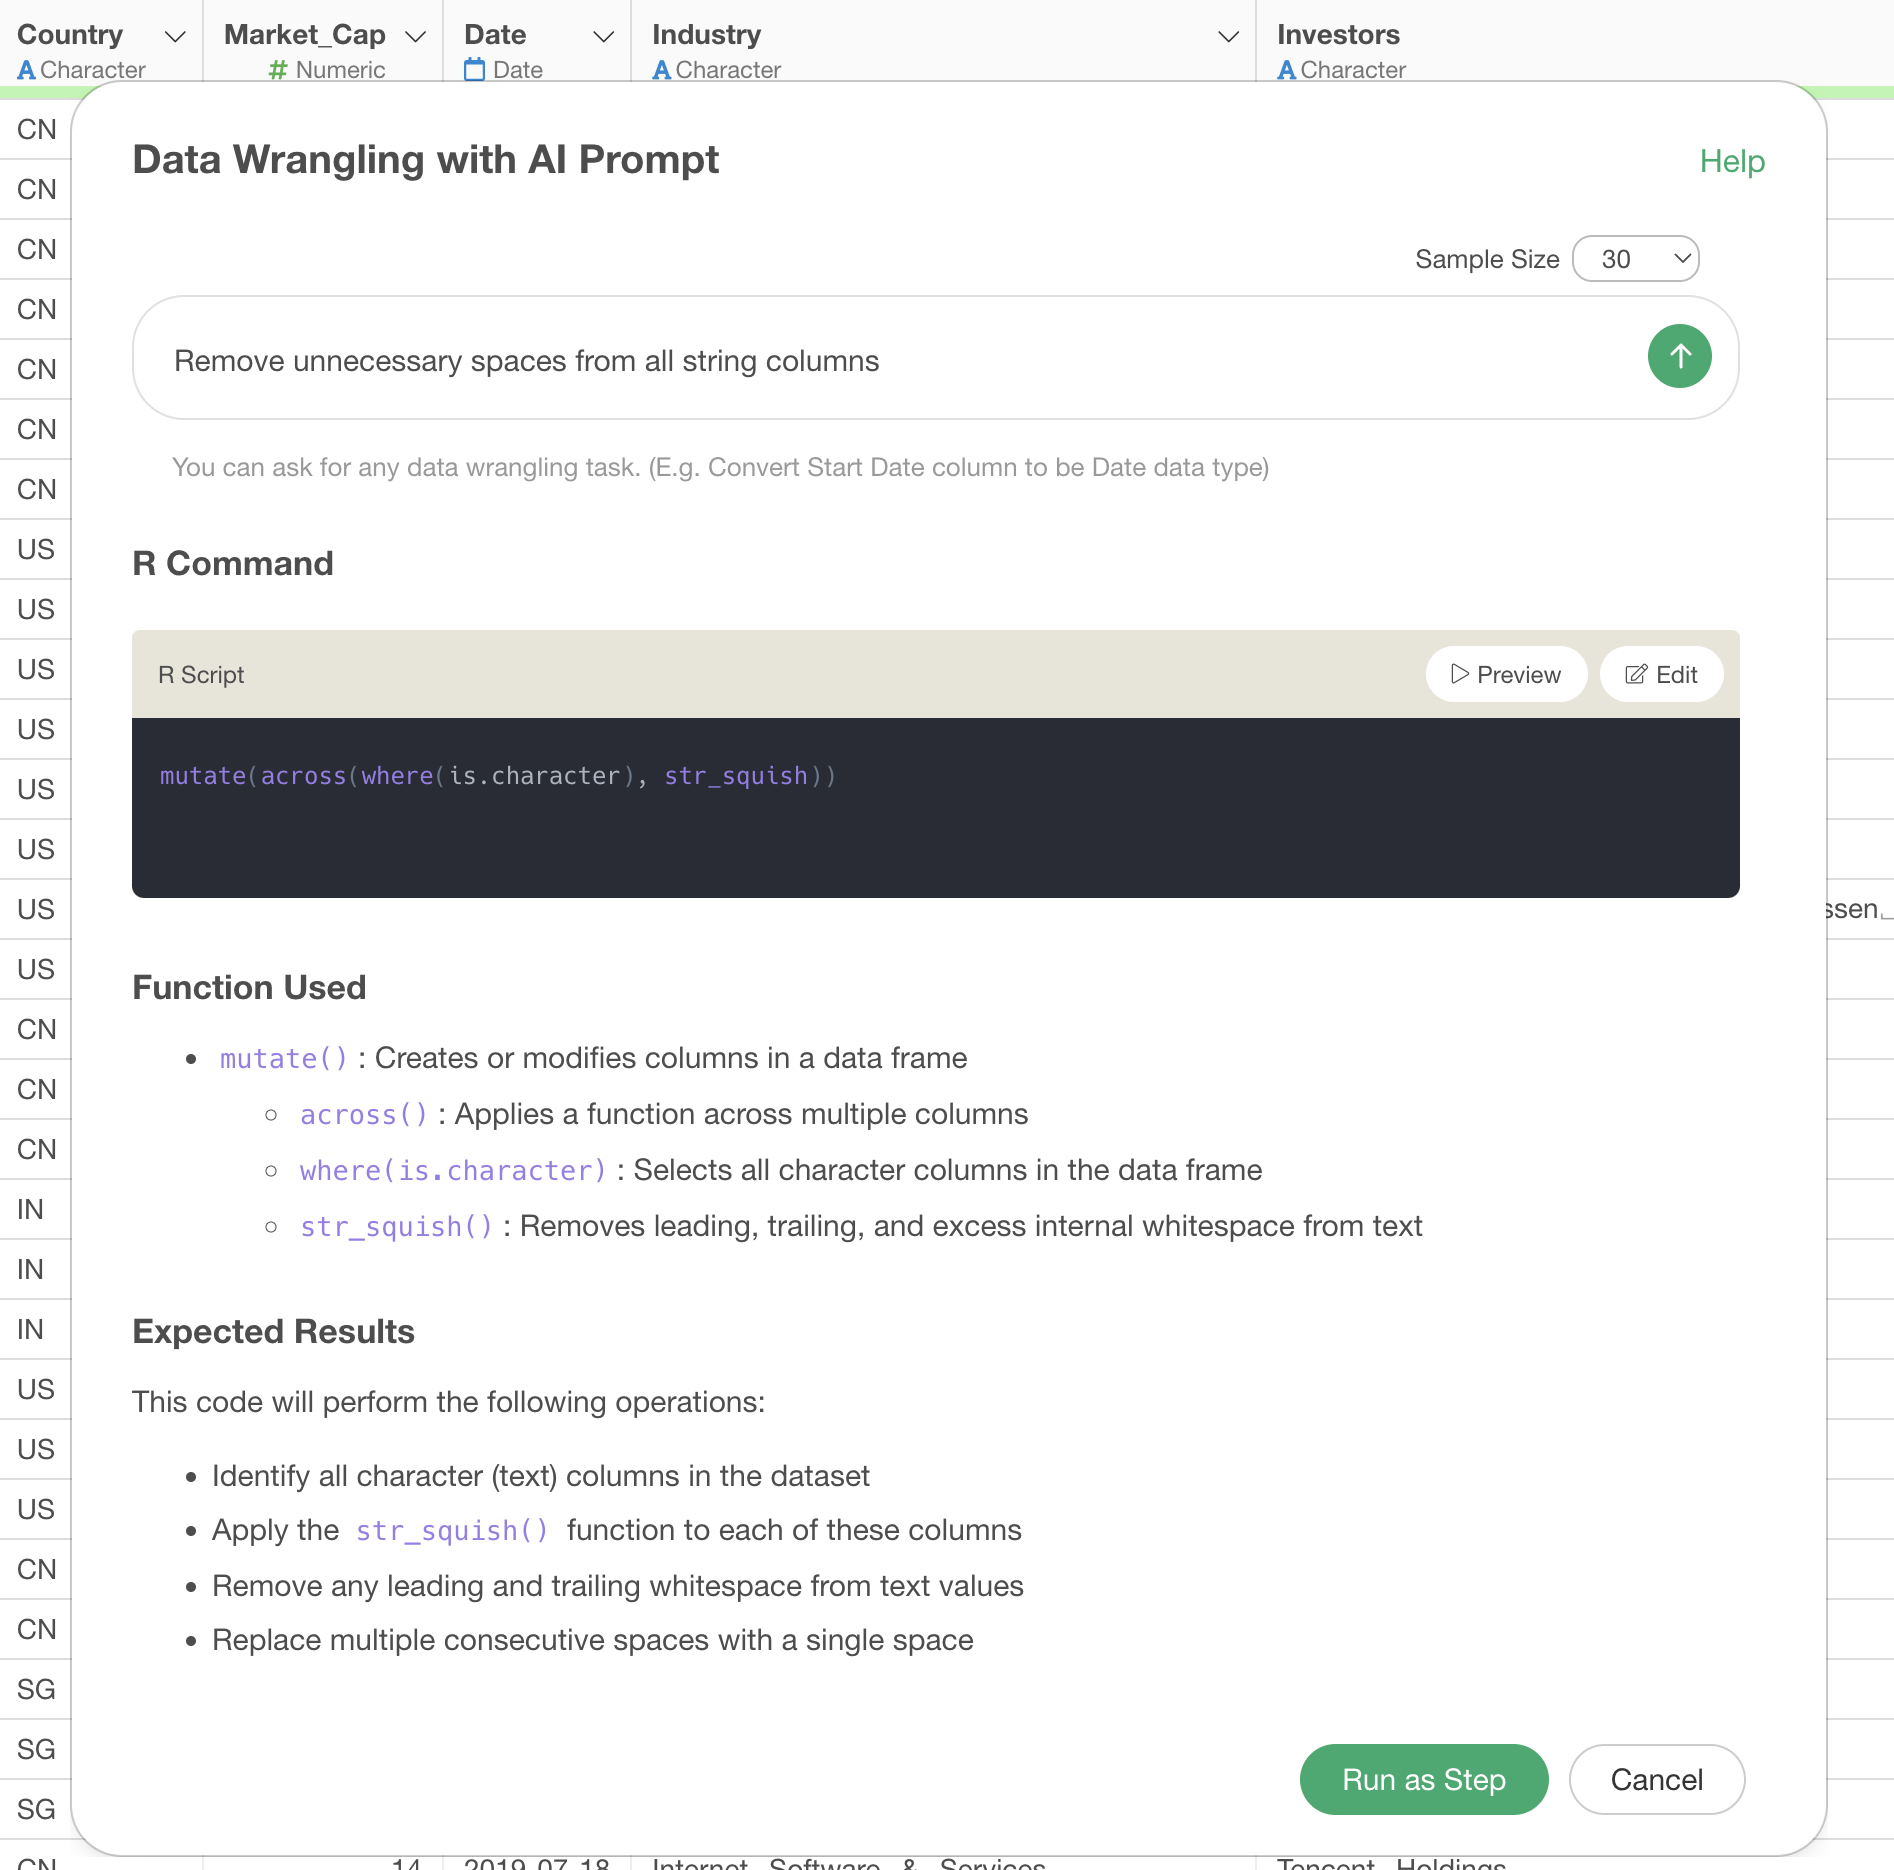
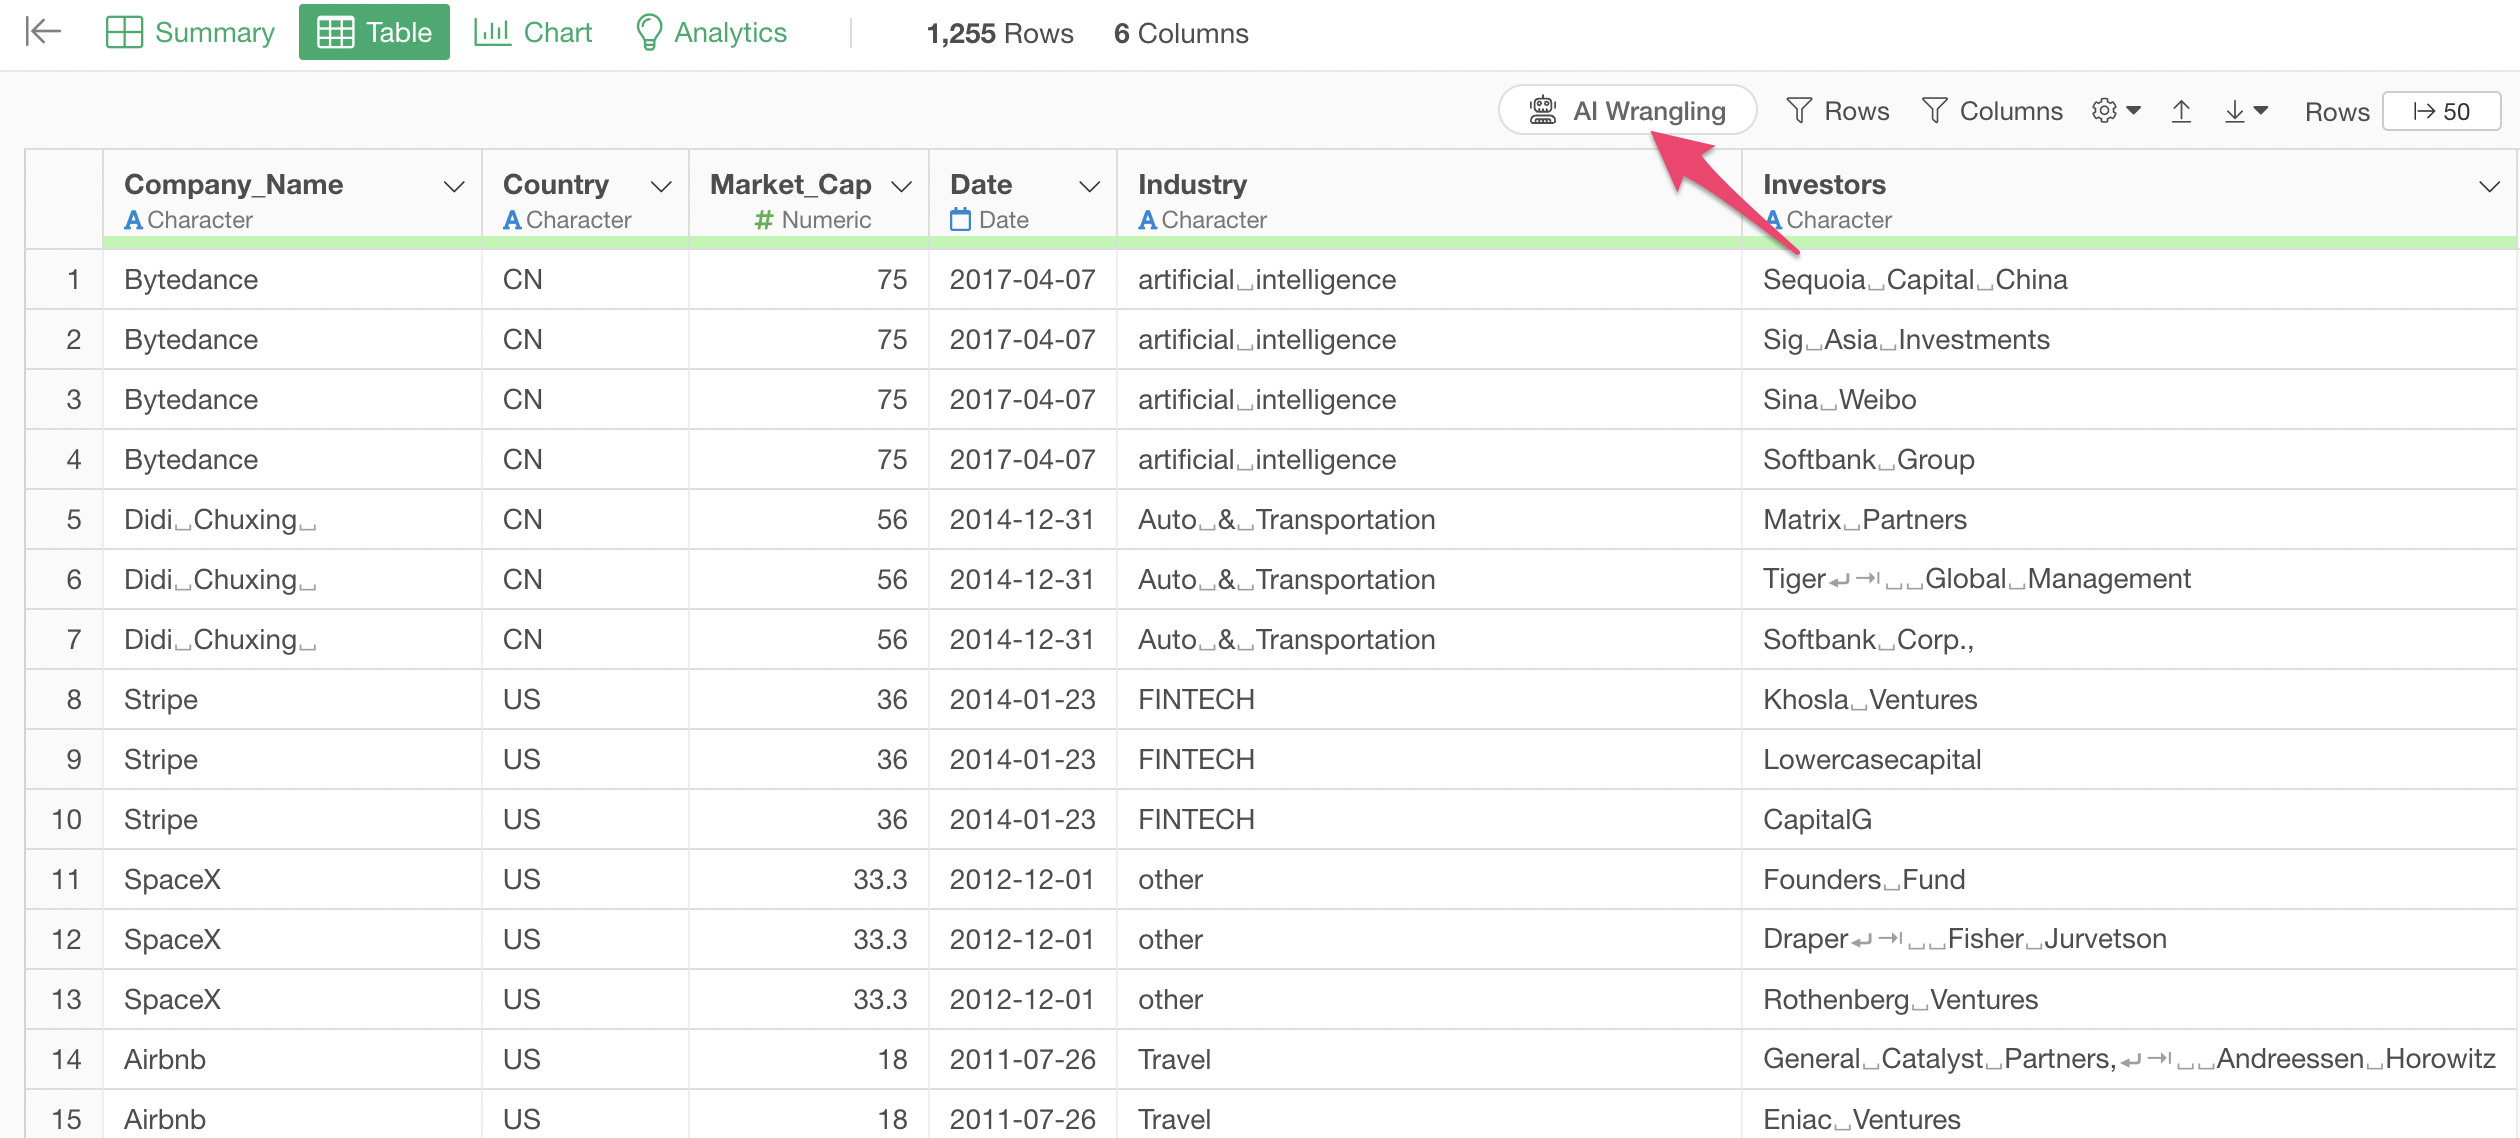
Remove Unnecessary Spaces from All Strings
In this example, we’ll use “Unicorn Companies.”

This data is about unicorn companies (privately held companies valued at over $1 billion), but the company names and investor strings contain extra spaces, tabs, and newline characters.

We want to remove these unnecessary spaces.
Click the “AI Wrangling” button from the table view to open the AI Prompt feature.
Enter the following prompt in the prompt input field:
Remove unnecessary spaces from all string columns
When you execute the prompt, AI automatically generates the following R script:
mutate(across(where(is.character), str_squish))
This code applies the str_squish function to all string
columns. This function removes leading and trailing spaces and replaces
consecutive spaces with a single space. It can also remove tab
characters and newline characters if present.
Click the “Run as Step” button to run the processing and see the results.
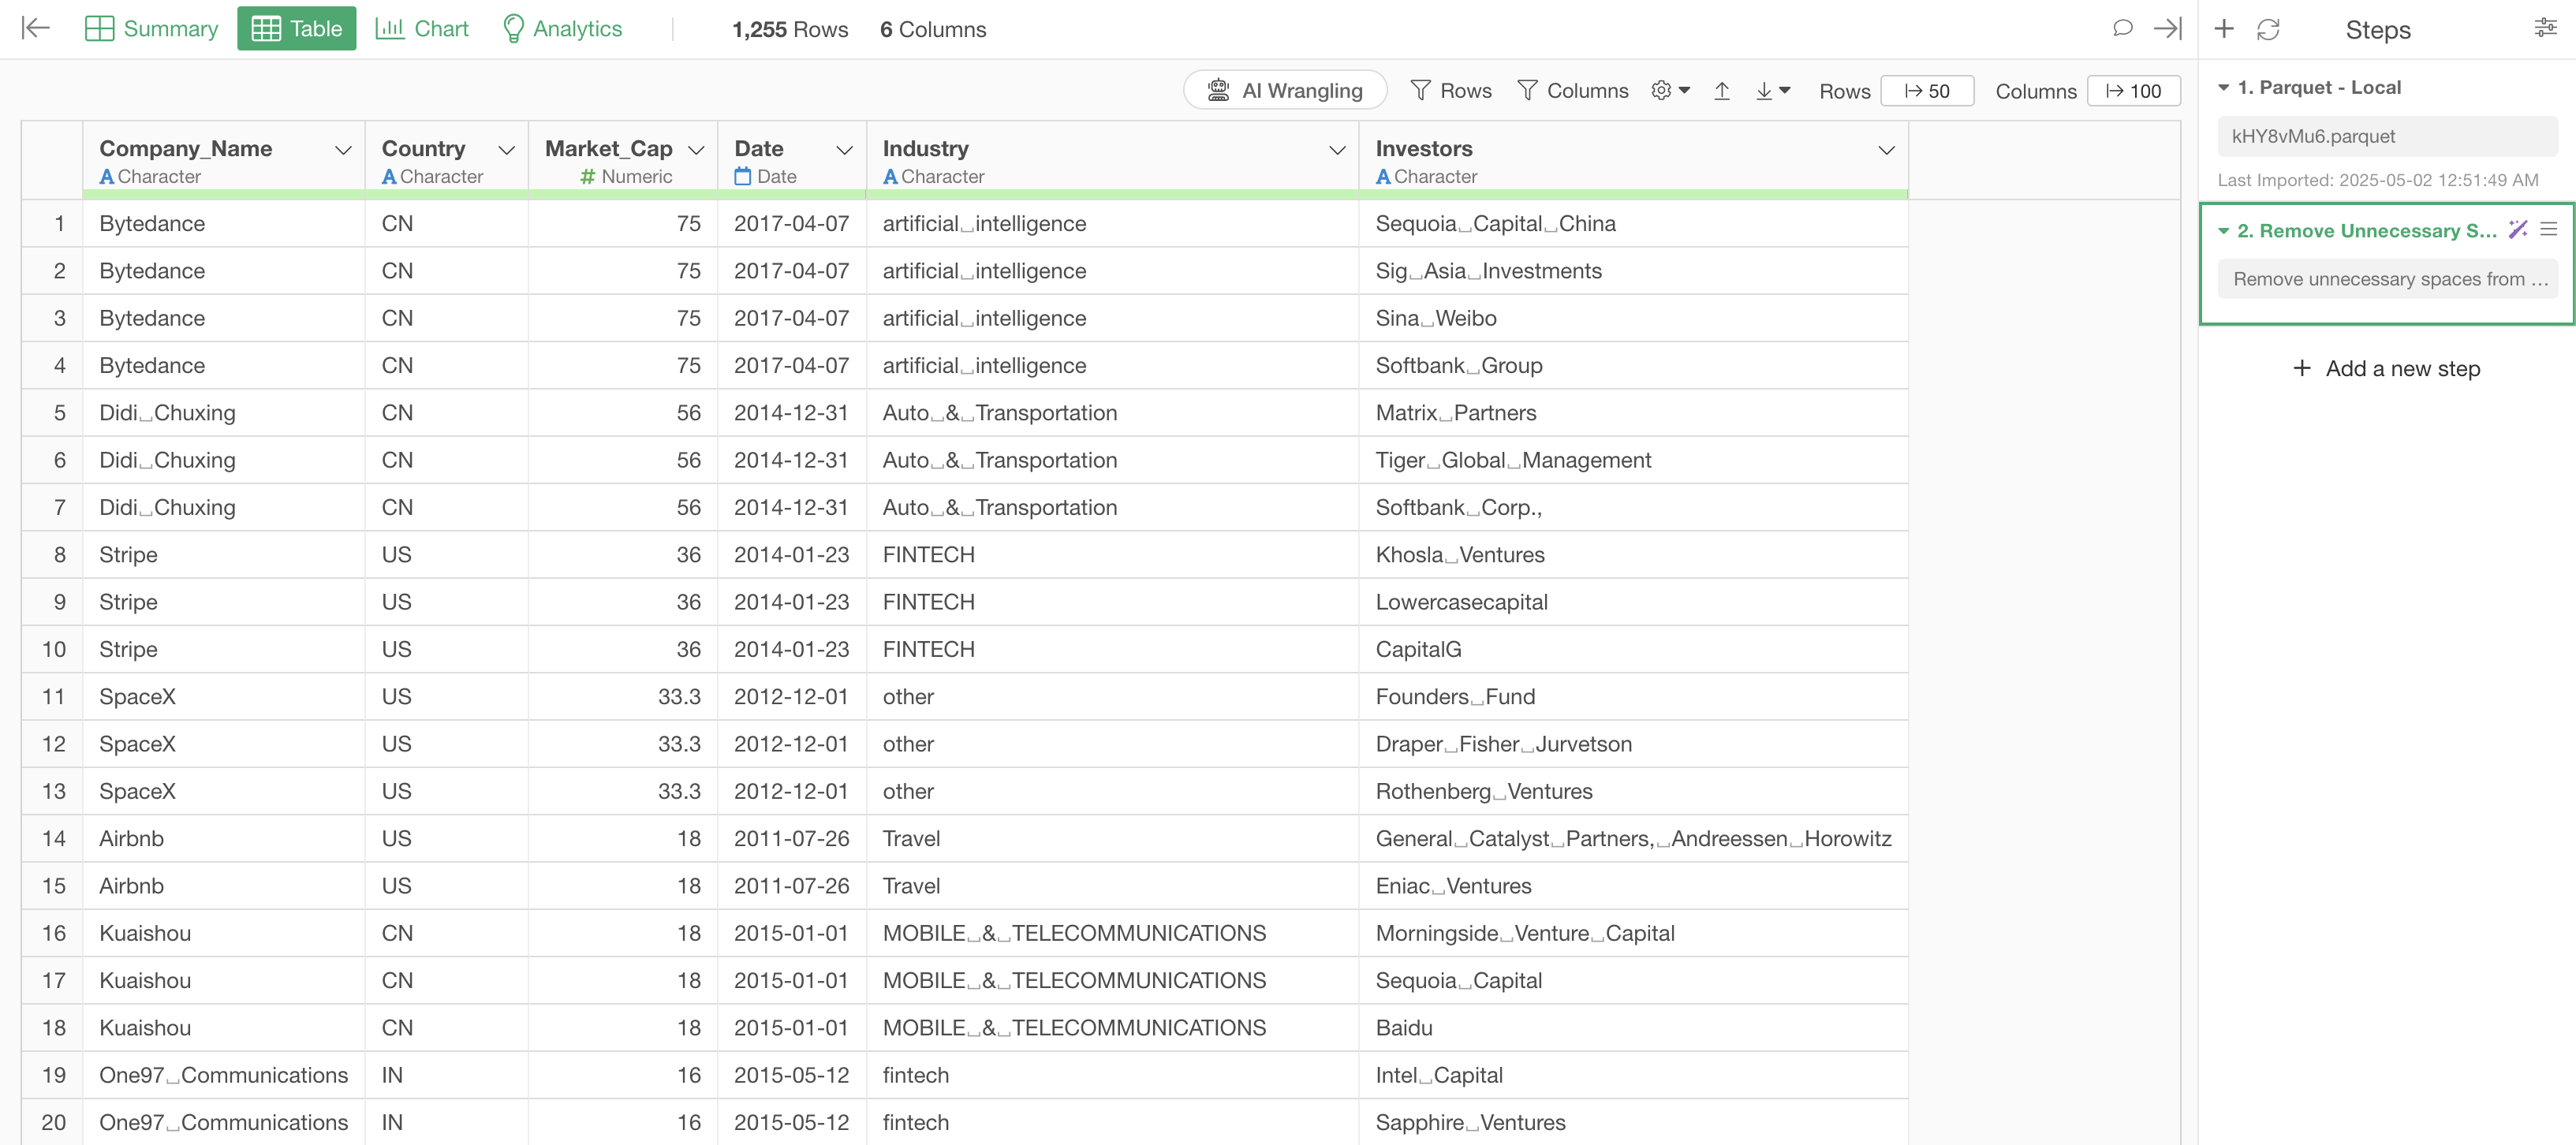
This has successfully removed unnecessary spaces from the strings.
3. Conclusion
Using Exploratory’s “AI Prompt” feature for batch calculation processing across columns can significantly improve the efficiency of data processing tasks. Because complex data processing can be executed with just natural language instructions, advanced data processing becomes possible even without specialized programming knowledge.
In particular, prompts like “normalize all numeric columns” or “remove unnecessary spaces from all strings” can achieve batch processing across multiple columns in just a few seconds. This allows you to dedicate more time to the essential aspects of data analysis (discovering insights and making decisions).
If you haven’t used Exploratory yet, please try the 30-day free trial!