Practices for Data Visualization Workshop
Variance, Distribution, Correlation
EDA (Exploratory Data Analysis)
An exploratory and iterative process of asking many questions and find answers from data in order to build better hypothesis for Explanation, Prediction, and Control.
2 Principle Questions for EDA
- Variance|How the variation in variables?
- Correlation|How are the variables associated or correlated to one another?
Take Away
- Visualize Variance with Histogram|Density Plot|Bar Chart
- Visualize Association and Correlation with Boxplot|Violin Plot|Scatter Plot|Stack Bar Chart
Data Source
MonthlyIncome
Q. How the variance of Monthly Income?
A. Manager’s Monthly Income range seems to be higher while Sales Rep & Research Scientist are lower.
MonthlyIncome by Gender
Q. Are there any differences in the Monthly Income variance between Male and Female. If so, how?
A. There is no clear difference between Female and Male. (It's even easier to see by Density Plot)
MonthlyIncome by JobRole
Q. Are there any differences in the Monthly Income variance among Job Roles. If so, how?
A. Manager’s Monthly Income range seems to be higher while Sales Rep & Research Scientist are lower. (It’s hard to see the differences among the Job Roles because they are on top of each other. Density Plot comes to help!)
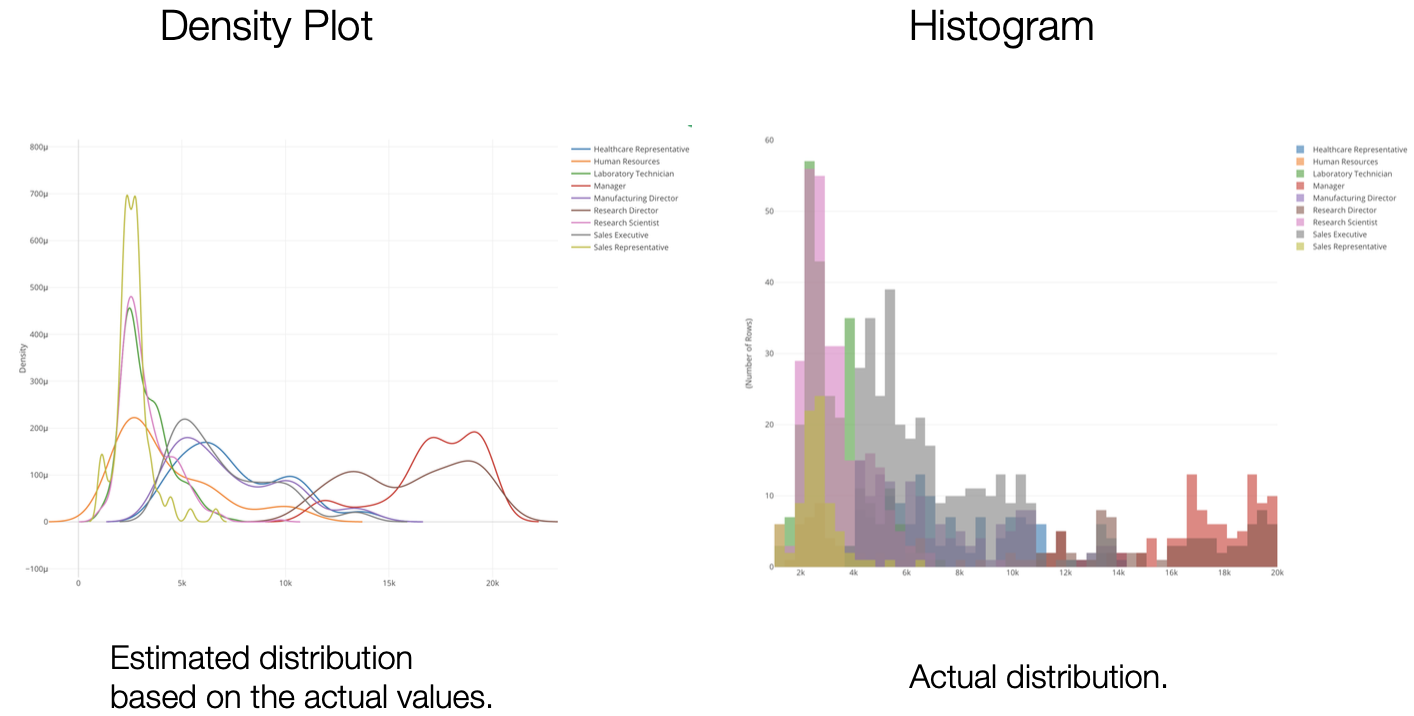
MonthlyIncome Density By JobRole
It’s easier to see the differences among Job Roles by Density Plot than Histogram.
Density Plot vs. Histogram
JobRole
Q. How the variance of Job Role?
A. Sales Executive, Research Scientists, and Laboratory Technician have the largest number of headcounts adding up to 60%.
JobRoleByGender
Q. Are there any differences in the Job Role variance between Male and Female. If so, how?
- Some Job Roles like Sales Executive, Research Scientists, etc. have much more males than female while there isn’t much difference between for Manufacturing Director.
Income|JobRole (Numerical vs. Categorical by Box Plot)
Q. How is the variance of Monthly Income associated with Job Role?
A. By BoxPlot we can see three ranges of Monthly Income by Job Roles.
- Higher: Manager, Research Director
- Middle: Healthcare Representative, ...
- Lower: Human Resources, ...
Income|JobRole (Numerical vs. Categorical by Violin Plot)
Q. How is the variance of Monthly Income associated with Job Role?
A. By ViolinPlot we can see three ranges of Monthly Income by Job Roles and also the distribution (density) of Incomme for each Job Role.
- Higher: Manager, Research Director
- Middle: Healthcare Representative, ...
- Lower: Human Resources, ...
Income|Age (Numerical vs. Numerical by Scatter Plot)
Q. How is the variance of Monthly Income correlated with the variance of Age?
A. The income increases as the age increases. By ScatterPlot and Trend Line of Linear Regression we can see there is a correlation of strength 0.49.
Income|WorkYears (Numerical vs. Numerical by Scatter Plot)
Q. How is the variance of Monthly Income correlated with the variance of Total Working Years?
A. The income increases as the working years increase. By ScatterPlot and Trend Line of Linear Regression we can see there is a strong correlation of strength 0.77.
Income|WorkYears (Numerical vs. Numerical -> Categorical)
Q. How is the variance of Monthly Income correlated with the variance of Total Working Years?
A. There is a huge jump in Monthly Income after 20th years of working in this company. And up till 16th years, the income increases as the working years increase. But after 20th years, there is no obvious correlation between the working years and the income.
Income|WorkYear by JobRole (Numerical vs. Numerical by Scatter Plot + Repeat by...)
Q. Are there any differences in the correlation between Monthly Income and Total Working Years among Job Roles? Which Job Roles have similar kind of correlation?
Strong correlation: Healthcare Representative, Human Resources, Manufacturing, Reserch Director (work longer, paid better)
Middle correlation: Sales Executive, Manager, Research Scientist.
Weak correlation: Laboratory Technician, Sales Represntative.
Income|Gender (Numerical vs. Categorical by Violin Plot)
Q. How is the variance of Monthly Income associated with Gender?
A. There is no clear association.
JobRole|Education (Categorical vs. Categorical by Stacked Bar)
Q. How is the Job Role associated with the Education?
A. Life Science is the majority among all Job Roles. Sales Executive/Representative has more people of background in Marketing. Human Resources has more people of background in its own specialty.
JobRole|Attrition (Categorical vs. Categorical by Stacked Bar)
Q. How is the Job Role associated with the Attrition?
A. Sales Representative has the highest turnover rate up to 40%,
JobRole|Income (Categorical vs. Numerical -> Categorical by Stacked Bar)
Q. How is the Job Role associated with the Monthly Income?
- Manager and Research Director have higher ratio of higher income people.
Time Series
Take Away
- Date Aggregation Level
- Window Calculation - Cumulative Sum (Running Total)
- Group by Color
- ‘Others’ Group
- Repeat By for Multiple Charts
- Highlight
- Date / Time Sensitive Filtering
- Window Calculation - Difference, % of Difference, Moving Average
- Trend Line - Line, Smooth
Data Source
Airbnb Listing Data for New York City https://exploratory.io/data/kanaugust/Airbnb-Listing-Data-for-New-York-City-OPV5XdB9uw
Historical US Stock Prices Data of Tech Giants
host_since
Q. How is the trend of the number of properties at Airbnb over the years? Is the trend steadily increasing? Are there any change points of the trend?
A. The total number of hosted properties increased very rapidly especially from 2013 to 2016, but then it slowed down for a bit after that.
host_since|region
Q. Is the trend same among different regions? Which regions did contribute the rapid growth?
- Manhattan (Green) and Brooklyn (Orange) are the 2 regions that contributed the overall trend. They started diverging after 2017Q3
host_since|neighborhood
Q. Is the trend same among different neighborhoods? Which neighborhood did contribute the rapid growth?
A. * Williamsburg (Light Blue) and Bedford-Stuyvesant (Blue) and are the significant top 2. The number of properties started picking up as early as 2011. * Bedford-Stuyvesant (Blue) catched up with Williamsburg (Light Blue) at 2019. * The growth speed for Williamsburg seems to have settled after 2016.
host_since|region|property type
Q. Are regions growing rapidly in some particular property types?
A. Apartment has significant growth among all.
Stock Price
% Difference from
Trend
Moving Average
Uncertainty
Take Away
- The variance and the (sample) data size are the important factors when considering the difference among the categories. The bigger the (sample) data size is the more trust we want to give.
- Average (Mean) is sensitive, it can be influenced significantly by extreme values, especially when the (sample) data size is small.
- When comparing the categorical values we can use the Ratio, but the ratio can be also vary, especially when the size is small.
To compare the means or the ratios we should take account of the variance in the data and the size of the data.
- Confidence Interval is a useful tool that gives us the context around the mean and the ratio. It helps us compare the means and the ratio and conclude if there are any differences that should be investigated further.
95% Confidence Interval gives us the range of 'True Mean' by computing condifence intervals of all 'Sample Mean'. i.e., 95% of the confidence intervals of 'Sample Mean' should inclue the 'True Mean' of the population.
Error Bar chart is your friend if you want to compare the means or the ratios with confidence interval.
Data Source
Income|Gender|JobRole
- Compare the average (mean) Monthly Income between Male and Female.
- Compare it for each Job Role and find if there is disparity between Male and Female for any Job Roles.
- Only the Research Director has a notable difference between Male and Female.
Gender Ratio by Job Role
- Compare the ratio of Male and Female.
- Compare it among the Job Roles and find if there are any different patterns.
- Some Job Roles have notable differences in terms of the ratio, but some don’t.
- The Attrition Rate for Sales Representative is significantly higher than the others.
Attrition Rate by Job Role
Comparing the Attrition Rates among Job Roles.
- There seems to be 3 groups based on the Attrition Rates.
- Change the data type of Attrition to 'logical'.
- Switch the ‘Ratio by’ from ‘All’ to ‘X-Axis’.
Reference
Online Seminar - Data Visualization Workshop https://exploratory.io/note/kanaugust/Data-Visualization-Workshop-YAZ6azM0MU